Monitor applications
Consistently monitoring applications allows you to proactively detect issues, troubleshoot performance bottlenecks, and quickly respond to service disruptions, minimizing downtime and improving the overall user experience. To access monitoring information, go to Registry > Applications, and on the All applications tab, open the Actions menu next to an application.
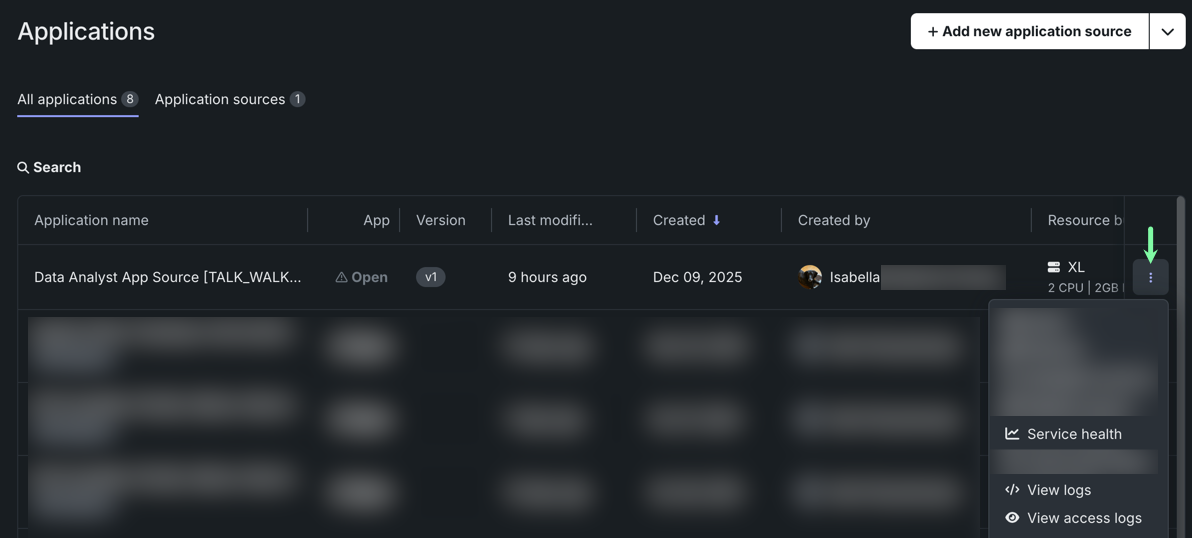
From here, you can access the following monitoring options:
- Service health: Provides a dashboard that displays memory, CPU, and network usage.
- View logs: Displays history of compiling, building, and executing the application.
- View access logs: Displays which users have accessed the application and when.
Resource usage
Permissions to view service health
Only users with Owner permissions for the application and DataRobot administrators can access service health.
The Service health tab allows you to monitor usage, service health, and resource consumption for individual applications. Monitoring resource consumption is essential for cost management to ensure that resources are used efficiently, helping optimize cost.
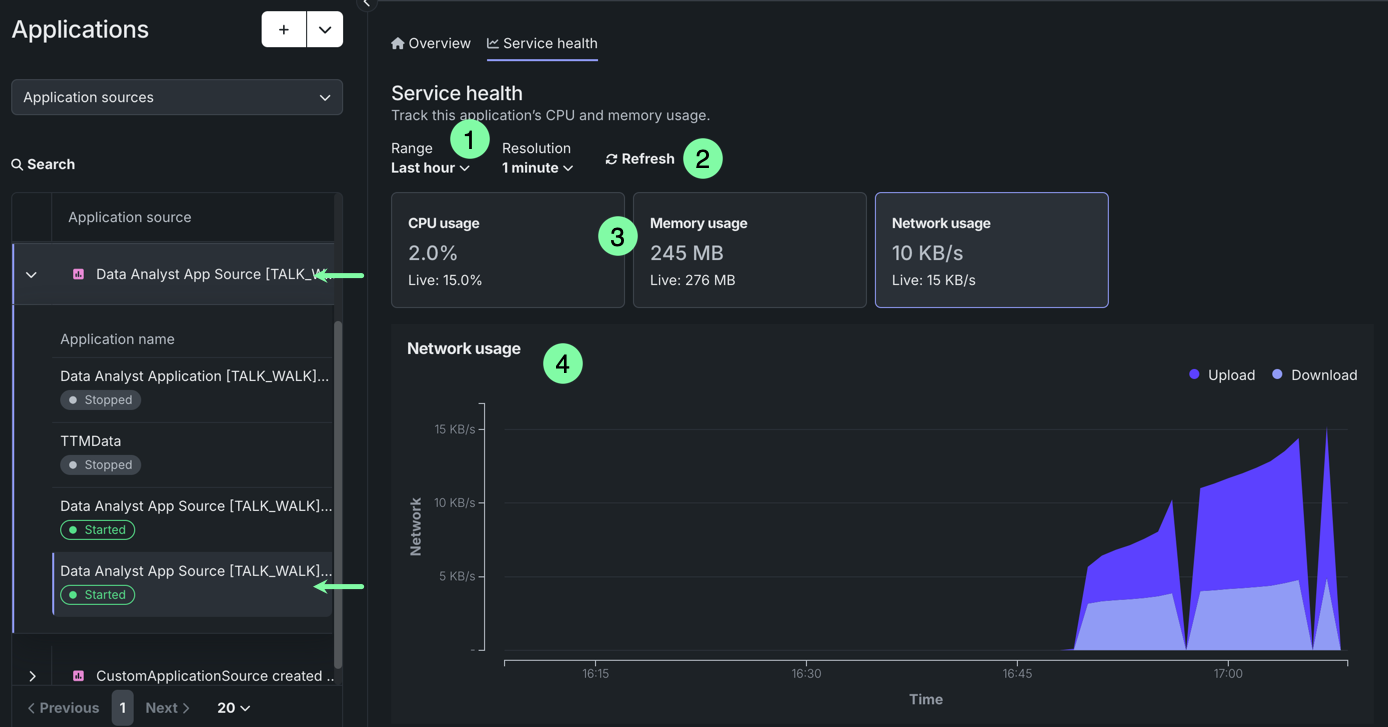
To access application monitoring capabilities, in Registry > Applications. Open the Actions menu next to the application you want to view and select Service health.
Both the application source and application are highlighted in the left panel. From here, you can:
| Element | Description | |
|---|---|---|
| 1 | Range/Resolution | Adjusts the range and resolution of the chart. The options in the Resolution dropdown are based on your Range selection. |
| 2 | Refresh | Instantly refreshes usage information—usage information automatically updates every minute. |
| 3 | Resource usage | Displays average CPU, memory, and network usage for the specified range, as well as live usage values. Click on a tile to visualize usage information in the chart below. |
| 4 | Usage chart | Visualizes usage information over time for the selected usage tile and specified range. For CPU usage, you can also display a line representing the average usage. |
Application logs
Permissions to view logs
Access to logs for an application requires Owner or Editor permissions for the application. Owners can view all logs, while Editors can only view build and runtime logs, not access logs.
DataRobot records two types of logs for custom applications: build and runtime logs and access logs. Through these logs, you can monitor an application's build and runtime tasks and review the user access history for an application.
Build and runtime logs
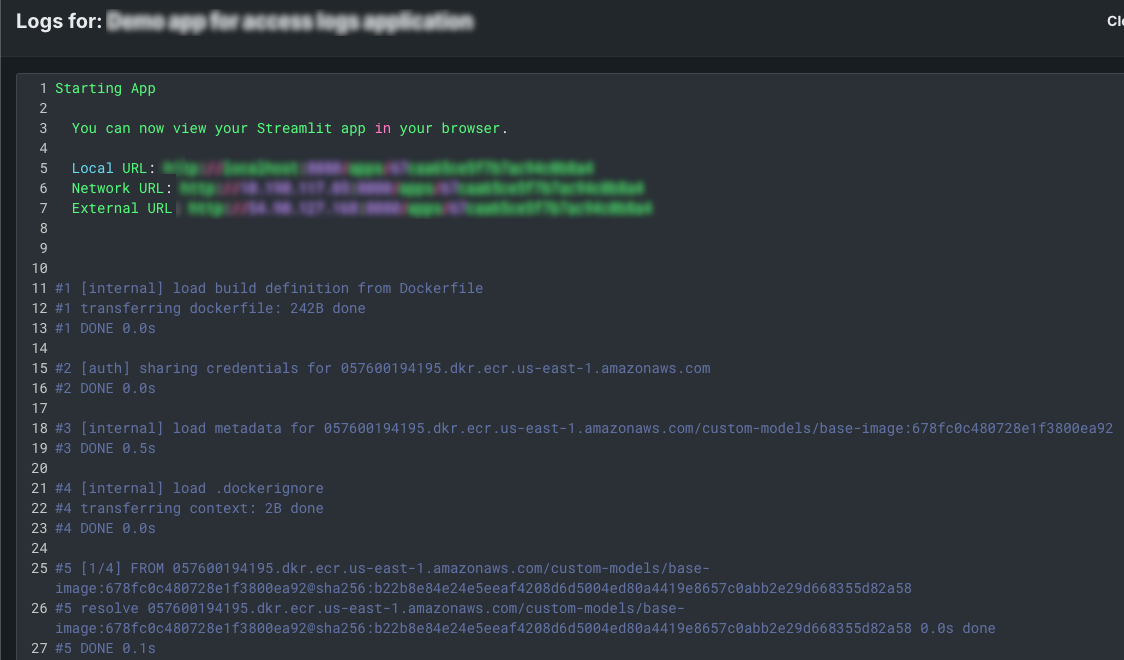
You can browse logs that detail the history of build and runtime tasks for a custom application. From the Applications page, open the Actions menu for the app you want to view logs for, and click View logs.
The logs modal details the history of compiling, building, and executing the custom application. This includes dependency checks, packaging, and any warnings or errors thrown.
Access logs
Browse access logs to monitor the history of users who have opened or operated a custom application. To view access logs, navigate to the Applications page, open the Actions menu for the app you want to view logs for, and click View access logs.
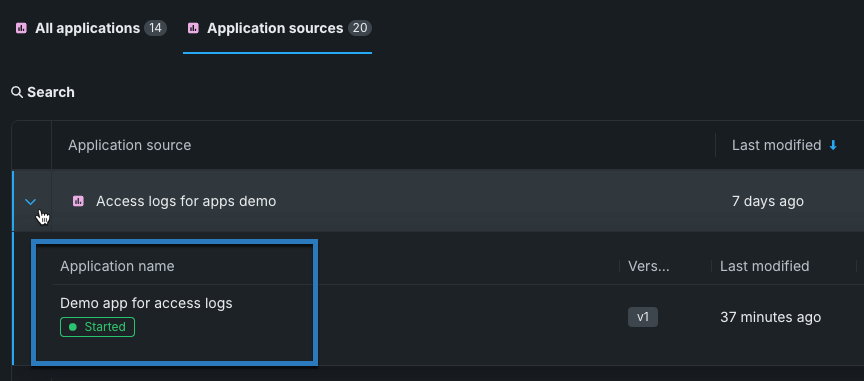
You can also view access logs directly from an application source. Navigate to the Application sources page, locate the application source for your custom application, and expand the dropdown to view the applications built from the source. Then you can click the custom application for which you want to view the access logs to access a detailed view.
From the detailed view for a custom application, scroll down to the Access logs section.
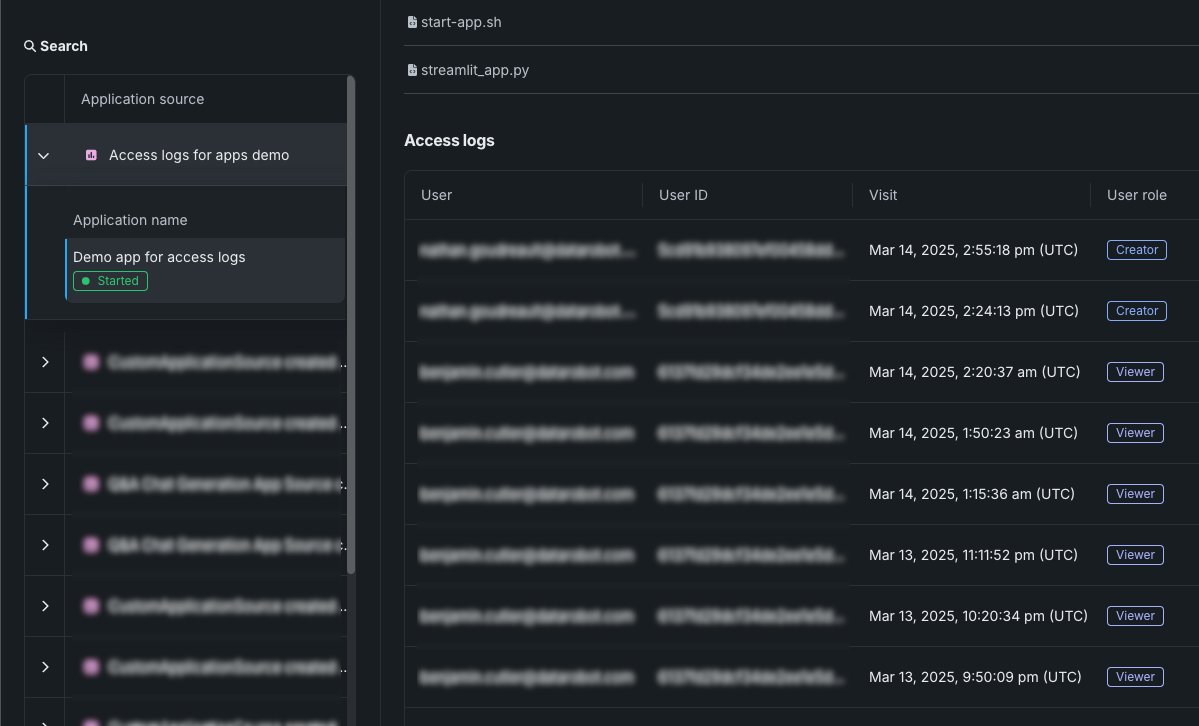
The access logs detail users' visits to the application, including their email, user ID, time of visit, and their role for the application.
Usage logging interval
In addition to the initial access event, every 24 hours of continuous access or use is recorded as an individual visit to the application. For example, when a user opens an application, an access event is logged, then, when that user session exceeds 24 hours of continuous access or use, another access event is logged. This results in two access events logged during a 24-hour and 1-minute custom application visit. In Self-Managed AI Platform environments, this interval is configurable through the CUSTOM_APP_USAGE_METRIC_PUBLISH_MAX_FREQ in the application configuration.