エクスペリメントのインサイト
| タイル | 説明 |
|---|---|
 |
すべてのモデルについて、エクスペリメントレベルの情報を提供するインサイトを開きます。 |
エクスペリメントのインサイトは、モデルのコンテキスト情報を提供するツールです。
学習曲線
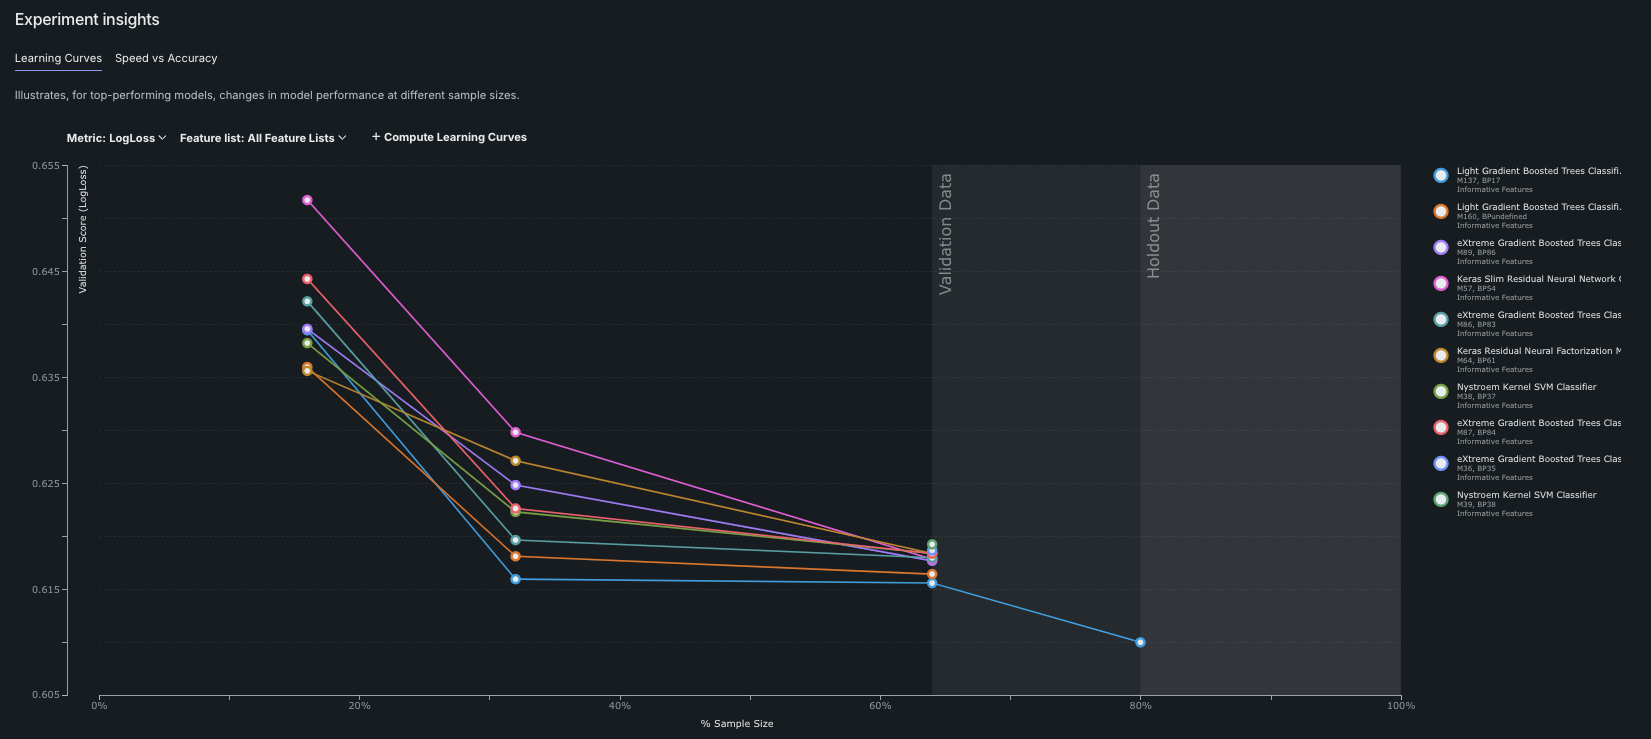
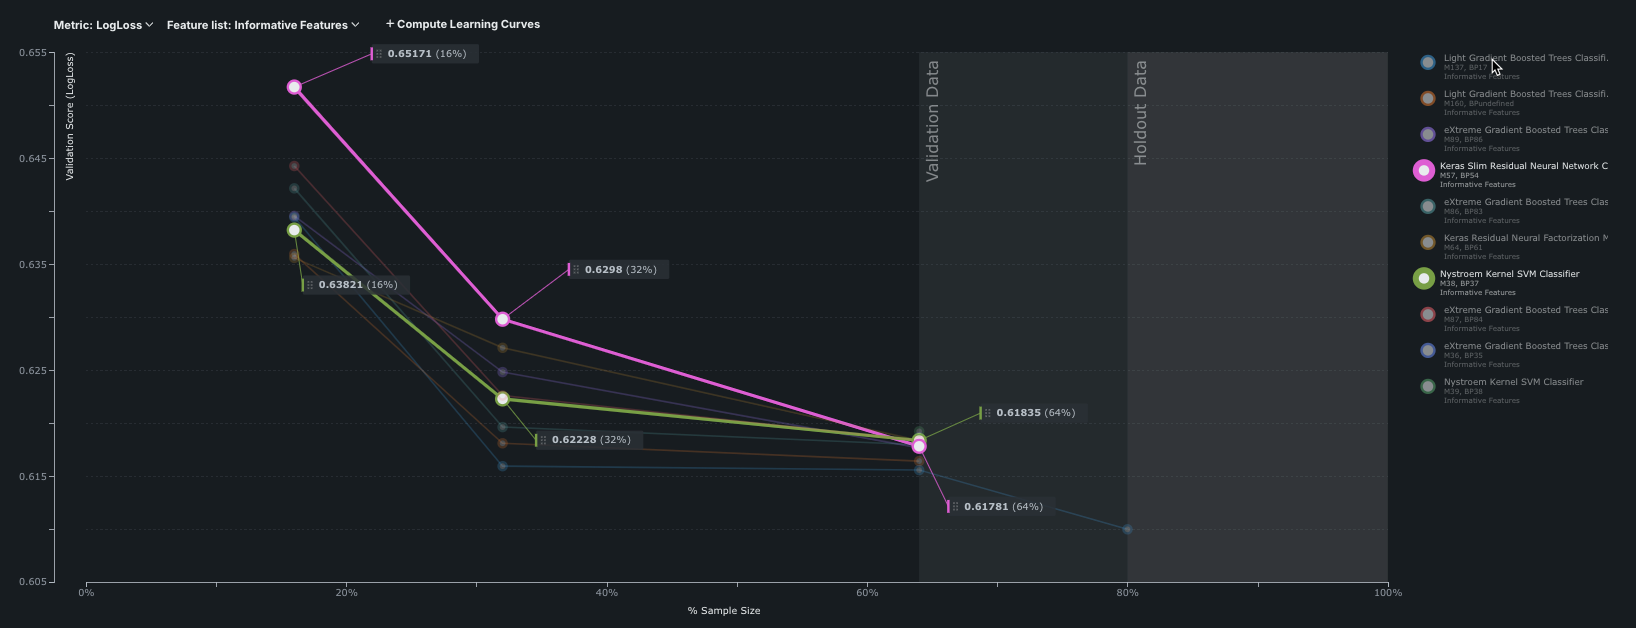
学習曲線は、データセットのサイズを増やす価値があるかどうかを判断するのに役立ちます。 追加データを入手するにはコストがかかる場合がありますが、モデルの精度が向上するのであれば、そうするだけの価値があるかもしれません。 このグラフは、パフォーマンスの高いモデルについて、サンプルサイズが変化するにつれモデルパフォーマンスがどのように変化するかを示します。 リーダーボードの並べ替え設定とは別に、指標ドロップダウンを結果の並べ替えに利用できます。 トレーニングパーティションと検定パーティションにおいて複数のサンプルサイズで計算された際のモデルグループのパフォーマンスがグラフ化されます。 このグループ化はグラフ上の線を表し、線上の各点は、そのグループ内の個々のモデルのサンプルサイズとスコアを表しています。
DataRobotでは、表示するモデルの選択がどのように計算されますか?
学習曲線グラフでは、ドロップダウンで選択したメトリックを使用してモデルの精度がプロットされます。たとえば、LogLossを選択すると、ログ損失が低いほど精度が高くなります。 各データサイズ実行に関して、パフォーマンスが上位10件のモデルlog lossがプロットされます。 結果として得られた曲線は、特定の量のトレーニングデータに対して各モデルがどの程度のパフォーマンスを発揮するかを予測するのに役立ちます。
DataRobotでは、ブループリントIDと特徴量セットによってモデルがグループ化されます。 したがって、たとえば有用な特徴量という特徴量セットを使用して構築されたそれぞれのRegularized Logistic Regressionモデルは、単一のモデルグループです。 異なる特徴量セットを使用して構築されたRegularized Logistic Regressionモデルは、異なるモデルグループに属します。
初期設定では、DataRobotは以下の要素を表示します。
- グループ化されたモデルのうち、上位10個まで。 たとえば、1つまたは複数のモデルが最上位モデルから大きく逸脱している場合、モデルの数は10未満になる可能性があります。 その分岐モデルはグラフの整合性を維持するために一種の外れ値として扱われ、プロットされません。
- スコアが自動的に決定されたしきい値(重要なデータポイントとグラフの見やすさを重視)内に収まるアンサンブルモデル。
値の表示
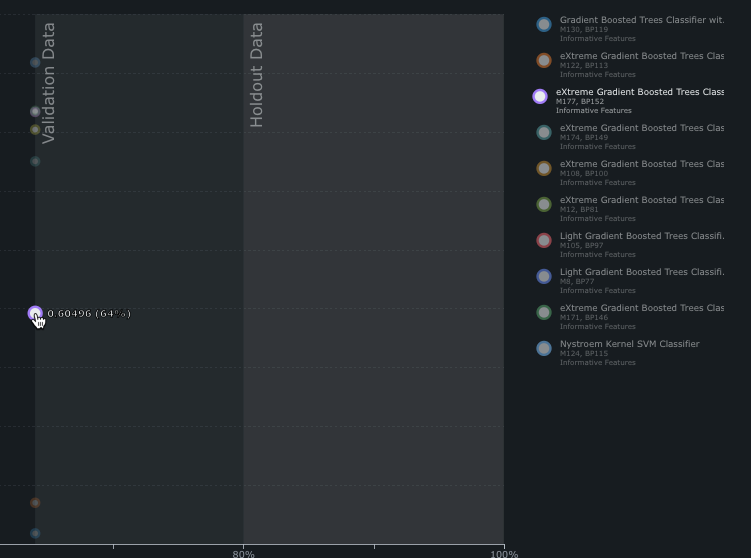
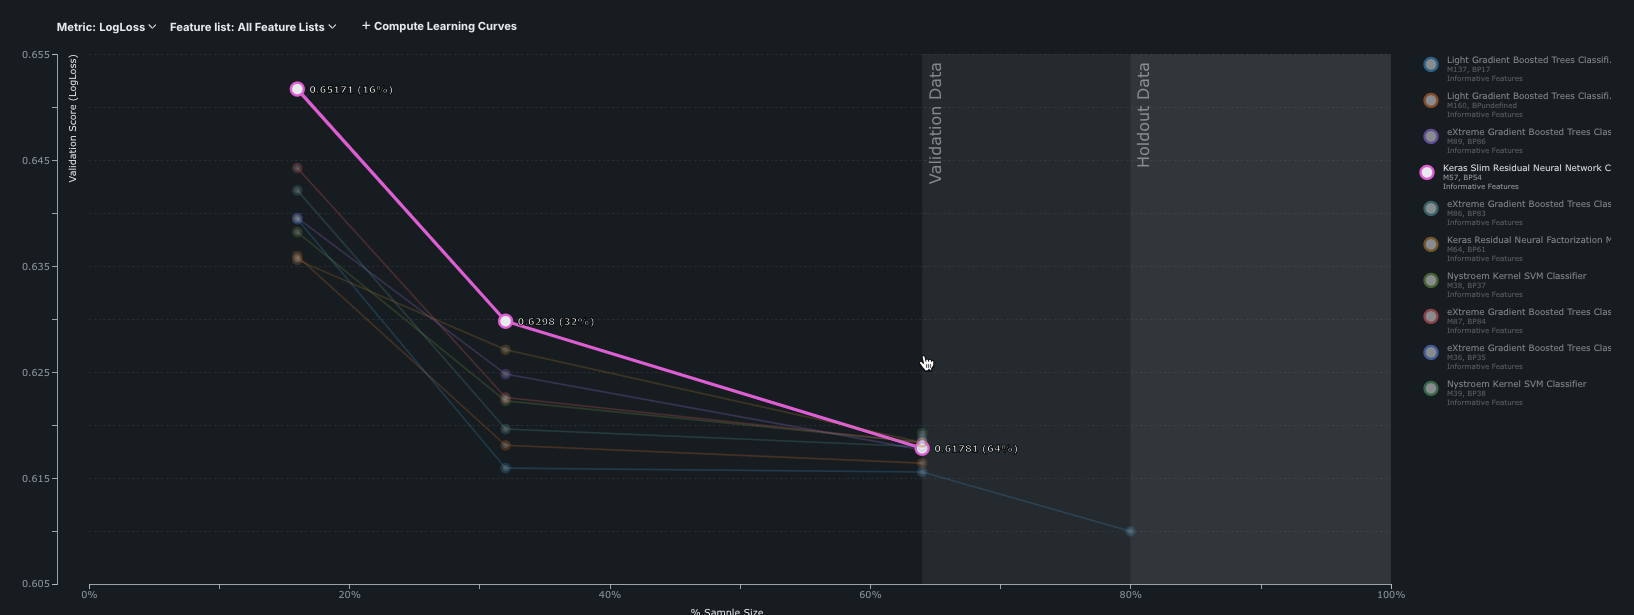
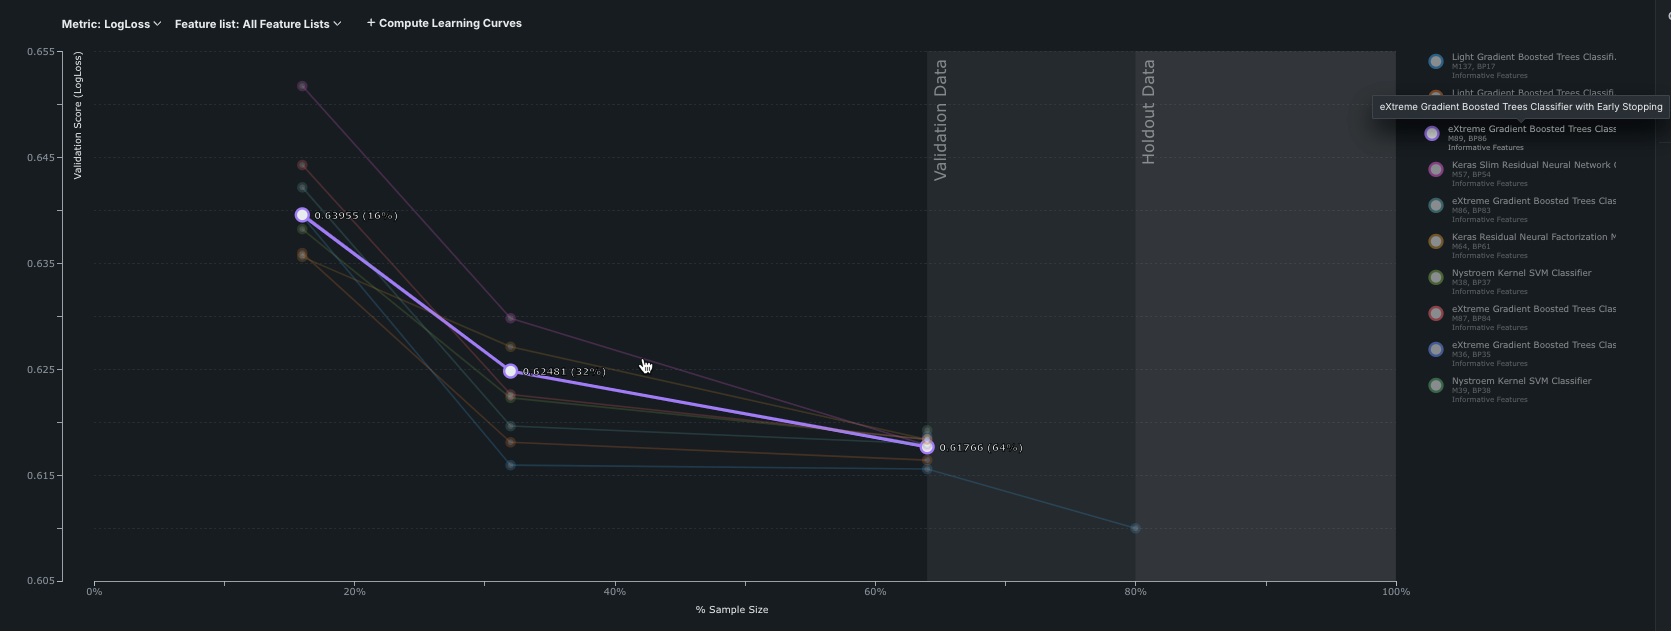
曲線の点の値を確認するには、マウスオーバーするかクリックします。 該当するモデルがモデルリストでハイライトされます。
備考
包括的モードを実行した場合、すべてのモデルですべてのサンプルサイズがグラフに表示されるわけではありません。 この理由は、大きいサンプルサイズのデータでDataRobotが再実行する際に、前回の実行で得られた最高のスコアリングモデルのみが次のステージで使用されるからです。 また、特定のモデルのポイント数は、データセットの行数によって異なります。
フィルタービュー
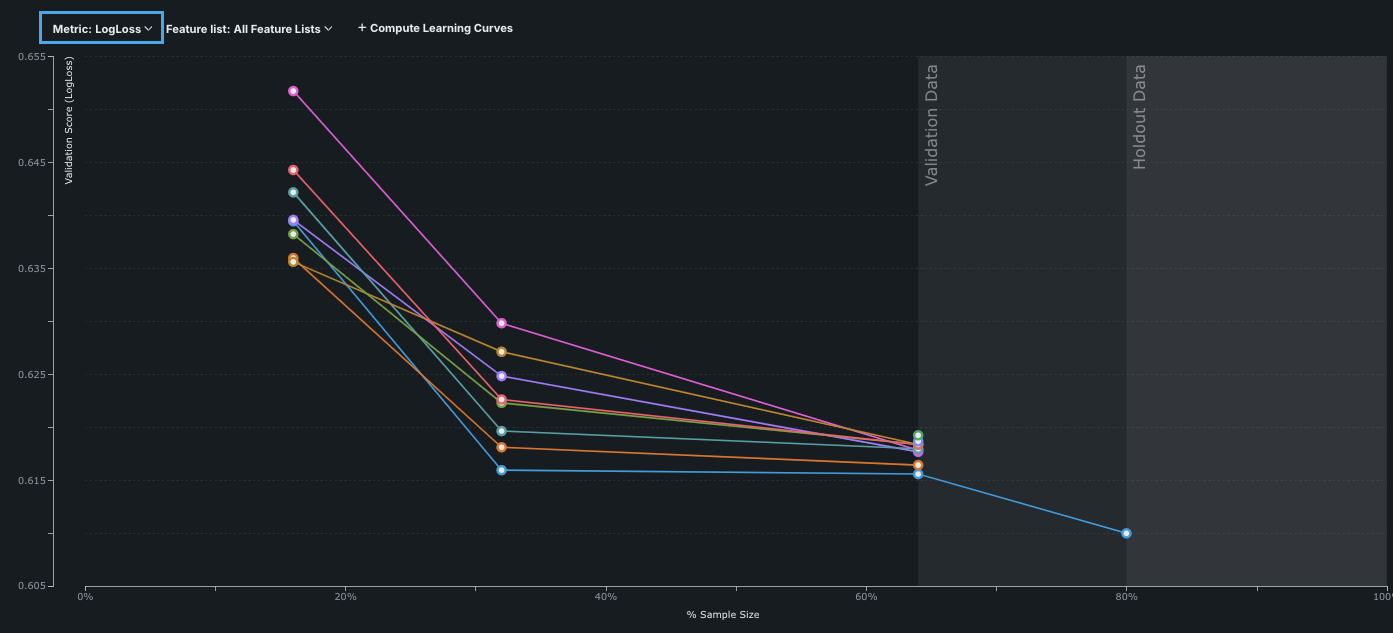
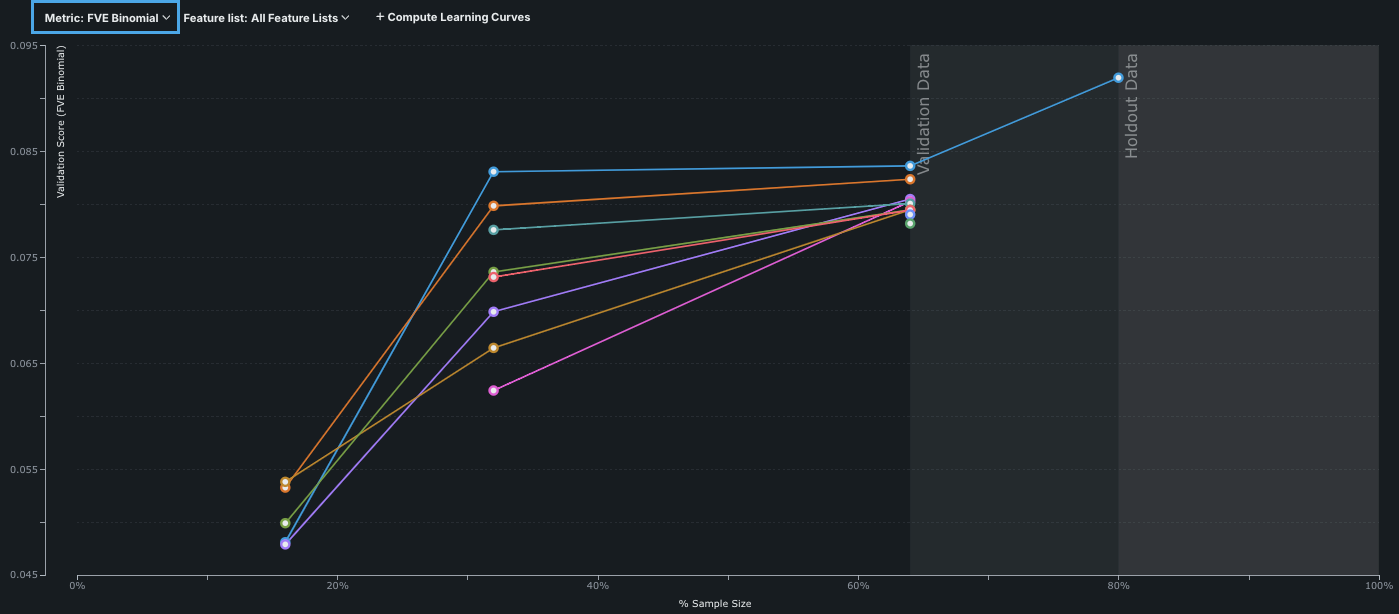
学習曲線の表示は、指標または特徴量セットでフィルターできます。 結果を比較するための指標を選択します。 たとえば、以下の図はLogLossとFVE Binomialの結果を示しています。
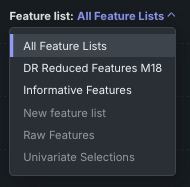
デフォルトでは、グラフは特徴量セット「有用な特徴量」を使用してプロットされます。 特徴量セットドロップダウンメニューを使用して、カスタムセット(モデルの実行に使用された場合)を含む、別の特徴量セットのモデルを表示するようにグラフをフィルターします。 メニューは、プロジェクトに属する全特徴量セットを一覧表示します。 特徴量セット上でモデルを実行していない場合、オプションは無効な状態で表示されます。
新しいサンプルサイズの計算
クイックオートパイロットでは1段階のトレーニングが使用されるため、学習曲線グラフには、最初はパフォーマンスの上位10モデルについて1つずつしか点が表示されません。 表示点を増やすには、学習曲線を計算するオプションを使用します。
サンプルサイズに関する備考
-
サンプルサイズを追加すると、新しく入力されたサイズに対して再計算が行われます。 計算はすべてのモデルに対して実行されますが、右側のリストから1つ以上のモデルを選択した場合は、選択したモデルに対してのみ実行されます。 リクエストあたりのサンプルサイズは5つに制限されていますが、複数のリクエストを使用してグラフに任意の数の点を表示できます。 学習曲線を計算で追加したサンプルサイズは、そのセッションでのみ記憶され、自動入力されます。ページから移動した場合、そのサンプルサイズは維持されません。
-
リーダーボードから新しいサンプルサイズでトレーニングを行った場合、非典型的なサイズ(新しいモデルを追加するダイアログで、用意されている選択肢にないサイズ)は、学習曲線グラフには自動的に表示されません。ただし、グラフから追加することは可能です。
-
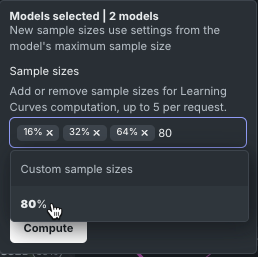
最初は、サンプルサイズフィールドにはデフォルトのスナップ先サイズ(通常、16%、32%、64%)が入力されています。 フィールドで受け入れられるのサイズはリクエストごとに5つだけなので、追加のカスタムサイズが2つ以上ある場合、すでにプロットされているデフォルト値を削除できます。 (グラフで使用できるかどうかは、プロジェクトの構築に使用したモデリングモードによって異なります。)
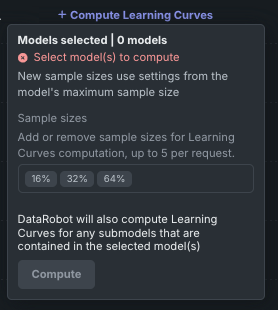
新しい点を計算するには:
-
ウィンドウの右側にあるリストから、計算するモデルを選択します。 選択したモデルがハイライト表示されます。 学習曲線を計算するをクリックします。
-
カスタムサイズを含むサンプルサイズを追加または削除します。
-
計算するをクリックします。
学習曲線の解釈
学習曲線のグラフを評価する際には、以下の点に注意してください。
-
モデルをよく吟味し、サンプルサイズの増加に伴い、急激な変化や、パフォーマンスの低下がないかどうか調べます。 データセットや検定セットが小さいときは、データセットの性質により、大幅な変動が生じることがあります。
-
モデルはトレーニングセットの特定の特性に左右されやすくなるので、サンプルサイズが大きくなるとモデルのパフォーマンスが低下することがあります。
-
一般的に、バイアスの大きいモデル(線形モデルなど)は、小さなサンプルサイズで、一方、より柔軟でバリアンスの大きいモデルはしばしば、大きなサンプルサイズで、それぞれパフォーマンスが向上することがあります。
-
変動を前処理することで、モデルの柔軟性が向上することがあります。
速度対精度
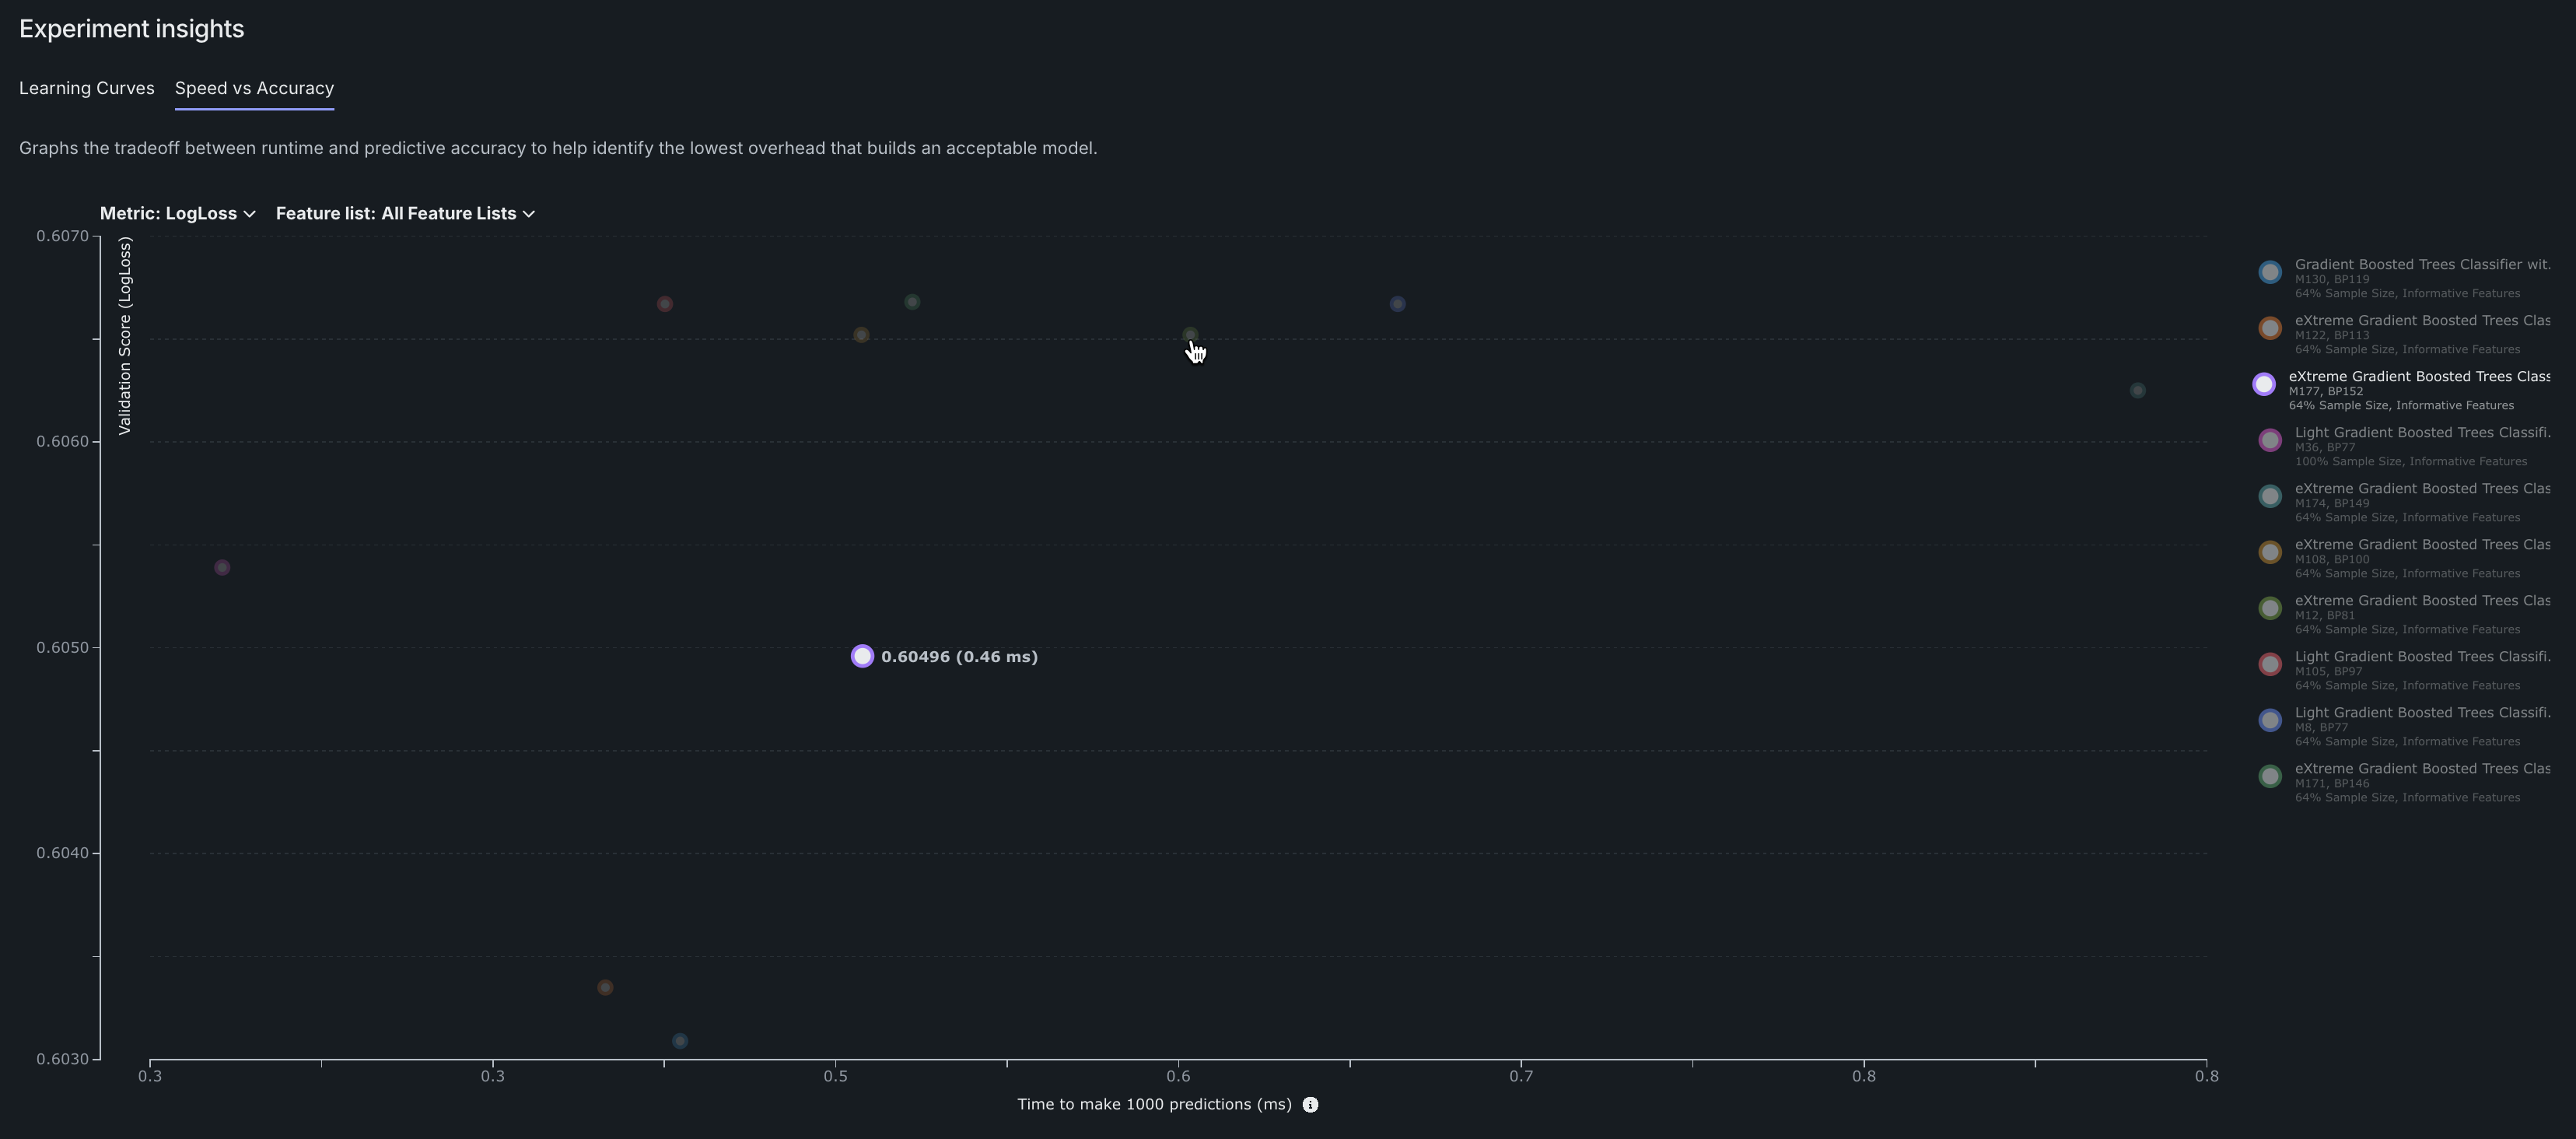
予測精度を高めると、しばしば予測実行時間が長くなります。 速度 対 精度の分析プロットは、実行時間と予測精度のトレードオフを示し、オーバーヘッドが最も少ない最適なモデルを選択するのに役立ちます。 表示は、現在選択されている指標を用いた検定スコアに基づいています。
-
Y軸は、リーダーボード上で現在選択されている指標を一覧表示します。 指標を変更するには、指標ドロップダウンを使用します。
-
X軸には、予測を1000回行う際の推定時間がミリ秒単位で表示されます。 合計予測時間にはさまざまな要因が含まれ、実装によって異なります。 グラフ上の任意ポイントまたは右側の凡例内のモデル名にマウスオーバーすると推定時間およびスコアが表示されます。
ヒント
たとえば、交差検定のスコアで並べ替えるなど、リーダーボードの表示を並べ替えると、速度 対 精度では、検定スコアに基づいて上位10モデルが引き続きプロットされます。
