Deployment usage
For text generation, VDB, and MCP custom model deployments, the Usage tab follows the standard prediction-processing views described in Usage. For agentic workflow (and NIM) deployments, the Quota monitoring experience below is the primary usage view.
Quota usage monitoring
On the Monitoring > Usage tab for agentic workflow and NIM deployments, the Quota monitoring dashboard visualizes historical usage segmented by user or agent. Other serverless generative deployments use the same Console controls when quota monitoring applies.
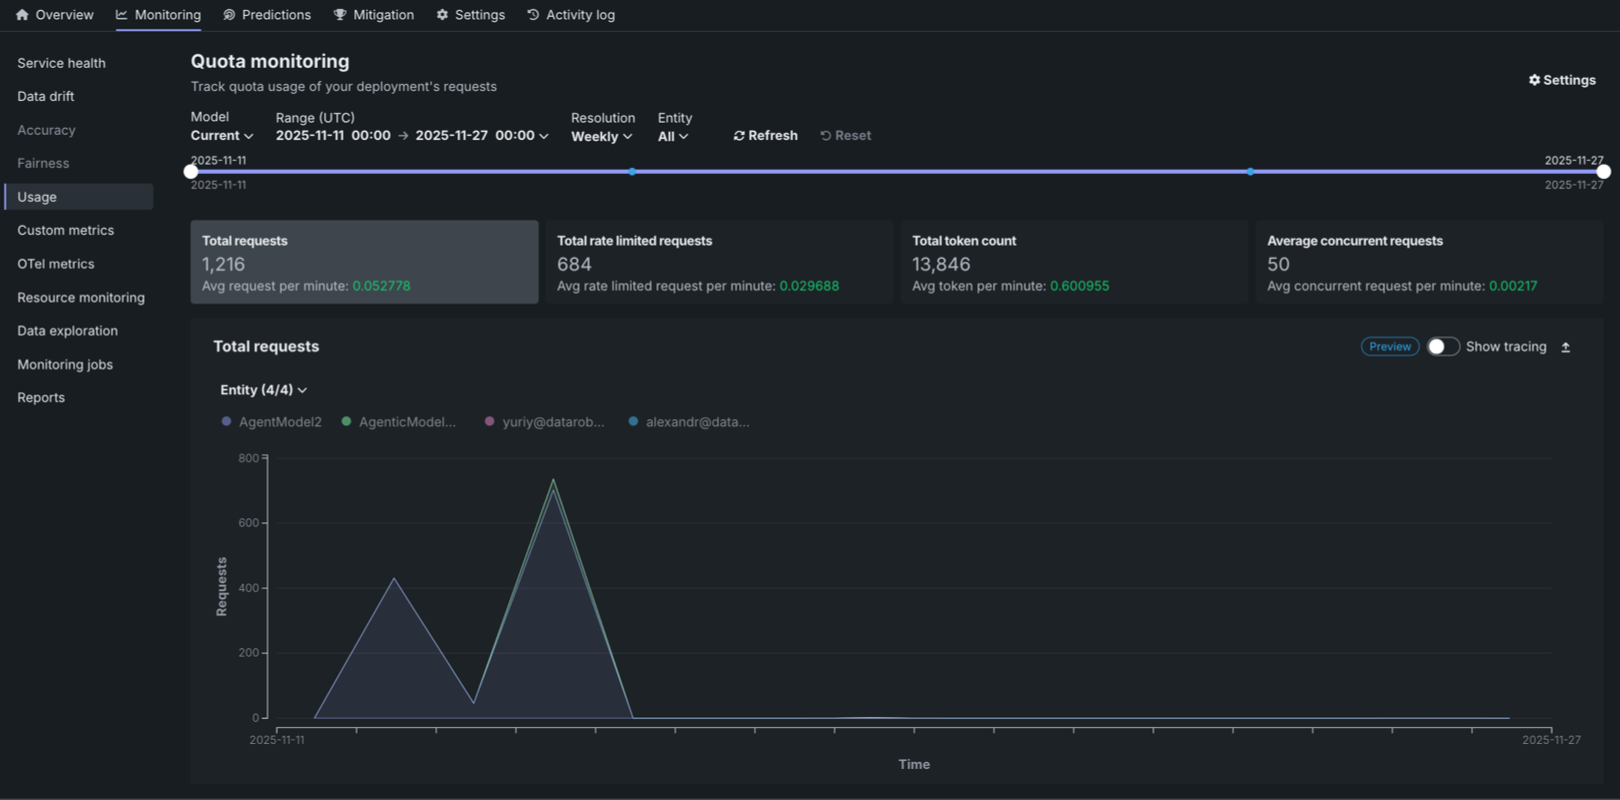
The Quota monitoring dashboard displays three key metric tiles at the top of the page:
| Metric | Description |
|---|---|
| Total requests | The total number of requests made during the selected time range, along with the average requests per minute. |
| Total rate limited requests | The total number of requests that were rate limited during the selected time range, along with the average rate limited requests per minute. |
| Total token count | The total number of tokens consumed during the selected time range, along with the average tokens per minute. |
| Average concurrent requests | The average number of simultaneous API calls processed by the agent service over the defined interval, tracked as a key metric for observability and used to enforce the system's quota limit on simultaneous operations. |
Each metric displays the value for the selected time frame and the average per minute in green. Click the metric tile to review the corresponding chart below:
- Total requests
- Total rate limited requests
- Total token count
- Average concurrent requests
You can configure the Quota monitoring dashboard to focus the visualized statistics on specific entities and time frames. The following controls are available:
| Filter | Description |
|---|---|
| Model | Select the model version to monitor. The Current option displays data for the active model version. |
| Range (UTC) | Select the date and time range for the data displayed. Use the date pickers to set the start and end times in UTC. |
| Resolution | Select the time resolution for aggregating data: Hourly, Daily, or Weekly. |
| Entity | Filter by entity type: All, User, or Agent. |
| Refresh | Updates the dashboard with the latest data based on the current filter settings. |
| Reset | Resets all filters to their default values. |
Quota monitoring charts
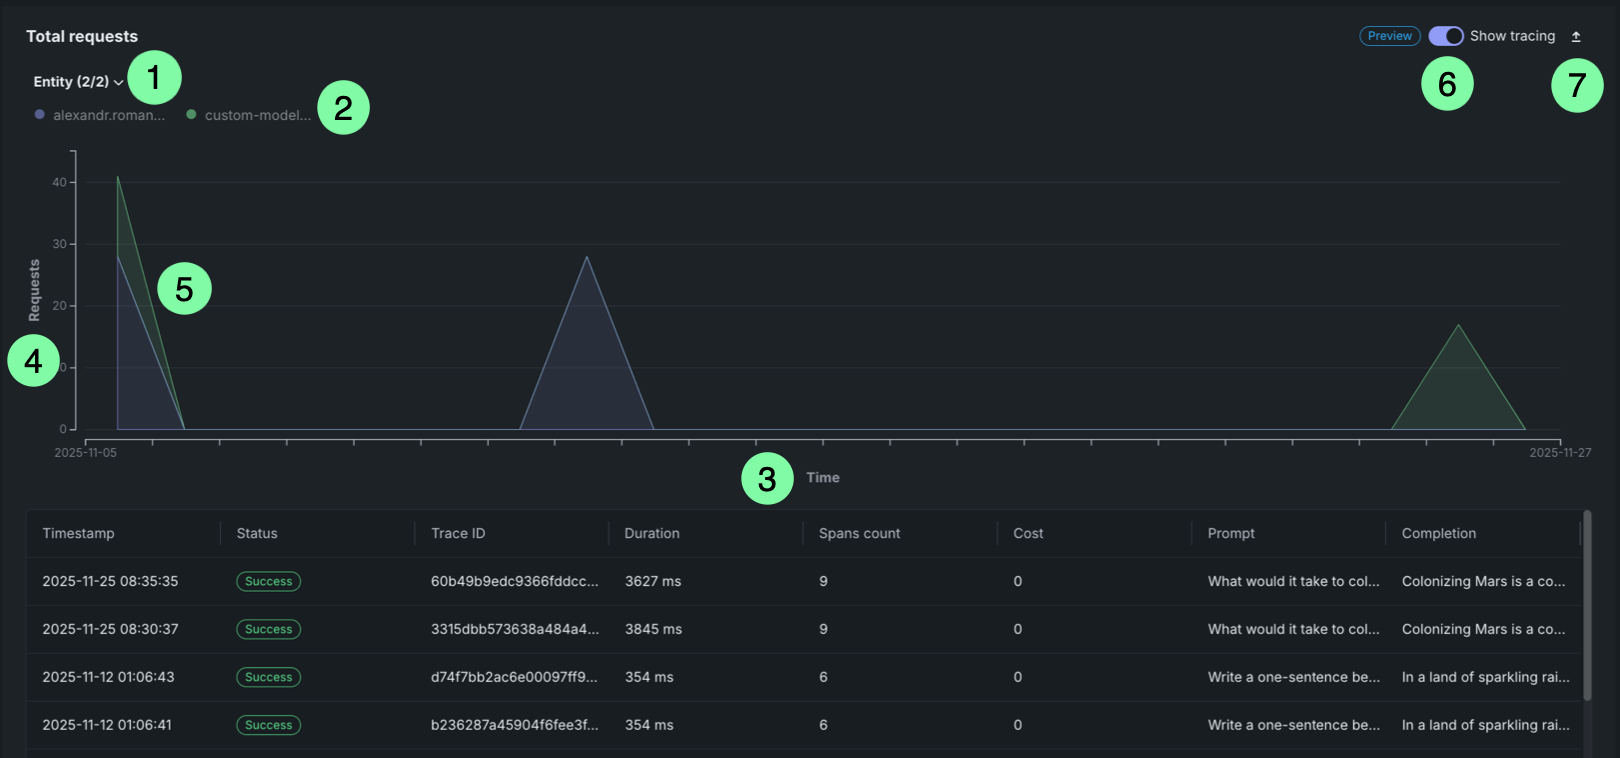
The Quota monitoring charts display an area chart showing the distribution of requests over time, rate limited requests over time, or token count over time. This chart is a stacked chart (or stacked graph), a chart stacking multiple data series on top of each other to visualize how each entity contributes to the total over time and across categories. Each chart is segmented by entity (user or agent). Each entity is represented by a different color in the chart legend.
| Chart element | Description | |
|---|---|---|
| 1 | Entity filter | Displays all entities (users or agents) included in the selected time range. Each entity is represented by a dot that matches the area in the chart. |
| 2 | Entity legend | Displays all entities (users or agents) included in the selected time range. Each entity is represented by a dot that matches the area in the chart. |
| 3 | Time range (X-axis) | Displays the time range selected in the filters, showing the date range from start to end. |
| 4 | Metric (Y-axis) | Displays the number of requests, rate limited requests, or tokens on the vertical axis. |
| 5 | Request areas | Overlapping areas show the volume of requests per entity over time. The height of each area at any point represents the number of requests for that entity at that time. This chart is a stacked chart (or stacked graph), a chart stacking multiple data series on top of each other to visualize how each entity contributes to the total over time and across categories. |
| 6 | Tracing | Click Show tracing to view tracing data for the requests. |
| 7 | Export | Click Export to download a .csv file. |
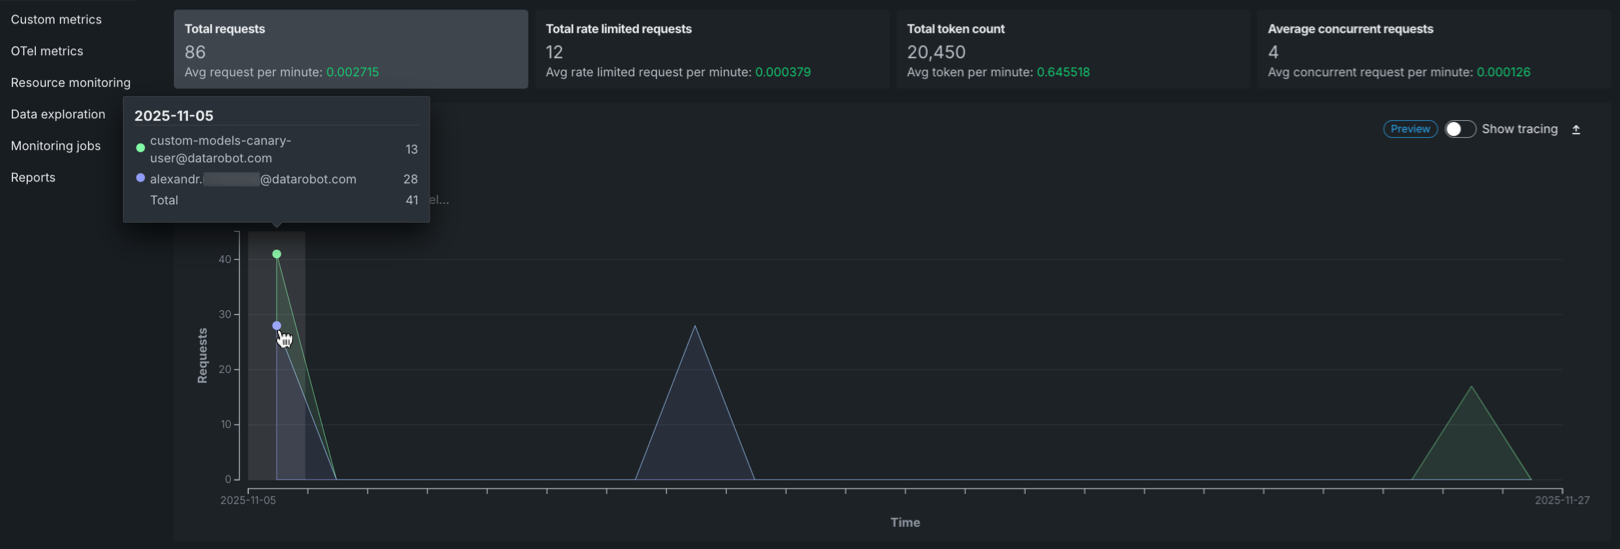
Hover over the chart to view detailed information about the number of requests for each entity at specific time points.
Request tracing table
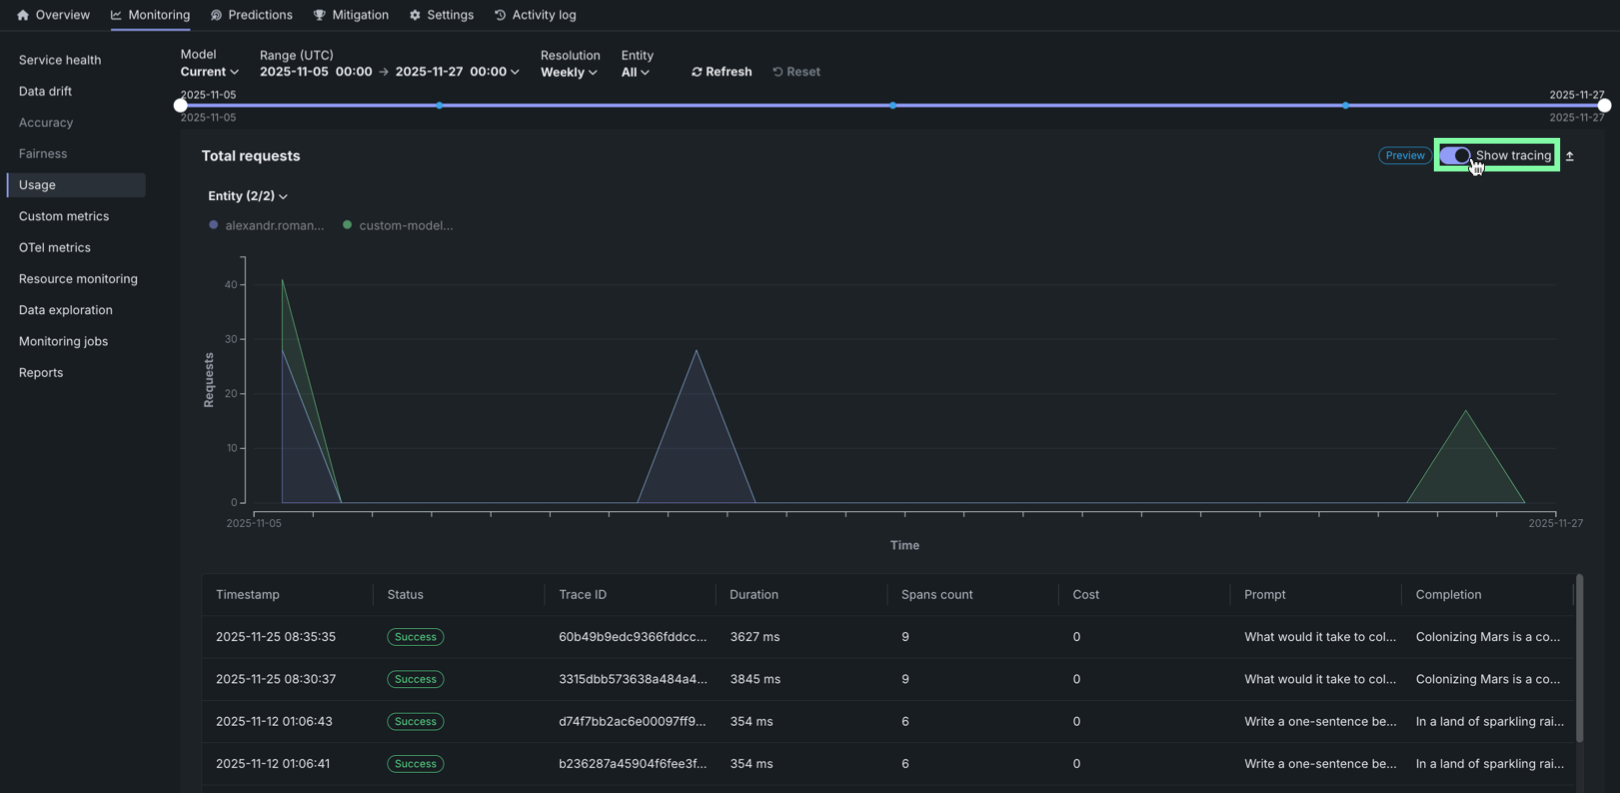
On any Quota monitoring chart, click Show tracing to view tracing data for the deployment. This tracing chart uses the same interface as the dedicated Tracing tab.
Rate limited requests table
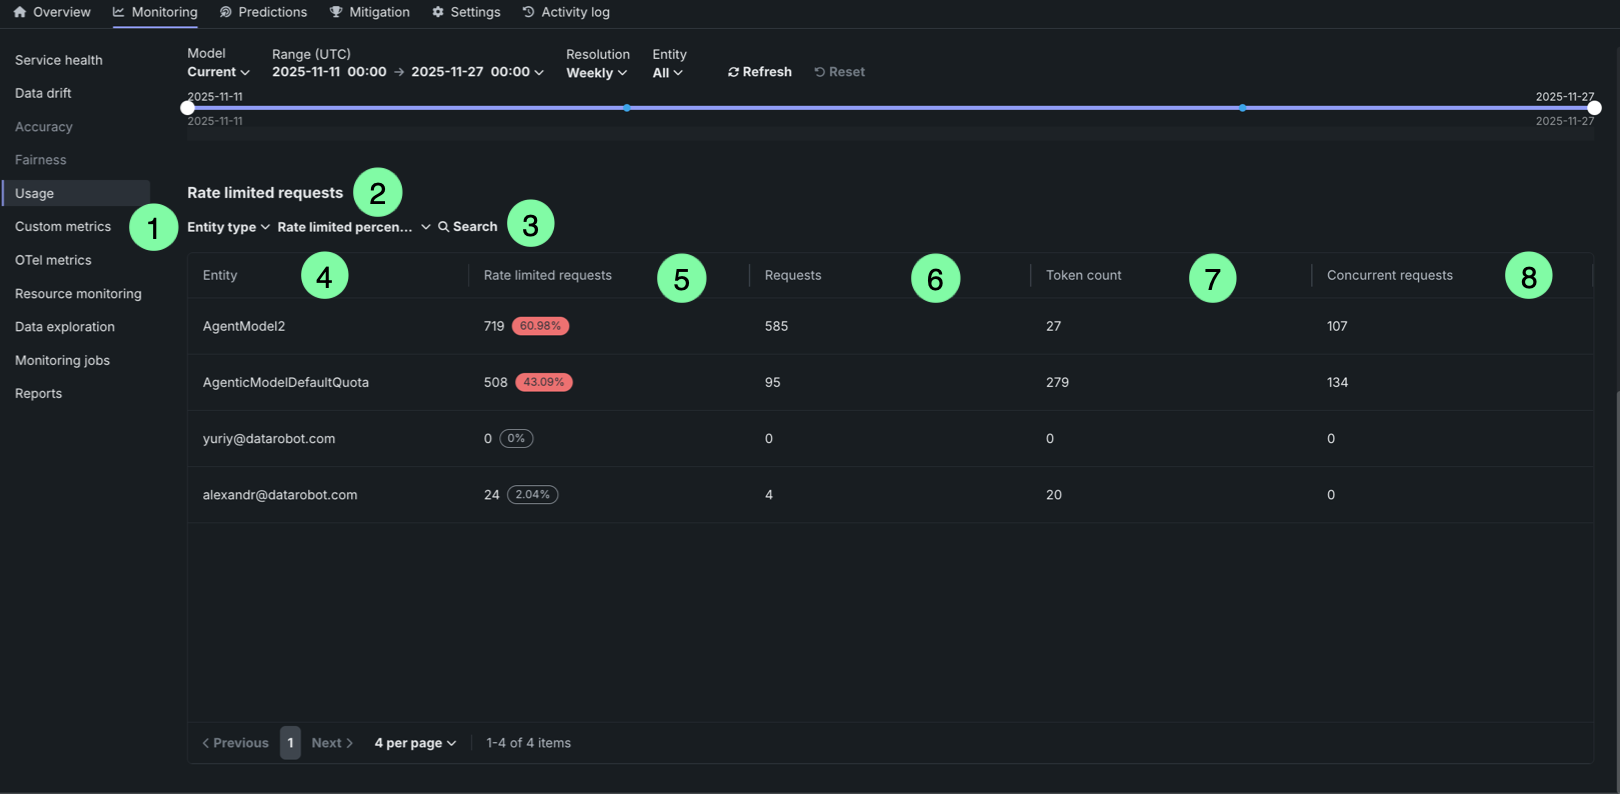
The Rate limited requests table provides a detailed breakdown of rate limiting by entity:
| Table element | Description | |
|---|---|---|
| 1 | Entity type filter | Filter the table by entity type (user or agent). |
| 2 | Rate limited percentage filter | Filter entities by their rate limited percentage threshold (zero, low, medium, or high). |
| 3 | Search box | Search for specific entities by name or identifier. |
| 4 | Entity column | Displays the entity identifier (user email or agent name). |
| 5 | Rate limited requests column | Shows the number of rate limited requests and the percentage of total requests that were rate limited. The percentage is highlighted in red when it exceeds a threshold, or displayed in gray when it is 0%. |
| 6 | Requests column | Displays the number of requests that were rate limited due to exceeding the request quota. |
| 7 | Token count column | Displays the number of requests that were rate limited due to exceeding the token quota. |
| 8 | Concurrent requests column | Displays the number of requests that were rate limited due to exceeding the concurrent requests quota. |
The table helps identify which entities are experiencing rate limiting and to what extent, allowing you to adjust quotas or usage patterns accordingly.