DataRobot experimentation plugin
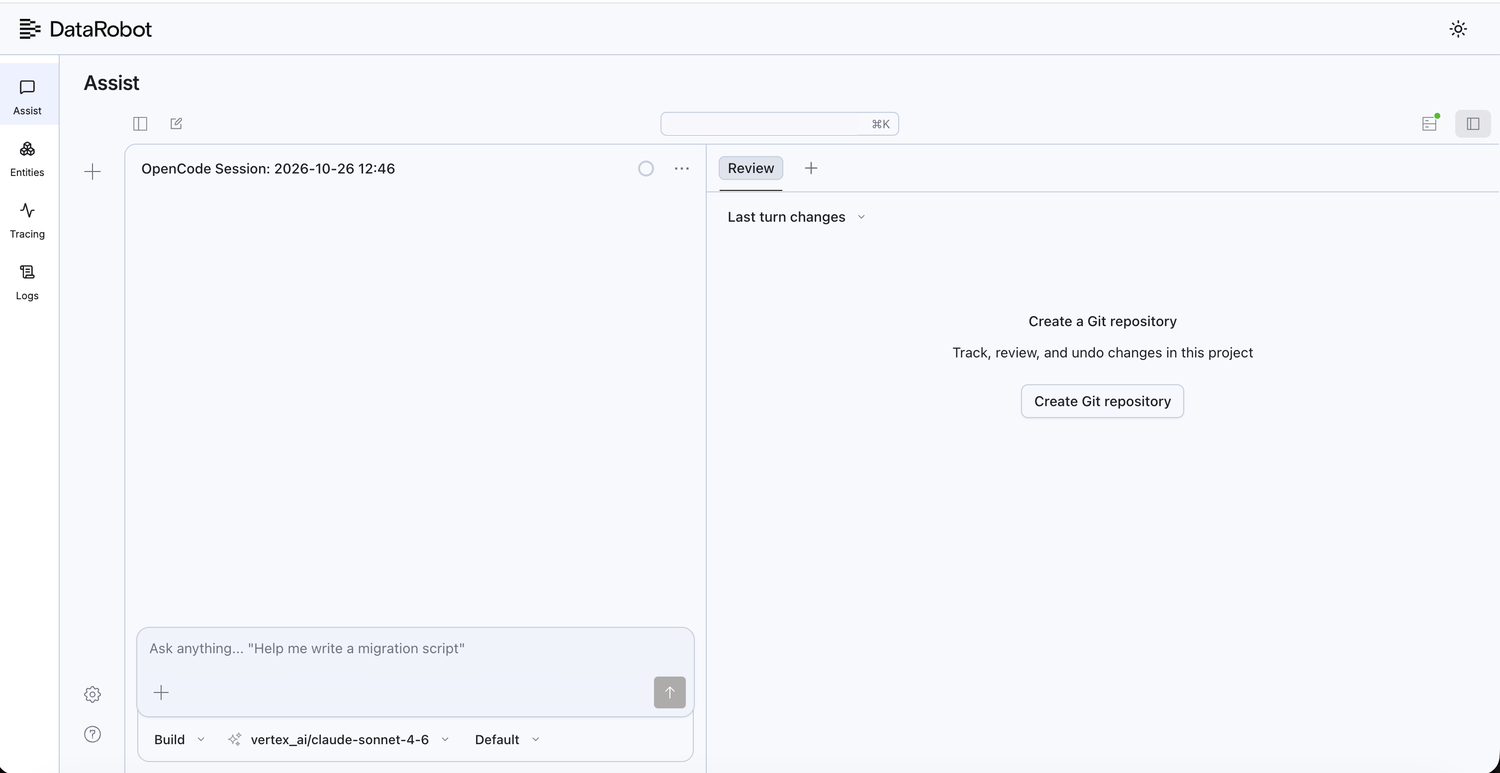
The DataRobot experimentation plugin (dr xp) exposes a local dashboard during agentic application development. The dashboard runs on port 8090 by default and organizes observability into tabs. The Assist, Entities, Tracing, and Logs tabs in the left sidebar are on by default. Additional tabs, such as Evaluation, are enabled with dr xp command-line flags, and some also require an optional component in the project; Choose your path lists them.
The landing page depends on the entity configuration. With no entity configured, the dashboard opens on the Assist tab; with an entity configured, it opens on the Tracing tab. When the Assist tab is disabled (see Assist tab), a start without an entity opens on the Entities tab instead. See Start without an entity.
The plugin uses the same OpenTelemetry standard that carries telemetry across the rest of the stack. Local traces follow the same tracing model as deployed agents on the DataRobot platform, so local inspection reflects what the agent actually did during development without deploying to the platform or switching to a separate UI tab.
Access the dashboard
Complete these steps to open the local experimentation dashboard:
- Install the CLI—
curl https://cli.datarobot.com/install | sh; verify withdr self version. See Install the CLI and authenticate. - Authenticate—
dr auth login. - Install the plugin—
dr plugin install xp; verify withdr plugin list. See Install the experimentation plugin. - Create or open a project—
dr startfrom an Agentic Starter template; confirmDATAROBOT_USE_CASE_IDinpulumi_config.json. See Set up the App Framework project. - Start the agent and dashboard—Run
dr run devfrom the project root. To launch the dashboard separately, start the agent withtask agent:devin one terminal, then rundr xpin another; the dashboard reads the use case ID frompulumi_config.jsonwhen present. See Start the experimentation dashboard. - Open the GUI—browse to
http://localhost:8090. See Open the GUI in a browser. - Confirm traces—send a test message to the agent, refresh the Tracing tab. See Confirm end-to-end behavior.
For batch evaluation workflows, also install the evaluation component and set DR_EXPERIMENT_ENABLE_EVALUATION=true in .env. See Batch agent evaluation.
Choose your path
| Tab | Use it to | Availability |
|---|---|---|
| Assist | Chat with an embedded coding assistant about the agent project. | On by default; landing page when no entity is configured. Requires the dr opencode plugin (installed automatically). |
| Entities | Pick the Use Case, deployment, custom application, or workload to work on. | On by default. |
| Tracing | Inspect agent traces during local development. | On by default; landing page when an entity is configured. Requires a running agent. |
| Logs | Review the agent's log records. | On by default. |
| Evaluation | Score agent responses on a fixed benchmark dataset. | Preview. Start dr xp with --enable-evaluation and install the evaluation component. |
| Analyze traces (controls on the Tracing page) | Find and fix agent mistakes from recorded LLM calls. | Preview. Start dr xp with --enable-trace-analysis and instrument the agent with Tensile. |
Preview capabilities are functional during development but still change between releases; their pages list the current limitations.
All paths share the same setup: install the CLI, install the xp plugin, set up an App Framework project, and open the GUI.
Assist tab
The Assist tab embeds an OpenCode coding assistant wired to the DataRobot LLM gateway. The assistant is scoped to the directory dr xp was launched from, so it answers questions about the agent project before an entity is selected.
The tab is on by default and requires the dr opencode plugin. When the plugin is missing, dr xp installs it at startup; set DR_EXPERIMENT_ASSIST_NO_INSTALL=1 to skip the automatic install. The assistant requires DATAROBOT_API_TOKEN and DATAROBOT_ENDPOINT to reach the LLM gateway; dr auth login sets both.
To disable the tab, pass --enable-assist=false or set DR_EXPERIMENT_ENABLE_ASSIST=0.
Note
If the embedded assistant fails to start, dr xp logs a warning and keeps serving. The Assist tab then shows an unreachable-server message; the other tabs are unaffected.
Start without an entity
--entity-id is optional. When no entity is configured, dr xp opens on the Assist tab, and the Entities tab lists the Use Cases, deployments, custom applications, and workloads you can select. Entity-scoped tabs, such as Tracing, stay disabled until you select an entity.
The entity ID resolves in the following order: the --entity-id flag, the DR_EXPERIMENT_ENTITY_ID environment variable, the .dr-xp.yaml config file, DATAROBOT_USE_CASE_ID in pulumi_config.json, then DATAROBOT_DEFAULT_USE_CASE. When an entity is configured through any of these sources, the dashboard opens on the Tracing tab instead.
The Entities tab is on by default. To disable it, pass --enable-entities=false or set DR_EXPERIMENT_ENABLE_ENTITIES=0; --entity-id is then required.
Local development stack
Agentic Starter templates run several services during local development. The commands and ports referenced throughout this page assume this stack:
| Port | Service |
|---|---|
8090 |
Experimentation dashboard (dr xp GUI). |
8842 |
Local agent OpenAI-compatible endpoint. |
5173 |
Frontend dev server. |
8080 |
FastAPI backend. |
9000 |
MCP server (configurable via MCP_SERVER_PORT). |
Ports 8090, 8080, and 5173 are fixed in Agentic Starter templates. The agent port (8842) is set during the dr start wizard.
Quick start
<USE_CASE_ID> below is your App Framework project's use case ID—see Prerequisites. It is optional; a bare dr xp opens on the Assist tab, and the Entities tab lists the entities to choose from.
# Install the plugin
dr plugin install xp

# Show available options
dr xp --help

# Start without an entity; pick one later from the Entities tab
dr xp

# Start with a use case (opens on the Tracing tab)
dr xp --entity-id <USE_CASE_ID>

# Enable batch evaluation workflows in the GUI
dr xp --enable-evaluation --entity-id <USE_CASE_ID>

# Enable trace analysis (trace analysis controls on the **Tracing** page)
dr xp --enable-trace-analysis --entity-id <USE_CASE_ID>

# Start with a deployment on a custom port
dr xp --entity-type deployment --entity-id <DEPLOYMENT_ID> --port 8091
Important
Batch evaluation workflows in the GUI are off by default. Pass --enable-evaluation (or set DR_EXPERIMENT_ENABLE_EVALUATION=true) when starting dr xp to expose the Evaluation tab and evaluation API routes. Traces work without this flag. See Enable batch evaluation workflows.
When dr run dev runs from an Agentic Starter project, the local tracing dashboard starts automatically on port 8090. The bundled dashboard starts with traces only unless DR_EXPERIMENT_ENABLE_EVALUATION=true is set in .env.
Access the GUI
The experimentation plugin serves a web UI from a local HTTP server. The CLI installs and launches the plugin; the browser connects to the server URL after startup completes. With no entity configured, the GUI opens on the Assist tab; with an entity configured, it opens on the Tracing tab.
Prerequisites
Before starting the dashboard, confirm the following:
| Requirement | Notes |
|---|---|
| DataRobot CLI | Install with the getting started guide; verify with dr self version. |
| CLI authentication | Run dr auth login or configure credentials in ~/.config/datarobot/drconfig.yaml. |
| Experimentation plugin | Install with dr plugin install xp; verify with dr plugin list. |
| App Framework project | Provides the agent and the default entity context; create with dr start or clone an Agentic Starter template. |
| Use Case ID (optional) | Stored in pulumi_config.json as DATAROBOT_USE_CASE_ID, or pass --entity-id explicitly. Without one, the dashboard opens on the Assist tab; pick an entity from the Entities tab. |
After confirming the prerequisites, complete the following sections in order (or jump straight to a step using the links in Access the dashboard above).
Install the CLI and authenticate
- Install the DataRobot CLI:
curl https://cli.datarobot.com/install | sh
- Verify the installation:
dr self version
- Authenticate with DataRobot:
dr auth login
The plugin requires authentication. The CLI passes DATAROBOT_ENDPOINT and DATAROBOT_API_TOKEN to the plugin process at launch.
Install the experimentation plugin
Install the xp plugin once per machine:
dr plugin install xp
Verify discovery:
dr plugin list
Confirm the list includes xp with a path under ~/.config/datarobot/plugins/xp/ (Linux and macOS) or the equivalent Windows config directory.
Set up the App Framework project
-
Create or open an Agentic Starter project:
dr start -
Confirm
pulumi_config.jsonat the project root contains a use case ID:"DATAROBOT_USE_CASE_ID": "<USE_CASE_ID>" -
(Optional) To run batch evaluation workflows in the GUI, add the evaluation component:
dr component add https://github.com/datarobot-community/af-component-evaluation . -
From the evaluation component directory (for example
evaluations/), install dependencies:task install
See Batch agent evaluation for prerequisites and setup details.
Configure the dashboard
Set options with flags, environment variables, or a project-level .dr-xp.yaml file. Flag values take precedence over environment variables, then config files, then pulumi_config.json.
The following table summarizes the most common settings:
| Setting | Flag | Environment variable | Default |
|---|---|---|---|
| Port | --port |
DR_EXPERIMENT_PORT |
8090 |
| Entity type | --entity-type |
DR_EXPERIMENT_ENTITY_TYPE |
experiment_container (use case) |
| Entity ID | --entity-id |
DR_EXPERIMENT_ENTITY_ID |
DATAROBOT_USE_CASE_ID from pulumi_config.json, then DATAROBOT_DEFAULT_USE_CASE. Optional; without one, pick an entity from the Entities tab. |
| Assist tab | --enable-assist |
DR_EXPERIMENT_ENABLE_ASSIST |
On; pass --enable-assist=false to disable. |
| Entities tab | --enable-entities |
DR_EXPERIMENT_ENABLE_ENTITIES |
On; pass --enable-entities=false to disable. With the tab disabled, --entity-id is required. |
| Evaluation workflows | --enable-evaluation |
DR_EXPERIMENT_ENABLE_EVALUATION=true |
Off; pass the flag to enable batch evaluation workflows. |
| Trace analysis | --enable-trace-analysis |
DR_EXPERIMENT_ENABLE_TRACE_ANALYSIS=true |
Off; pass the flag to add trace analysis controls to the Tracing page. |
| Plain terminal output | --plain-output |
— | Off (TUI panel shown by default). |
Example project-level config file:
# .dr-xp.yaml (project root)
entity_type: experiment_container
port: 8090
# enable_evaluation: true   # or set DR_EXPERIMENT_ENABLE_EVALUATION=true in .env
For Agentic Starter projects, add evaluation support to .env:
# .env (project root) — enables Evaluation tab with dr run dev / task infra:dev
DR_EXPERIMENT_ENABLE_EVALUATION=true
# Optional: Trace analysis controls on the Tracing page (preview)
DR_EXPERIMENT_ENABLE_TRACE_ANALYSIS=true
For judge-based evaluations, also set credentials in .env:
DATAROBOT_API_TOKEN=<API_TOKEN>
DATAROBOT_ENDPOINT=https://app.datarobot.com/api/v2
Judge-free benchmarks run without judge credentials. See Batch agent evaluation.
Start the local agent
The dashboard visualizes traces from agent activity. Batch evaluations require a running agent endpoint.
Start the full development stack from the project root:
dr run dev
This typically starts the agent on http://localhost:8842/v1 and may also launch the dashboard on port 8090. See Quick start for the flag/env var that enables the Evaluation tab.
To start services individually:
task agent:dev      # Agent on port 8842.
task infra:dev      # Dashboard on port 8090.
When task dev runs, dr xp may start from both agent:dev and infra:dev. The message Already running at http://127.0.0.1:8090 is expected.
Start the experimentation dashboard
Choose one of the following options.
Standalone start
From the App Framework project root:
dr xp
The dashboard reads the Use Case ID from pulumi_config.json, when present. To point to a different entity, pass --entity-id <USE_CASE_ID>, or pick one from the Entities tab after startup. Add --enable-evaluation when the Evaluation tab is needed. See Enable batch evaluation workflows.
Infra task (Agentic Starter projects)
task infra:dev
This runs dr xp --plain-output without --enable-evaluation. To enable batch evaluation workflows, set DR_EXPERIMENT_ENABLE_EVALUATION=true in the project .env.
Bundled with full dev
dr run dev
Expected startup output:
Starting server...
Local Experimentation running on http://127.0.0.1:8090 for experiment_container:<USE_CASE_ID>
If a server is already listening on the port, the CLI prints:
Already running at http://127.0.0.1:8090 — no new server started.
The server runs in the foreground. Stop it with Ctrl+C.
Verify the server (optional)
Confirm the dashboard responds:
curl -s http://127.0.0.1:8090/api/info
Example response with evaluation enabled:
{"entity_type":"experiment_container","entity_id":"<USE_CASE_ID>","features":["traces","evaluation"]}
When evaluation is disabled, features contains "traces" only and evaluation API routes return 404.
Open the GUI in a browser
Open one of the following URLs:
| Environment | URL |
|---|---|
| Local machine | http://localhost:8090 or http://127.0.0.1:8090. |
| DataRobot codespace or notebook | Exposed-port URL for port 8090 (shown when dr run dev or task dev completes). |
The page title is Experimentation UI. Available tabs depend on enabled features:
| Tab | Doc | Requires |
|---|---|---|
| Assist | Assist tab | On by default. |
| Entities | Start without an entity | On by default. |
| Tracing | Local tracing | Plugin installed and agent running. |
| Evaluation | Batch agent evaluation | --enable-evaluation (or DR_EXPERIMENT_ENABLE_EVALUATION=true) and the evaluation component installed. |
| Tracing > Analyze traces | Trace analysis | --enable-trace-analysis (or DR_EXPERIMENT_ENABLE_TRACE_ANALYSIS=true) and an agent instrumented with Tensile. |
Confirm end-to-end behavior
- Send a test message to the agent (for example at
http://localhost:5173). - Refresh the dashboard. A new trace appears in the Tracing tab. See Local tracing.
- (Optional) When evaluation is enabled, open the Evaluation tab, select a pipeline, dataset, and agent endpoint (
http://localhost:8842/v1), then start a run. See Batch agent evaluation.
GUI access troubleshooting
| Symptom | Fix |
|---|---|
dr: command not found |
Reinstall the CLI or add the binary directory to PATH; see Getting started. |
| Plugin not found | Run dr plugin install xp. |
| No entity selected | Pick a Use Case, deployment, custom application, or workload from the Entities tab, or pass --entity-id <USE_CASE_ID>. An entity ID is required only when the Entities tab is disabled with --enable-entities=false. |
Port 8090 already in use |
List the process with lsof -i :8090 (macOS/Linux), note the PID, and run kill <PID>. On Windows, run netstat -ano | findstr :8090, then taskkill /PID <pid> /F. Alternatively, start on another port with --port 8091. |
| No Evaluation tab | See Evaluation troubleshooting. |
| No traces in the dashboard | See Tracing troubleshooting. |
Evaluation APIs return 404 |
The running instance was started without --enable-evaluation; restart with the flag enabled. |
| No trace analysis controls on the Tracing page | See Trace analysis troubleshooting. |
Configuration reference
Use these options when non-default entity types, ports, or environment-based configuration is required.
Command options
dr xp --entity-type [TYPE] --entity-id [ID] --port [PORT] [--enable-evaluation] [--enable-trace-analysis] [--plain-output]
The server runs in the foreground and logs to the terminal. Stop it with Ctrl+C. For a step-by-step walkthrough, see Access the GUI.
--entity-idis optional. Without one, the value falls back toDATAROBOT_USE_CASE_IDinpulumi_config.json, then toDATAROBOT_DEFAULT_USE_CASE. When no source sets an entity, the dashboard opens on the Assist tab; pick an entity from the Entities tab. See Start without an entity.--entity-typedefaults toexperiment_container(use case). Also accepts the aliasuse_case.--enable-assistcontrols the Assist tab (on by default). Disable with--enable-assist=false. See Assist tab.--enable-entitiescontrols the Entities tab (on by default). Disable with--enable-entities=false;--entity-idis then required.--enable-evaluationenables batch evaluation workflows in the GUI when the evaluation component is present in the project. Without this flag, the Evaluation tab is unavailable.--enable-trace-analysisadds trace analysis controls to the Tracing page for traces recorded by a Tensile-instrumented agent (preview). Rundr xpfrom the agent project directory. See Trace analysis.--plain-outputstreams logs directly without the persistent TUI panel (used bytask infra:dev).- Value precedence: flag > environment variable > config file (
.dr-xp.yaml) >pulumi_config.json>DATAROBOT_DEFAULT_USE_CASE> default.
Run dr xp --help for the full flag list.
Environment variables
Add these variables to the .env file as needed.
DR_EXPERIMENT_ENTITY_TYPE(default:experiment_container)DR_EXPERIMENT_ENTITY_IDDATAROBOT_DEFAULT_USE_CASE(used as the entity ID when no other source sets one)DR_EXPERIMENT_PORT(default:8090)DR_EXPERIMENT_ENABLE_ASSIST(default:true; set to0to disable the Assist tab)DR_EXPERIMENT_ENABLE_ENTITIES(default:true; set to0to disable the Entities tab)DR_EXPERIMENT_ASSIST_PORT(default:4099)DR_EXPERIMENT_ASSIST_NO_INSTALL(set totrueto skip the automaticdr opencodeplugin install)DR_EXPERIMENT_ENABLE_EVALUATION(set totruefor evaluation workflows)DR_EXPERIMENT_ENABLE_TRACE_ANALYSIS(set totruefor trace analysis)DR_EXPERIMENT_TENSILE_NO_INSTALL(set totrueto keepdr xpfrom installingtensilethe first time you analyze a trace)
Supported entity types
| Entity type | Description |
|---|---|
experiment_container (alias: use_case) |
Use case experiment container (default). |
deployment |
Model deployment. |
custom_application |
Custom application. |
workload |
Workload. |
See also
- Local tracing—inspect OpenTelemetry spans during development.
- Batch agent evaluation—score agent responses on a fixed dataset.
- Trace analysis—analyze recorded trajectories with Tensile and OpenCode (preview).
- Implement tracing—add custom spans and attributes.
- DataRobot CLI getting started—install and configure the CLI.
- af-component-evaluation repository—evaluation component source and reference docs.