Forecasting Accuracy
| Tab | Description |
|---|---|
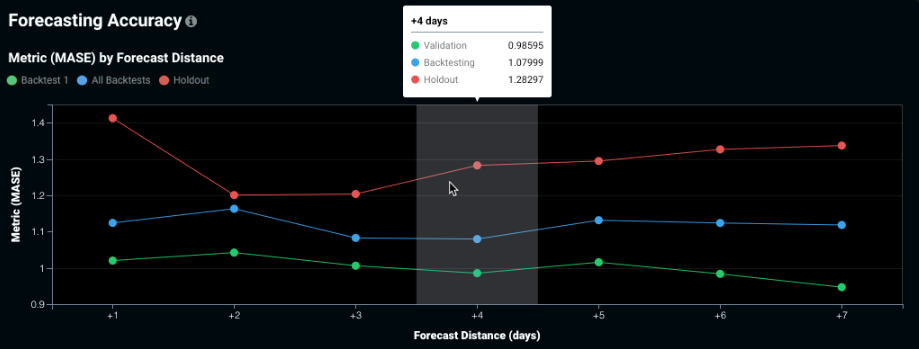
| Performance | Provides a visual indicator of how well a model predicts at each forecast distance in the experiment's forecast window. |
Use Forecasting Accuracy to help determine, for example, how much harder it is to accurately forecast four days out as opposed to two days out. The chart depicts how accuracy changes as you move further into the future. The insight is available for all time series experiments (both single series and multiseries).