アプリケーションの監視
アプリケーションを継続的に監視することで、問題の事前検知、パフォーマンスのボトルネックのトラブルシューティング、サービス中断への迅速な対応が可能になります。これにより、ダウンタイムを最小限に抑え、ユーザーエクスペリエンス全体を向上させることができます。 監視情報にアクセスするには、アプリケーションページに移動し、表示したいアプリをクリックします。
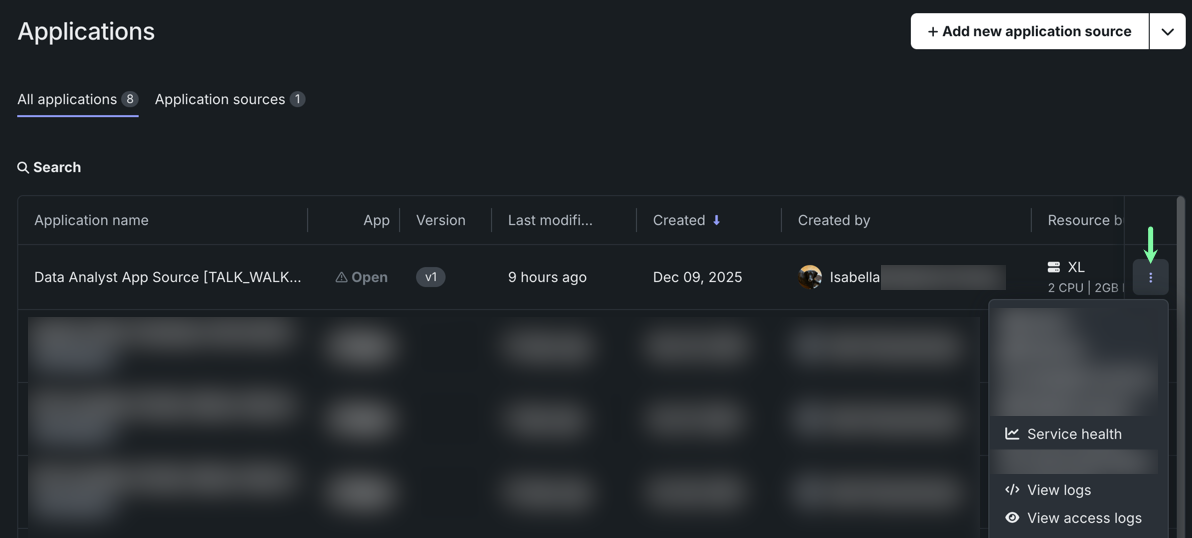
ここから、以下の監視オプションにアクセスできます。
- サービスの正常性:メモリー、CPU、およびネットワークの使用状況を表示するダッシュボードを提供します。
- アクティビティログ:アクセス、ランタイム、ビルド、およびバージョン履歴のログを表示します。
- トレース:モデルまたはエージェントワークフローからのトレースが表示されます。
リソースの使用状況
サービスの正常性を確認する権限
アプリケーションのオーナー権限を持つユーザーとDataRobot管理者のみがサービスの正常性にアクセスできます。
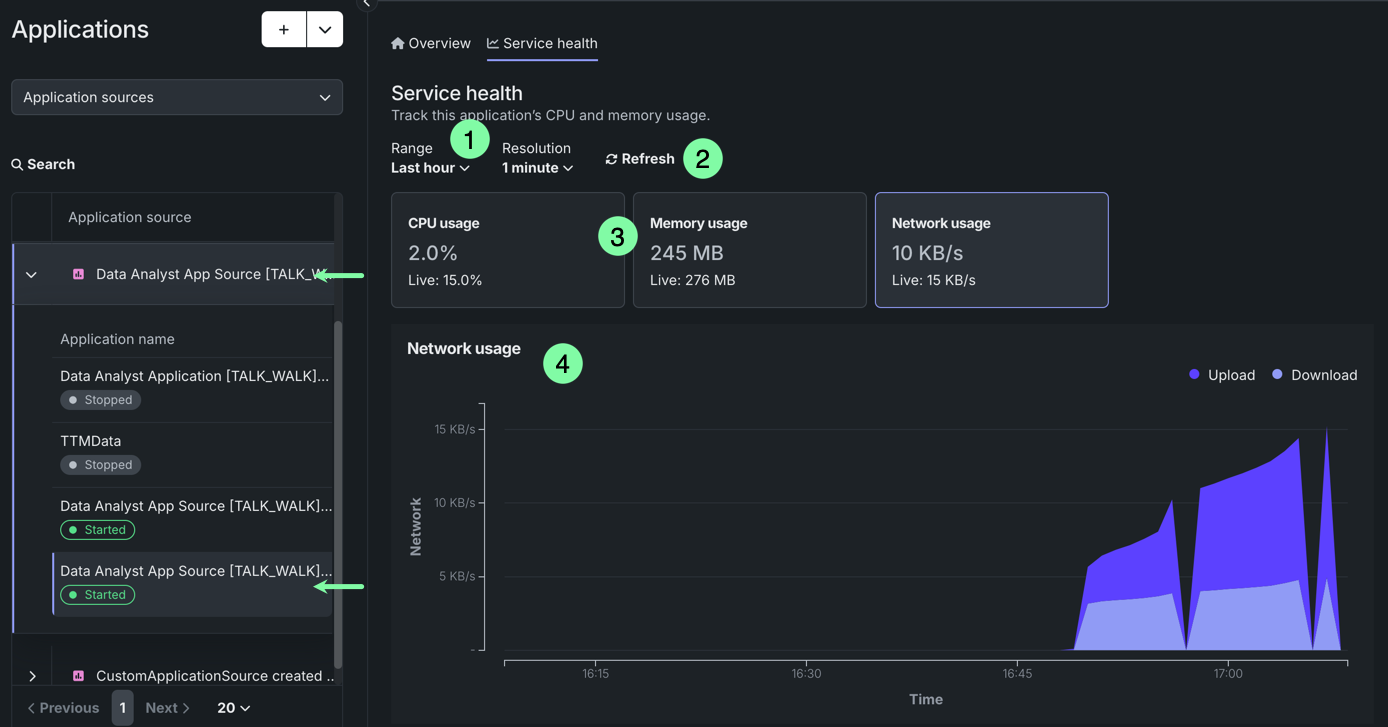
サービスの正常性タブでは、個々のアプリケーションの使用状況、サービスの正常性、およびリソースの消費量を監視できます。 リソース消費の監視は、コスト管理に不可欠であり、リソースが効率的に使用されるため、コストの最適化に役立ちます。
アプリケーションの監視機能にアクセスするには、アプリケーションページで、表示したいアプリをクリックし、サービスの正常性を選択します。 ここから、次のことができます。
| 要素 | 説明 | |
|---|---|---|
| 1 | 時間の範囲/単位 | チャートに表示する時間の範囲と単位を調整します。 単位ドロップダウンのオプションは、選択した範囲に基づいています。 |
| 2 | 表示を更新 | 使用状況に関する情報を即座に更新します。この情報は1分ごとに自動的に更新されます。 |
| 3 | リソースの使用状況 | 指定された時間範囲におけるCPU使用率、メモリー使用量、ネットワーク使用量の各平均値と、リアルタイムの使用状況を表示します。 タイルをクリックすると、下のグラフで使用状況に関する情報を視覚的に確認できます。 |
| 4 | 使用状況チャート | 選択された使用状況タイルおよび指定された時間範囲について、時間経過に伴う使用情報を視覚的に表示します。 CPU使用率については、平均使用率を表す線を表示することもできます。 |
アクティビティログ
ログの閲覧権限
アプリケーションのアクティビティログにアクセスするには、アプリケーションのオーナーまたはエディター権限が必要です。 アプリケーションソースを共有しても、アクティビティログへのアクセス権は付与されません。 オーナーはすべてのログを閲覧できますが、エディターはビルドおよびランタイムログのみを閲覧でき、アクセスログは閲覧できません。
DataRobotでは、カスタムアプリケーションに対して以下のアクティビティログを記録します。
| アクティビティログ | 説明 |
|---|---|
| アクセスログ | どのユーザーがいつアプリケーションにアクセスしたかを表示します。 |
| ランタイムログ | 実行中のアプリケーションのタスクのリアルタイムの記録を表示します。 |
| ビルドログ | アプリケーションのデプロイプロセスの履歴を表示します。 |
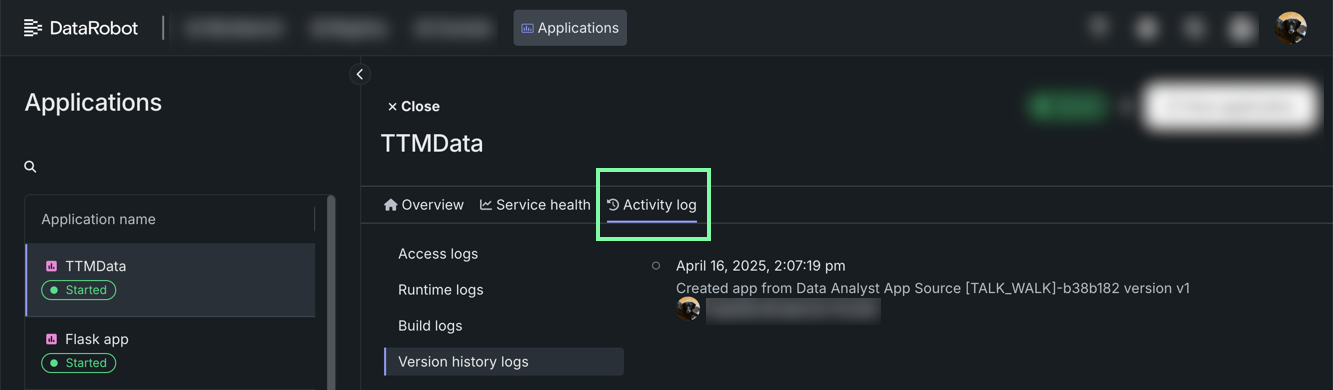
| バージョン履歴ログ | タイムスタンプが付与された、アプリケーションのバージョンの時系列の記録を表示します。 |
これらのアクティビティログにアクセスするには、アプリケーションページから、表示したいアプリをクリックし、アクティビティログを選択します。
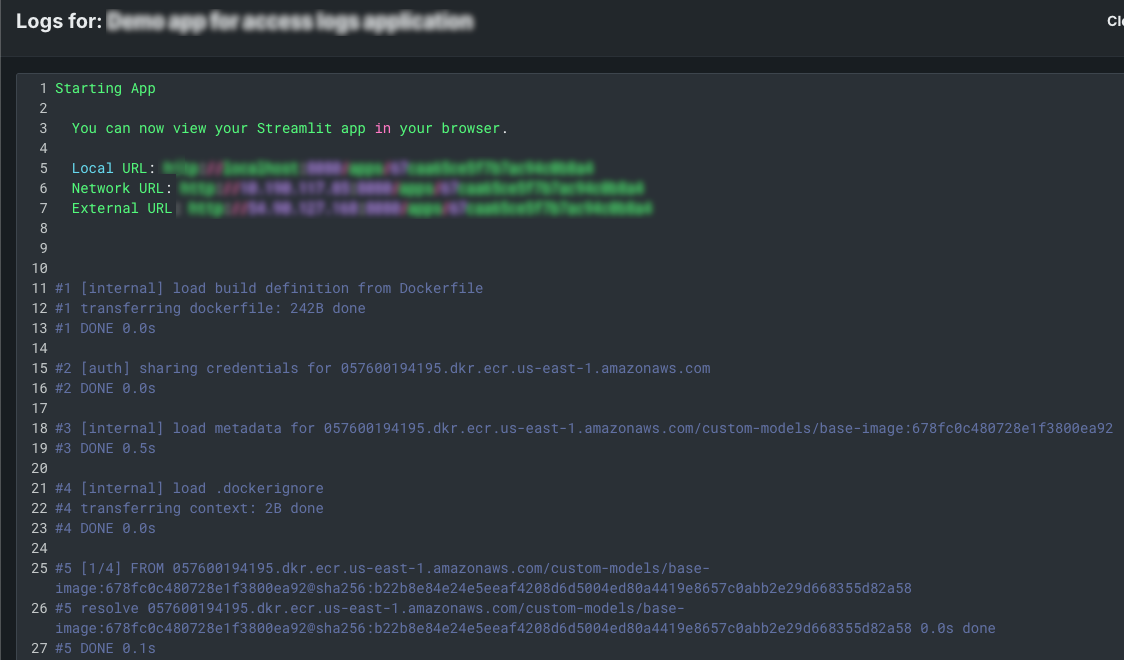
ビルドログとランタイムログ
ビルドログおよびランタイムログタブでは、カスタムアプリケーションのコンパイル、構築、および実行の履歴を詳細に示すログを閲覧できます。 これには、依存関係のチェック、パッケージ化、および発生した警告やエラーが含まれます。
アクセスログ
アクセスログタブから、カスタムアプリケーションを開いたり操作したりしたユーザーの履歴を監視できます。
また、アプリケーションソースから直接アクセスログを表示することもできます。 レジストリ > アプリケーションのソースに移動して、カスタムアプリケーションのアプリケーションソースを見つけ、ドロップダウンを展開して、ソースから構築されたアプリケーションを表示します。 次に、アクセスログを表示したいカスタムアプリケーションをクリックし、詳細表示にアクセスします。
概要タブで、アクセスログセクションまでスクロールダウンします。
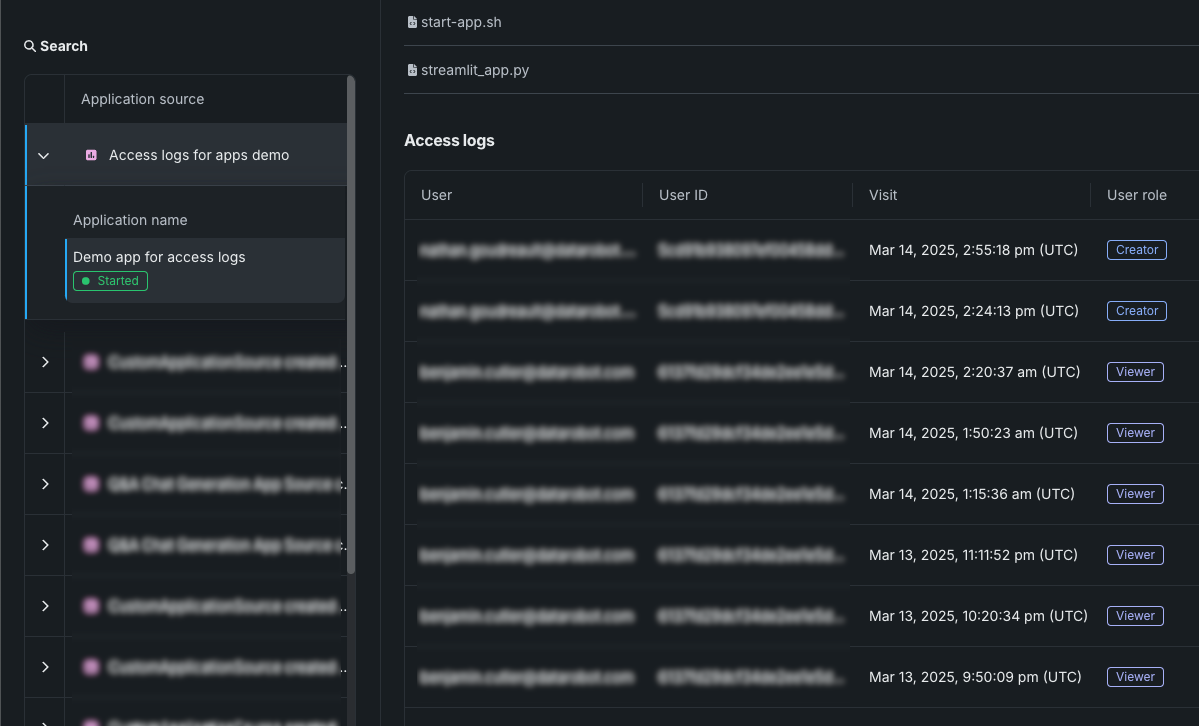
アクセスログには、メールアドレス、ユーザーID、アクセス日時、アプリケーションに対するユーザーのロールなど、ユーザーによるアプリケーションへのアクセスの詳細が記録されます。
利用状況のロギング間隔
最初のアクセスイベントに加えて、アプリケーションへのアクセスまたは使用が、24時間ごとに個別のアクセスとして記録されます。 たとえば、ユーザーがアプリケーションを開くとアクセスイベントがログに記録され、そのユーザーセッションが24時間を超えて継続的にアクセスまたは使用されると、別のアクセスイベントがログに記録されます。 これにより、カスタムアプリケーションを24時間1分アクセスすると、2つのアクセスイベントが記録されます。 セルフマネージドAIプラットフォーム環境では、この間隔はアプリケーション設定のCUSTOM_APP_USAGE_METRIC_PUBLISH_MAX_FREQによって変更可能です。
トレース
トレースを表示するために必要な権限
トレースタブへのアクセスには、アプリケーションのオーナーまたはエディター権限が必要です。 アプリケーションソースを共有しても、アプリケーショントレースへのアクセス権は付与されません。
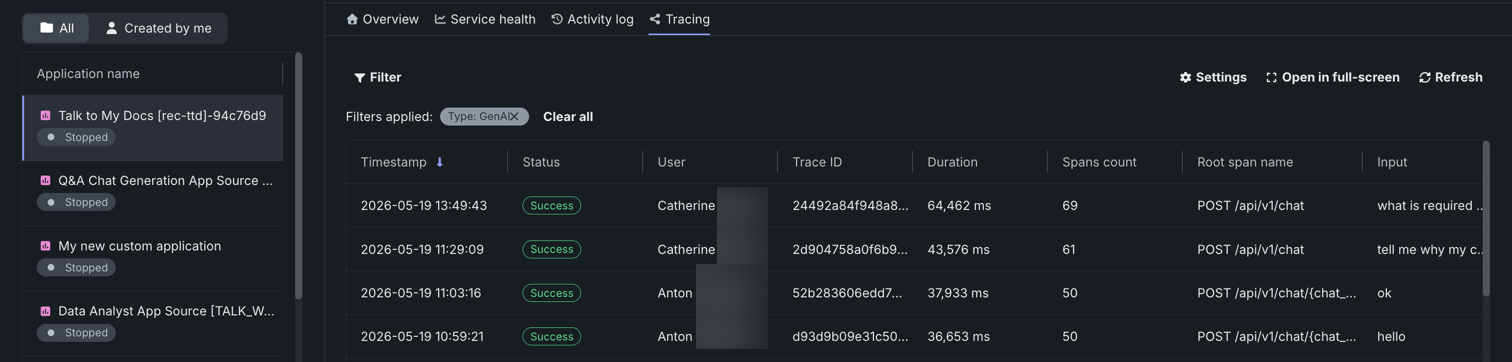
アプリケーションのトレースタブには、モデルまたはエージェントワークフローからのトレースが表示されます。 各トレースには、モデルまたはエージェントによって実行されたすべてのアクションを表し、これらのアクションの順序と期間を示す視覚的なタイムラインが含まれています。
ローカルでエージェントを開発している間、カスタムのOpenTelemetryスパンと属性(たとえば、ランタイム設定値)を追加できます。これにより、デプロイ後にトレースに表示されるようになります。 セットアップ手順とコード例については、エージェントにカスタムトレースを追加するを参照してください。
トレースは、モデルまたはエージェントのワークフローに対するリクエストがたどった経路を表します。 DataRobotでは、トレースにOpenTelemetryフレームワークを使用しています。 トレースは、起点から解決まで、リクエストのエンドツーエンドの経路全体を追跡します。 各トレースには、ルートスパンから始まる1つ以上のスパンが含まれます。 ルートスパンはリクエストの経路全体を表し、プロセスの各ステップの子スパンが含まれます。 ルート(または親)スパンと各子スパンは、同じトレースIDを共有します。
アクセスと保持
トレーステーブルは、すべてのカスタムモデルおよび外部モデルのデプロイで利用できます。
保持期間は、システム管理者が組織レベルで設定し、その組織内のすべてのユーザーに適用されます。 ポリシーが明示的に設定されていない場合、トライアル版利用の組織には14日間のポリシーが、有料版利用の組織には30日間のポリシーが適用されます。 管理者は、シグナルタイプ(トレース、ログ、メトリクス)ごとに、保持期間を14、30、60、90、180、または360日に設定できます。
組織の保持期間設定を確認または変更するには、OTelの保持期間の設定を参照してください。
トレーステーブルでは、各トレースに関連する以下のフィールドを確認できます。
| 列 | 説明 |
|---|---|
| タイムスタンプ | YYYY-MM-DD HH:MM形式でのトレースの日時。 |
| ステータス | すべてのスパンを含むトレースの全体的なステータス。 依存タスクが失敗した場合、ステータスはエラーになります。 |
| トレースID | トレースの一意の識別子。 |
| 期間 | トレースの完了にかかった時間(ミリ秒単位)。 この値は、(四捨五入された)ルートスパンの期間と同じで、子スパンによって表されるすべてのアクションが含まれます。 |
| スパン数 | トレースに含まれる完了したスパン(アクション)の数。 |
| コスト | コストデータが指定されている場合は、トレースの総コスト。 |
| プロンプト | トレースに関連するユーザープロンプト。 |
| 補完 | トレースのプロンプトに関連付けられているエージェントまたはモデルの回答(補完)。 |
| ツール | トレースで表されたリクエスト中に呼び出されるツールまたはツール群。 |
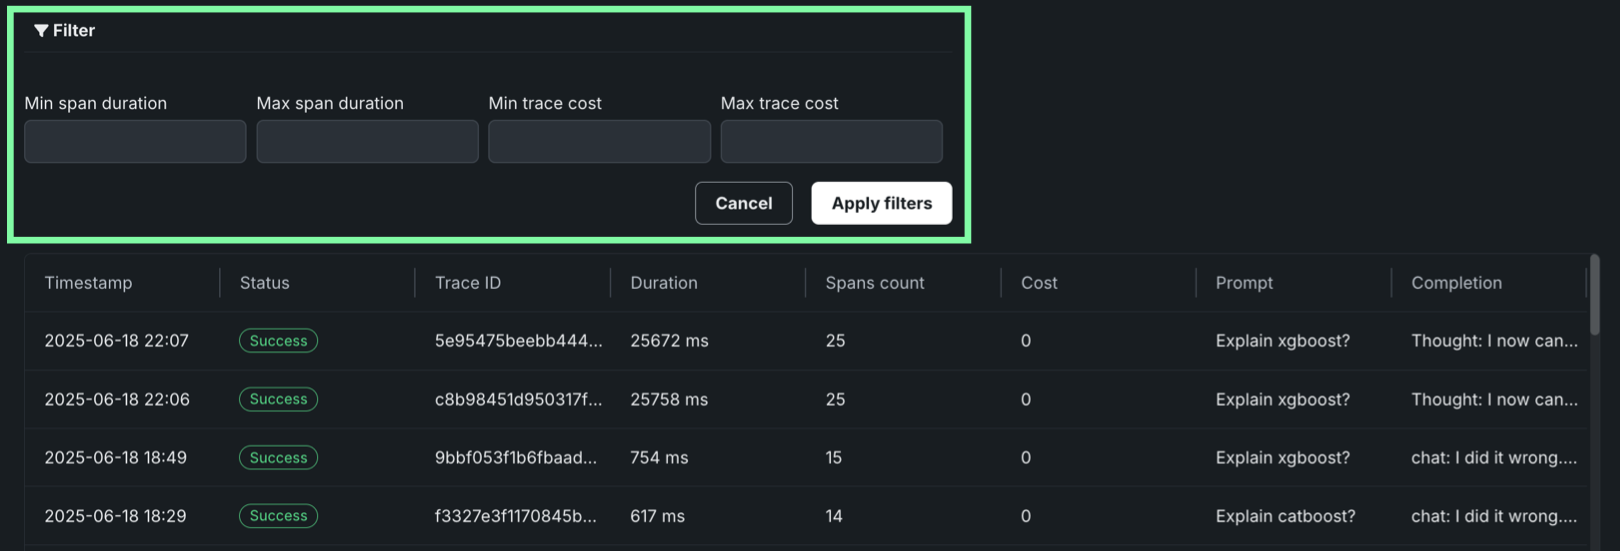
フィルターをクリックして、最小スパン期間、最大スパン期間、最小トレースコスト、最大トレースコストでフィルターします。 スパンフィルターの単位はナノ秒(ns)です。チャートにはスパンがミリ秒(ms)で表示されます。
フィルターのアクセシビリティ
スパンが詳細ビューに展開されると、 フィルターボタンは非表示になります。 フィルターを適用したチャートビューに戻るには、 詳細パネルを表示しないをクリックします。
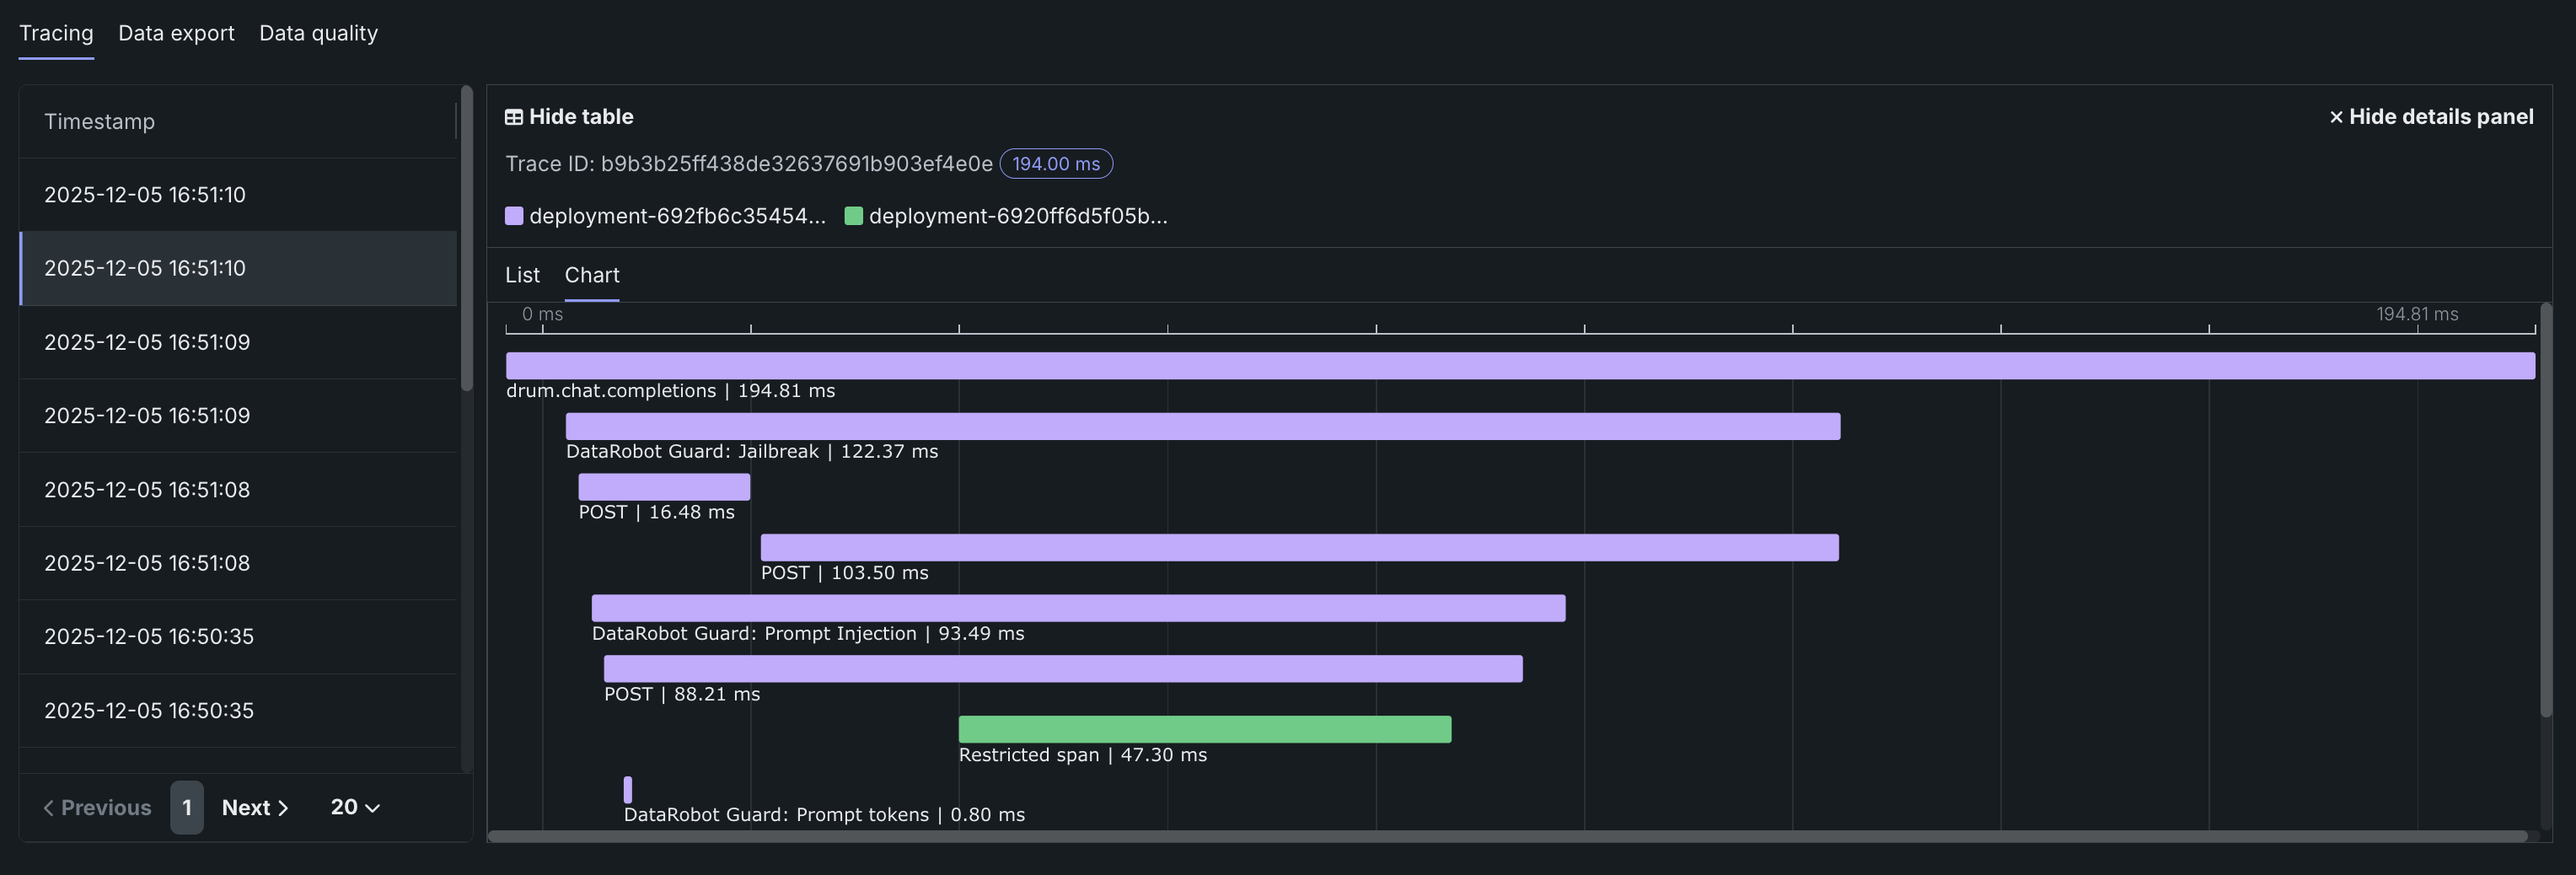
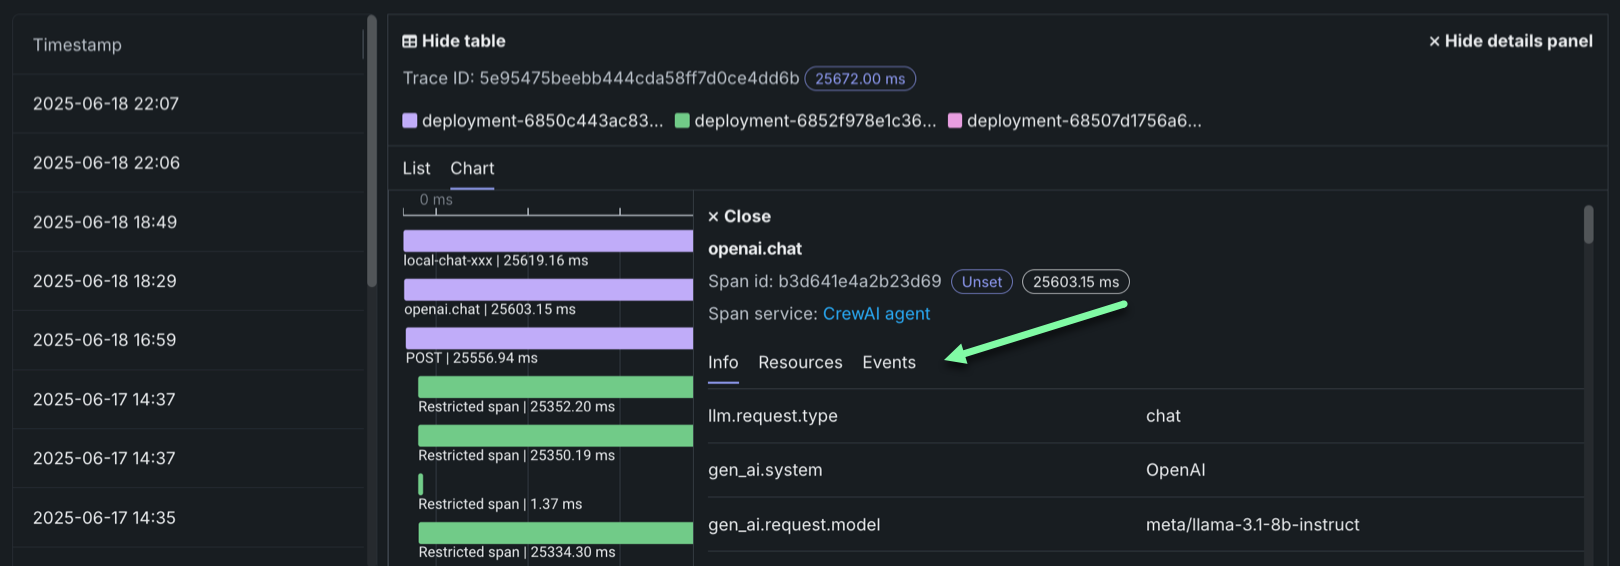
トレースに含まれるスパンとトレースの詳細を確認するには、トレーステーブルのトレース行をクリックします。 スパンの色は、スパンサービス(通常はデプロイ)に対応します。 スパンに関連付けられたデプロイまたはサービスへのアクセス権がない場合、制限されたスパンが表示されます。 スパンはチャート形式またはリスト形式で表示できます。
スパンの詳細をコントロール
どちらのビューからでも、 テーブルを表示しないをクリックしてタイムスタンプテーブルを折りたたんだり、 詳細パネルを表示しないをクリックして展開されたトレーステーブルビューに戻ったりすることができます。
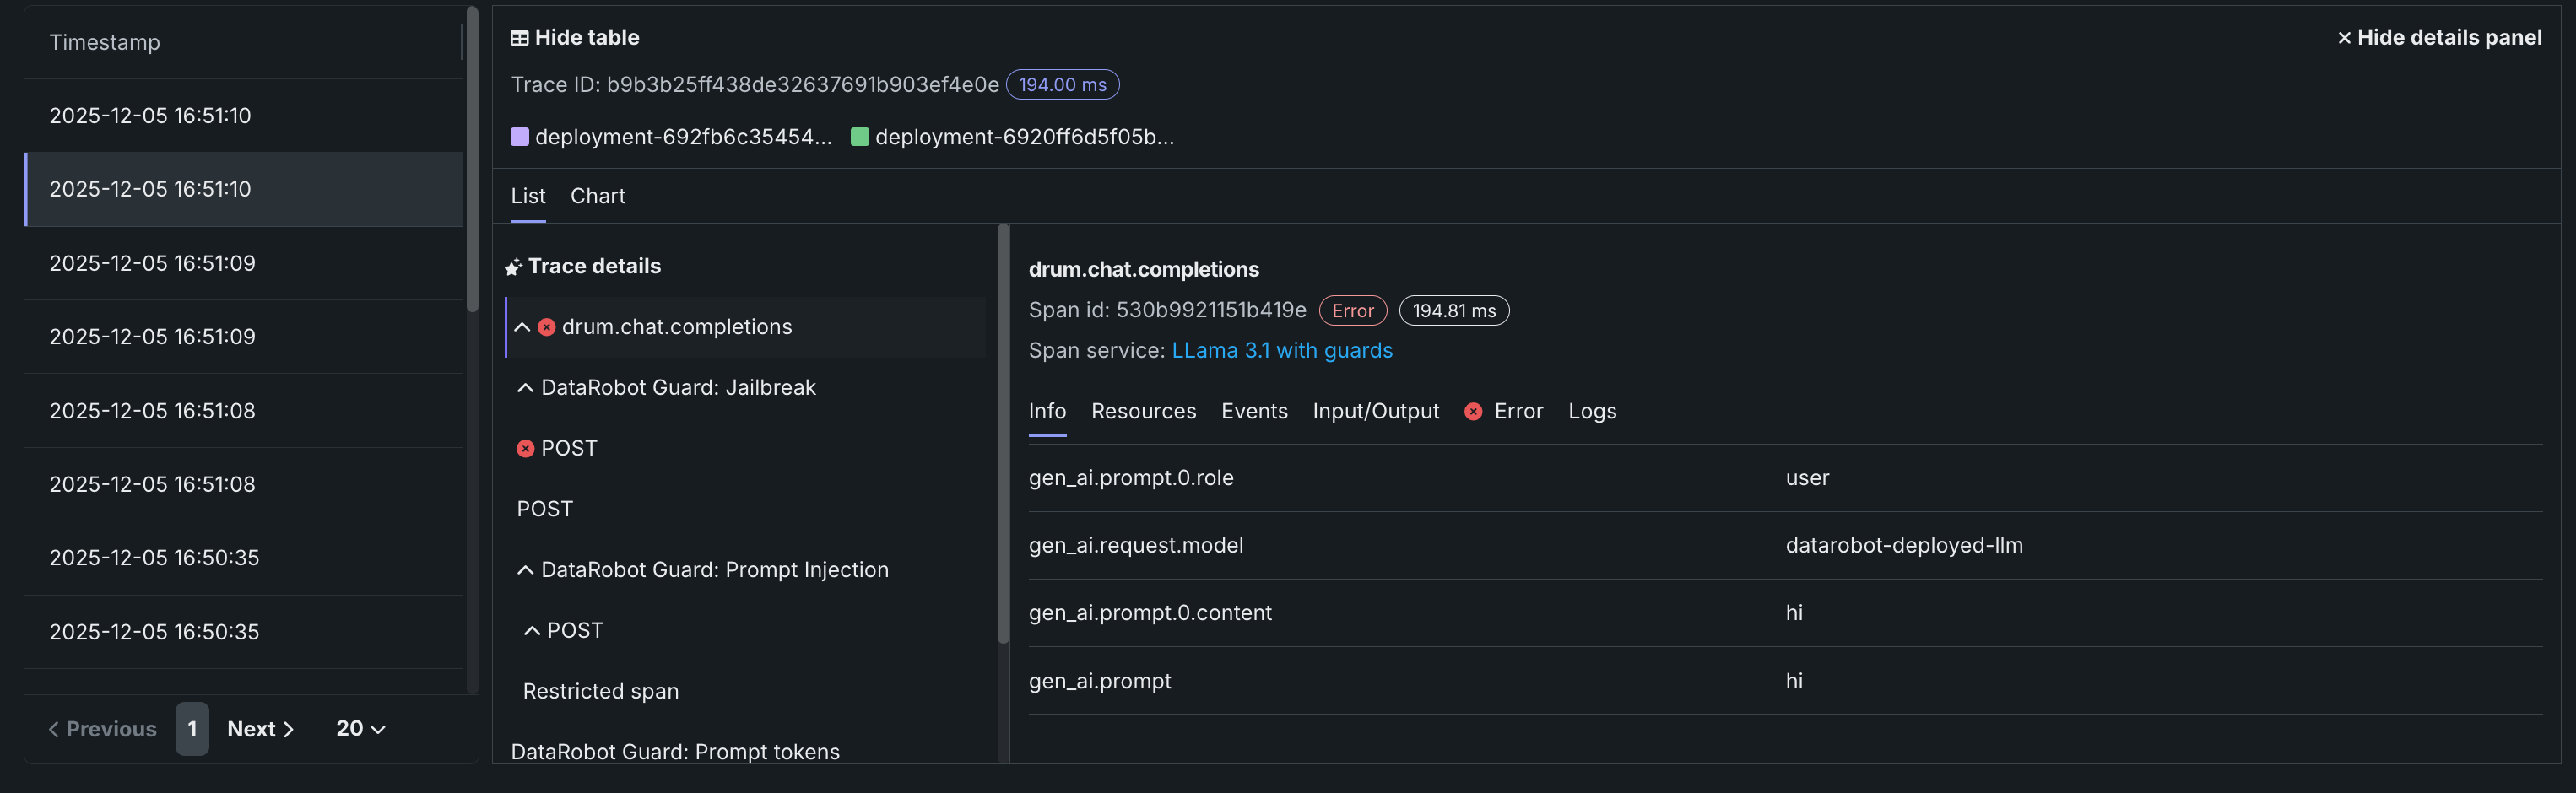
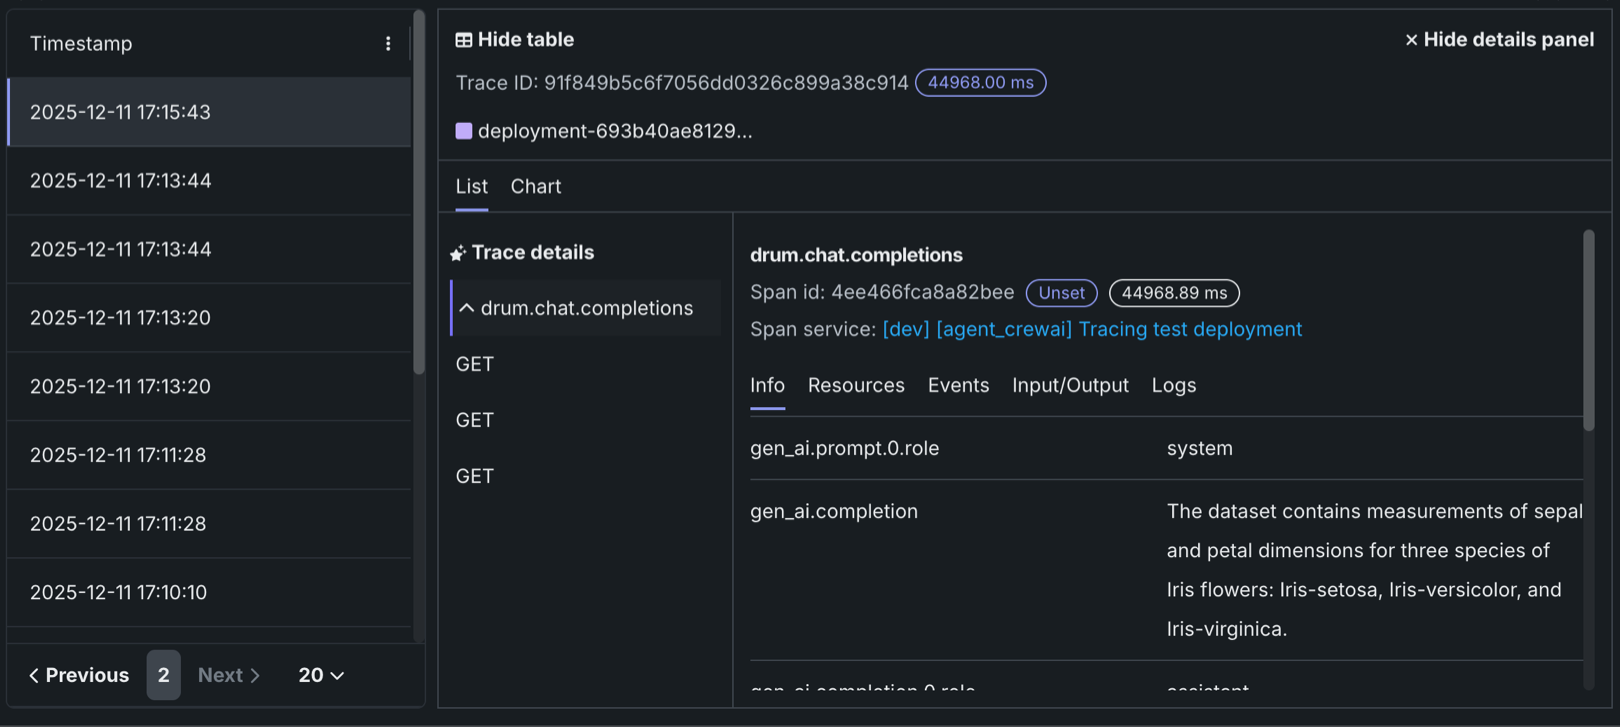
トレースの詳細
リストビューでトレースの詳細をクリックすると、現在のスパンに関連付けられているトレースに関する入力/出力(プロンプトと補完)および評価の詳細を表示できます。
どちらのビューでも、スパンサービス名をクリックして、デプロイまたはリソースにアクセスします(アクセス権がある場合)。 生成AIモデルまたはエージェントワークフローの設定に応じた追加情報を、情報、リソース、イベント、入力/出力、エラー、ログの各タブで入手できます。 エラータブは、トレースでエラーが発生した場合にのみ表示されます。
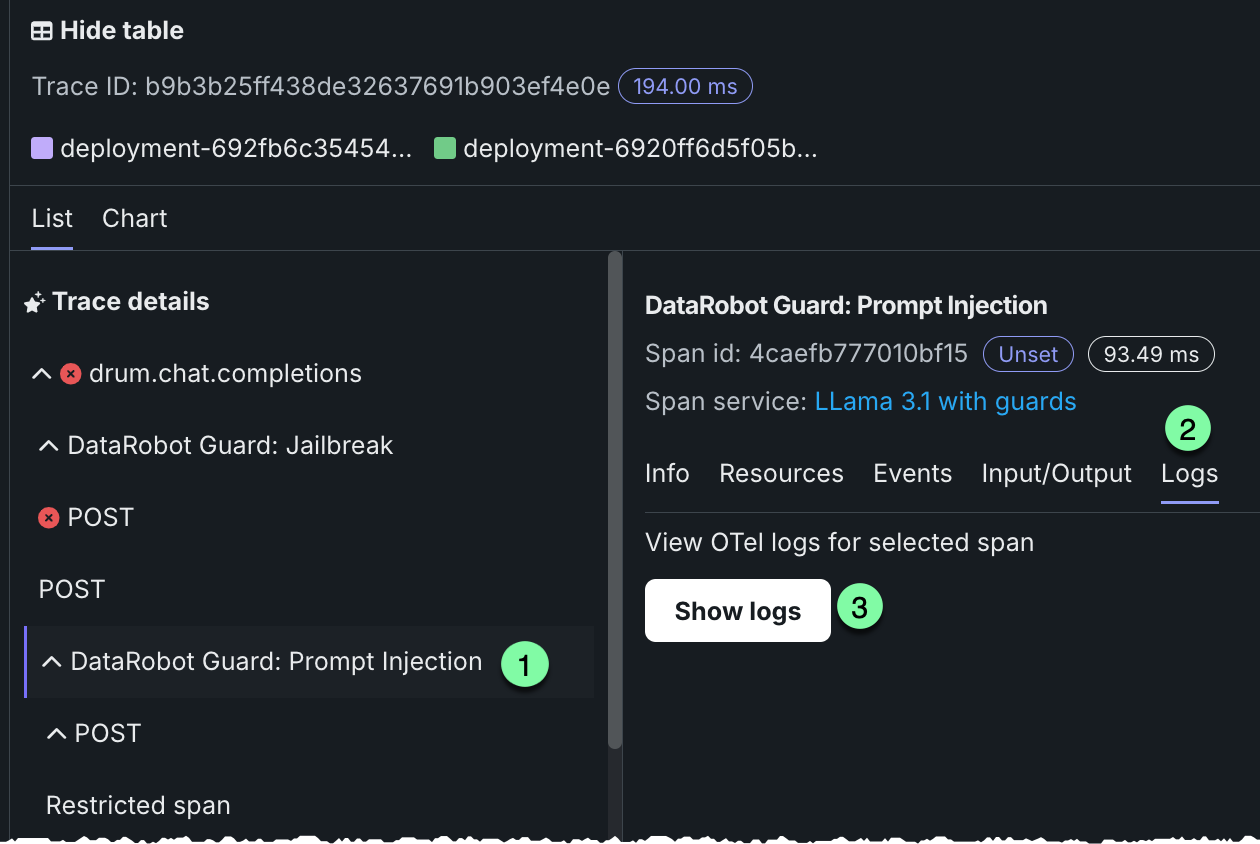
トレースログをフィルター
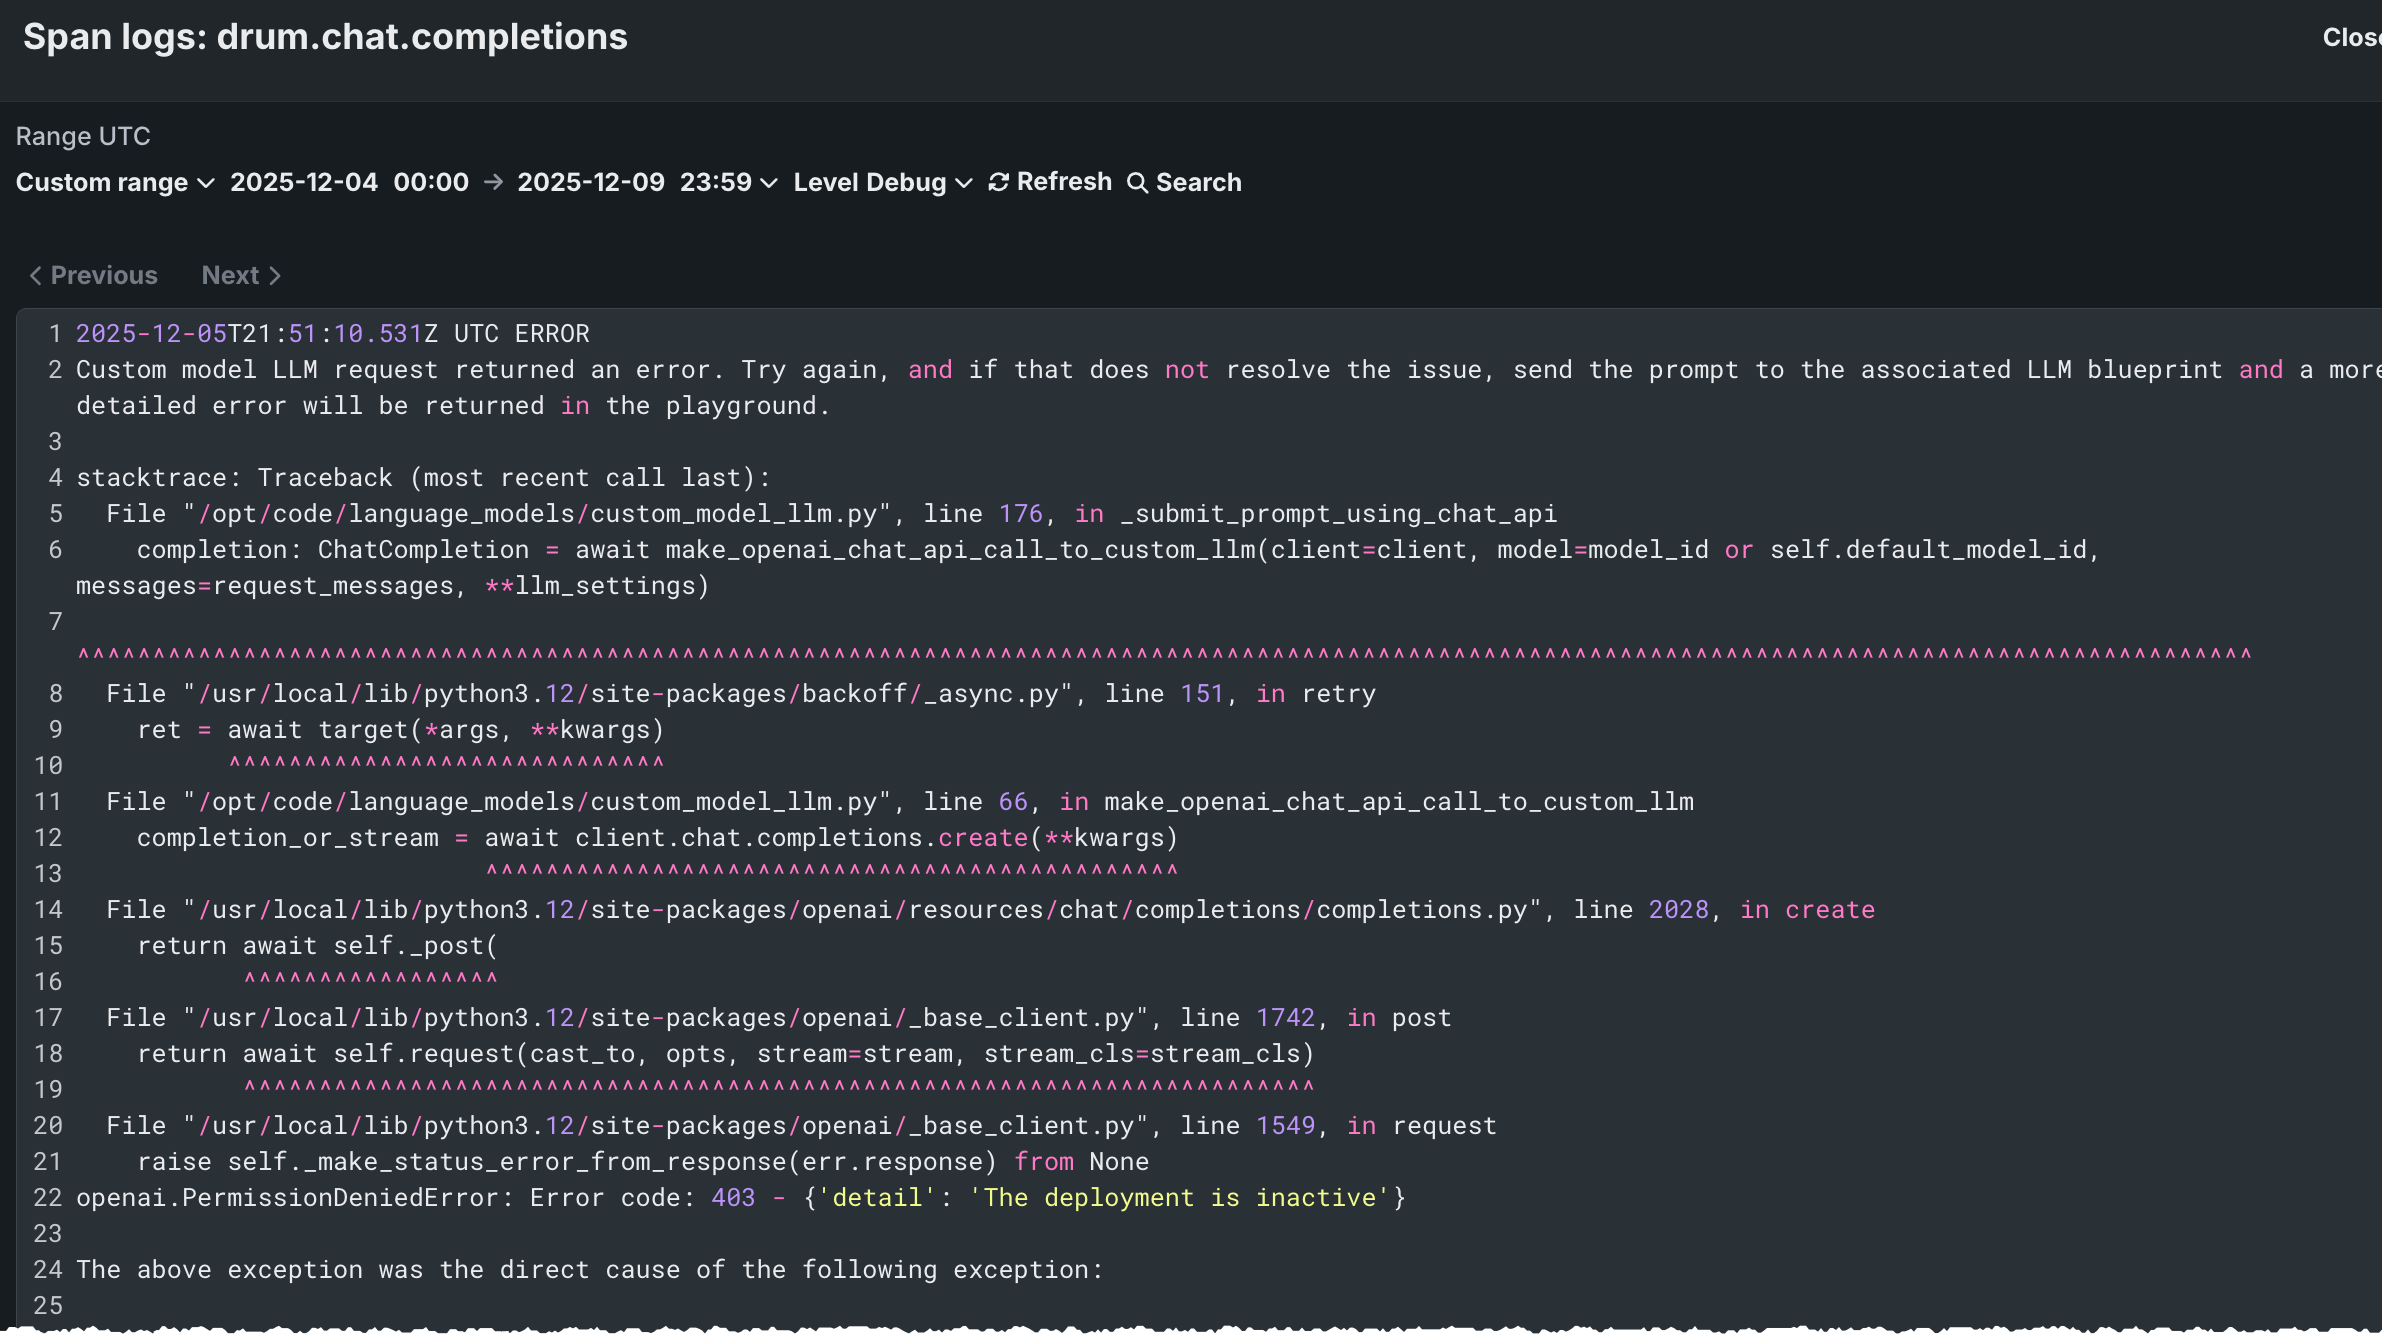
リストビューから、スパンのOTelログを表示できます。 表示される結果は完全なデプロイログのサブセットであり、以下のようにアクセスされます。
-
リストビューを開き、トレースの詳細でスパンを選択します。
-
ログタブをクリックします。
-
ログを表示をクリックします。
トレーステーブルのOTel属性
コスト、プロンプト、補完、およびツールについては、DataRobotはトレースに属するすべてのスパンにわたる特定のスパン属性を読み取ります。 その他の列(タイムスタンプや期間など)は、これらの属性ではなく、トレースおよびスパンのメタデータから取得されます。
| 列 | OpenTelemetryのマッピング |
|---|---|
| コスト | トレース内のスパンにある datarobot.moderation.cost属性の数値を合計します(その属性が存在する場合)。 |
| プロンプト | gen_ai.prompt属性を使用します。 複数のスパンにgen_ai.promptが含まれている場合、トレース順で最初に検出された値が表示されます。 |
| 補完 | gen_ai.completion属性を使用します。 複数のスパンにgen_ai.completionが含まれている場合、トレース順で最後に検出された値が表示されます。 |
| ツール | トレース内のスパンで検出されたtool_name属性の一意の値をすべて収集し、それらのツール名を列に一覧表示します。 |
属性キーは完全に一致する必要があります(gen_ai内のアンダースコアも含みます)。 genai.promptやGenAI.promptといった名前は、プロンプトおよび補完列では読み込まれません。
自動計装(DataRobotのエージェントテンプレートを含む)では、多くの場合、gen_ai.prompt、gen_ai.completion、そして場合によってはtool_nameが設定されます。 カスタムモデルや外部モデルの場合、フレームワークが異なります。ツールが実行されても(たとえば、一部のLangGraphコールバックフロー)、実行時にtool_nameが出力されない場合があります。 その場合、プロンプトと補完には値を設定できますが、ツールについては、ツール内で実行されるスパンにtool_nameが設定されるまでは空のままになります。トレースの実装を参照してください。