マネージドAIプラットフォームリリース
9月にリリースされたSaaS機能のお知らせ
September 2026
This page provides announcements of newly released features available in DataRobot's multi-tenant SaaS AI Platform, with links to additional resources. リリースセンターからは、過去にリリースされた機能のお知らせや、セルフマネージドAIプラットフォームのリリースノートにもアクセスできます。
エージェント型AI
Public discoverability of A2A agent cards
Before calling an agent, A2A clients fetch the agent's card from a well-known URL. Now, you can allow unauthenticated clients to reach /.well-known/agent-card.json on DataRobot agent endpoints. This permits external consumers and partners to complete that handshake without already holding an API key. Discovery is served from the existing endpoint structure on both custom model deployments and the Workload API. An anonymous caller receives a redacted card—enough to identify the agent and how to authenticate—with internal details omitted. An authenticated caller in the same tenant receives the full (extended) card. A caller authenticated for a different tenant is rejected, as before.
BYO LLMs to the LLM gateway
The LLM gateway provides easy user access to supported LLMs, as configured by an enterprise admin. Previously the gateway only supported models provided by DataRobot. This release introduces the ability to bring your own LLM and register it in the gateway catalog. By doing so, these LLMs share the same interface and support as out-of-the-box LLMs.
The administration of adding enterprise-supported LLMs is an API-only feature. Once onboarding of the LLM is complete, however, the model will appear in the gateway UI with an identifying badge for users with appropriate permission.
Build Workload images from source code
You can now hand DataRobot your source code and let the platform build the container image for a Workload—no local docker build, registry push, or registry credentials. Set imageBuildConfig on a container instead of setting imageUri, point it at an uploaded catalog snapshot with a codeRef, and trigger a build. When the build finishes, DataRobot writes imageUri onto the container for you.
This flow works on draft artifacts of type service, agent, or mcp. You choose the Dockerfile: upload one with your source (provided), or let the platform generate one (generated) from a Python (pyproject.toml + uv.lock) or Node.js (package.json + package-lock.json) project at the upload root. Generated builds install locked dependencies on an execution-environment base image. Anything else (pip, Poetry, Yarn, pnpm, mixed-language repos) needs a provided Dockerfile.
Each step is independent: re-upload source without rebuilding, rebuild without redeploying, or reuse the built image on more than one Workload.
For more information, see Build an image from source code.
MCP OAuth now validates with Okta
DataRobot MCP servers now support two-level OAuth checks with Okta. The platform gateway authenticates each request by verifying that the Okta-signed JWT is valid. When MCP builders opt in with MCP_ENABLE_OAUTH_CLAIM_VALIDATION, the MCP server then authorizes the tool call by validating the token's audience (aud) against the value in the MCP configuration and confirming that the token includes every required scope.
You can declare required scopes per tool with a tool tag or a tool decorator. A JWT that uses a mismatched audience string—including a trailing-slash difference—or that is missing any required scope is rejected with a 403. Validation applies to both on-behalf-of (OBO) user flows and OBO external application flows.
On Self-Managed (single-tenant) clusters, MCP builders can also opt in to an unauthenticated MCP well-known endpoint with MCP_ENABLE_UNAUTHENTICATED_WELL_KNOWN_ROUTE.
Deploy MCP servers using the Workload API
The DataRobot MCP template can now deploy your MCP server using the Workload API as a preview option, in addition to the existing serverless custom model deployment. With Workload API deployment, DataRobot builds the container image for you from your MCP server's source code, so you can customize the template and deploy it without building an image yourself.
Serverless deployment remains the default. To deploy to the Workload API instead, set ENABLE_MCP_ON_WORKLOAD_API=true in your .env file and run task deploy. Run task workload-deployment-flag-check to confirm which deployment mode your configuration resolves to before deploying. Optional settings control the Workload's Dockerfile path, container port, replica count, CPU, and memory. After deployment, the MCP endpoint is available from the Pulumi stack output, and MCP servers deployed as Workloads appear in the MCP UI when the Workload API is enabled for your organization.
For more information, see Standalone MCP server.
データ
Improved document processing performance and accuracy
Document text extraction (OCR) has been upgraded to DataRobot's new OCR pipeline, which delivers more accurate text extraction and is now the default engine when creating OCR jobs.
Registry and Console
Python pipelines in Registry
The Pipelines tab in Registry lets you author, run, and schedule Python pipelines as directed acyclic graphs (DAGs). Define work with @dr.task and @dr.pipeline; DataRobot parses the task-call graph, runs independent tasks in parallel, and records status, logs, and results per task.
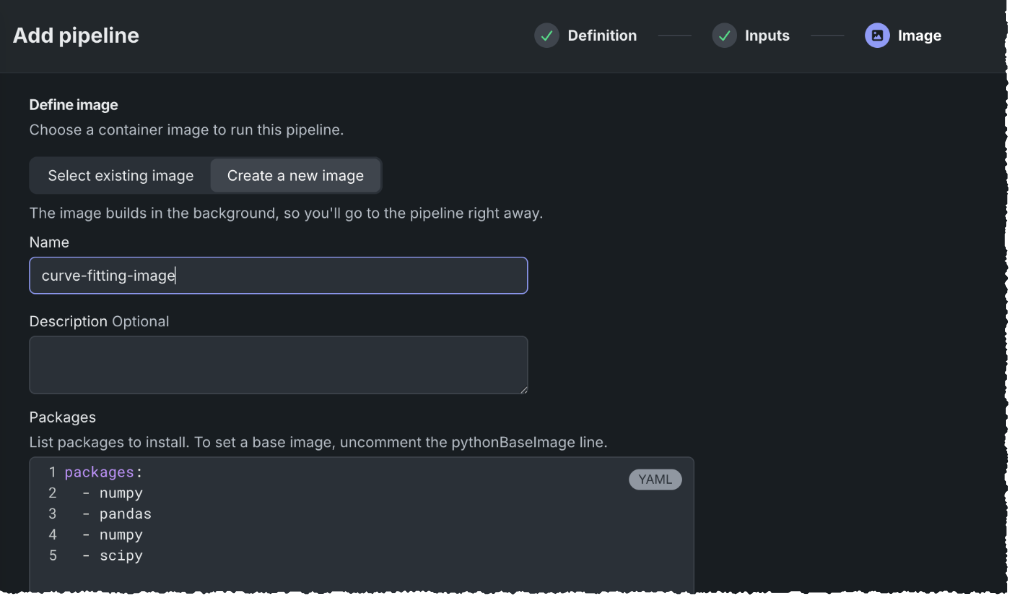
Add a pipeline from a three-step wizard: upload or paste the Python source (Definition), set parameters parsed from the pipeline signature (Inputs), and attach a reusable container image (Image)—select an existing image or create one with the packages the pipeline needs. Completing the definition phase saves a mutable draft. Recurring schedules require a locked pipeline: Lock & Schedule freezes the logic and environment, then sets a simple or advanced (cron) cadence in UTC. You can also run a pipeline immediately; when it is locked, image and inputs are immutable.
Each pipeline opens to an interactive Workflow view of the DAG, details, and runs history, with task-level stdout/stderr and downloadable return values. A scheduled run that would overlap another run of the same input is rejected. Images live on the Images tab and can be rebuilt or shared across pipelines.
Manage memory spaces in Registry
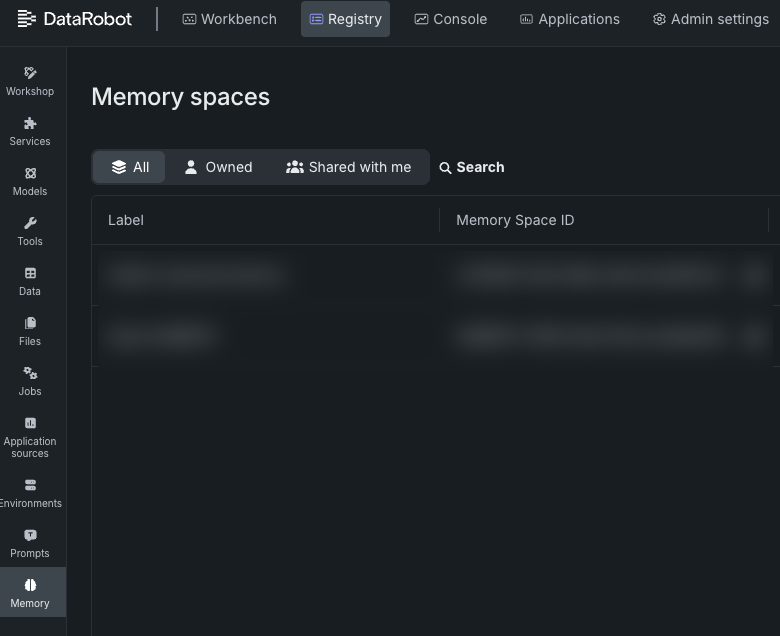
The Memory spaces tile in Registry is a centralized place to view and manage memory spaces for agentic applications. メモリー空間とは、チャットセッション、イベント、および長期的な意味記憶のための分離境界です。 From the Registry > Memory tile, you can see every space you created, own, or that another user shared with you. Filter the list with All, Owned, and Shared with me, and search by label or memory space ID.
Memory spaces are created through the REST API or Python client. In Registry, owners and users with share permissions can grant Consumer, Editor, or Owner access to users, groups, or organizations. Consumer is read-only; Editor can ingest memories, post events, and create sessions; Owner has full control, including delete and re-share. Sharing is managed in the Share dialog; it is not exposed through the memory service API or Python SDK.
An administrator must enable Enable Access to Agentic Memory API on the user's profile before they can open the page or call the memory API. With that flag on, you still see only spaces you own or that were shared with you—not every space in the organization.
Unified tracing UI for applications and deployments
Applications and deployments now share the same Tracing interface. Deployments have a dedicated Tracing tab. Search and filter traces by timestamp, status, and type; inspect spans in a combined list and timeline; and review attributes, logs, input, and output on one page.
プラットフォーム
User Activity Monitor filter and export updates
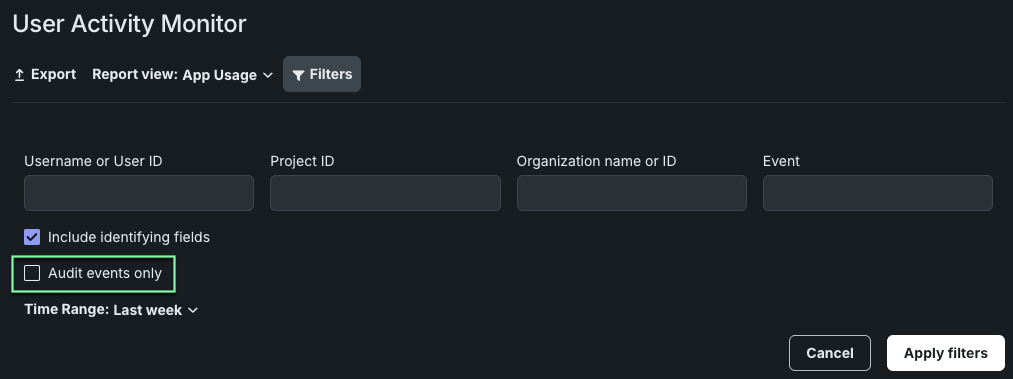
The User Activity Monitor uses a Filters panel allowing you to narrow the online report preview by username or user ID, project ID, organization name or ID, and event name. A new Audit events only option limits results to security-relevant audit events and excludes analytic-tracking events such as notebook interactions; this filter applies to both the online preview and exported reports. Click Apply filters to update the preview and Clear all to remove them.
Within the exported CSV archives, Admin Usage and App Usage reports also add Client IP (the address DataRobot received; N/A for automated events) and Was Success (true/false) for all events.
コードファースト
Python 3.13 is now the default notebook and codespace environment
New notebooks and codespaces now use the built-in Python 3.13 environment image by default, replacing Python 3.11. The image includes Python 3.13, the DataRobot Python client, and common data science libraries. It is also required to connect a local IDE to a codespace over SSH.
Existing notebooks and codespaces keep the image already selected for them. To continue using Python 3.11, choose that image on the Environment tab. Self-managed administrators can restore Python 3.11 as the cluster default by setting DEFAULT_ENV_ID in values.yaml; see Notebooks.
Python 3.11 will be deprecated in a future release. DataRobot recommends upgrading to Python 3.13.
For more information, see Built-in environment images.
Search for groups by name through the API
You can now look up a group by its exact name using the new GET /api/v2/directoryEntities/ endpoint, without needing to belong to that group or hold admin permissions. Matching is case-insensitive.
This helps teams that manage sharing and access through CI/CD pipelines rather than the UI: previously, a standard user's search returned an empty list for any group they weren't a member of, with no indication that results had been filtered. Now any authenticated user can resolve a known group name to its ID and use that ID with the existing sharing endpoints to grant the group access to Use Cases, deployments, and other assets programmatically.
Results are scoped to the caller's own organization, and resolving a group ID grants no access on its own—the sharing endpoints continue to enforce their own permissions.
サポート終了/移行ガイド
-
The Python 3.11 image will be deprecated in a future release. DataRobot recommends upgrading to Python 3.13. See the announcement for more information.
-
Prometheus Pushgateway support for Kavmon metrics export will be retired in January 2027. Organizations should migrate to OpenTelemetry integration before this date for continued metrics export. For full details, see the install guide section on exporting Kubernetes availability monitor metrics.
記載されている製品名および会社名は、各社の商標または登録商標です。 製品名または会社名の使用は、それらとの提携やそれらによる推奨を意味するものではありません。