時間認識のデータラングリング
特徴量エンジニアリングは、ユースケース要件にうまく対処するための主要な要素です。 ラングリング操作のレシピを作成し、最初にサンプルに適用してから、検証されたときに完全なデータセットの時間認識データに適用することで、データ準備段階で時系列特徴量エンジニアリングを実行できます。 入力データに対してラグやローリング統計のような処理を実行することで、モデリングの 前に どの時間ベースの特徴量を生成するかを制御できます。 時間認識操作と非時間認識操作の両方を追加した結果として得られるプレビューを確認することで、パブリッシュする前に調整できるため、自動的に実行される処理がユースケースに合わない場合に、モデリングを再実行する必要がなくなります。
このページでは、時間認識ラングリングに固有のワークフローについて説明します。 詳細については、 完全なラングリングドキュメントも参照してください。
基本的なワークフロー
以下に基本的なワークフローについて説明します。
備考
操作の設定が進んでも、設定の検証は行われません。 これは、他のエクスペリメント設定と連動して検定が行われるパーティショニングが、プロセスの後半で行われるためです。
- 設定されたデータ接続を使用して、Snowflake、Databricks、またはBigQueryに接続します。 データに接続したら、ユースケースに追加ではなく、ラングリングオプションを使用することが重要です。 追加した場合、サンプルは静的なデータセットとして取り込まれ、ラングリングの対象にはなりません。
- プレビュー設定から、ライブサンプルを設定します。
- サンプリング設定が完了したら、再サンプリングをクリックして設定を適用します。
- レシピパネルから操作を追加します。
サンプリング方法の設定
デフォルトでは、DataRobotはライブサンプルに対して10000のランダム行を取得します。
備考
サンプリング方法を設定する場合、設定するデータサンプルはラングリング内のみで使用され、レシピがパブリッシュされるまで、完全なデータには適用されません。
時間認識ラングリングを使用、具体的には、サンプルに派生プランを作成するようにDataRobotを設定するには、日付/時刻サンプリング方法を使用する必要があります。 つまり、日付/時刻以外のサンプルにはラグとローリング統計を適用できますが、 提案された派生プランが提供する自動化を利用することはできません。
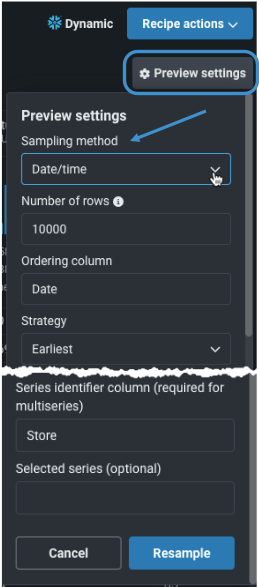
日付/時刻サンプリングを設定するには、プレビュー設定を開き、サンプリング方法を日付/時刻に設定します。
次に、以下の表に記載されている日付/時刻に特化したフィールドに入力します。
| フィールド | 説明 |
|---|---|
| サンプリング方法 | メソッドを日付/時刻に設定して、指定した最新/最古の行を含むサンプルを日付/時刻特徴量順に作成します。 ここで説明するように、ランダムまたは最初のN行を選択した場合、自動化された時系列特徴量の派生プランの提案を利用することはできません。 |
| 行数 | ソースデータから取得する行数を指定します。 10000未満の値を入力してください。取得する行数が多いほど、ライブサンプルのレンダリングに時間がかかることに注意してください。 |
| 順序付け特徴量 | DataRobotがサンプルの作成に使用するプライマリー日付/時刻特徴量を含む列の名前を選択します。 日付/時刻対応の特徴量の変換を設定する際は、順序付け特徴量として使用する予定の特徴量と同じ特徴量を使用します。 |
| 戦略 | サンプルから取得する行を設定します。最も古い行または最も新しい行のいずれかを選択できます。 DataRobotが派生プランを提案する場合は、最も古い方が適切な選択です。 これは、プランが生成される際に、ターゲット値が特徴量削減プロセスで使用されるためです。 そのことを考えると、最も古い行を使用してモデリングデータを作成すると、それらの行が後で検定またはホールドアウトの一部になる可能性が最小限に抑えられます。 |
| 系列識別子の列 | 複数系列モデリングが複数の個々の時系列データセットを識別するために使用する列の名前を入力します。 識別子は、各行がどの系列に属するかを示します。 |
| 選択された系列 | (オプション)複数系列データ内で、サンプル内に存在する1つ以上の系列を選択します。 |
すべてのフィールドに入力してリサンプリングをクリックします。 ライブサンプルが更新され、設定に基づいて選択されたデータが表示されます。 これで操作を追加できるようになりました。
操作の追加
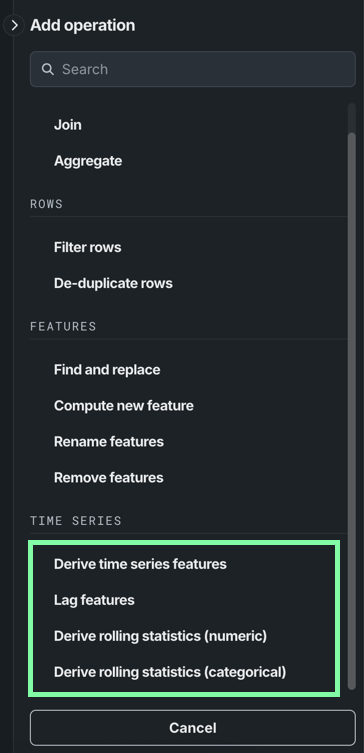
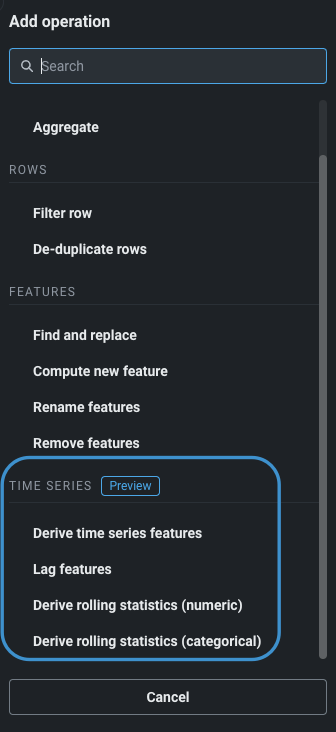
操作とは、モデリングの準備を行うためにソースデータに適用される変換のことです。 以下のセクションでは、時間認識の操作について説明します。他の操作やレシピ内での操作の使用方法に関する情報については、 操作リファレンスを参照してください。 変換の設定を開始するには、+ 操作の追加をクリックします。
以下の時間認識固有の操作が可能です。
| 操作 | 説明 |
|---|---|
| 時系列特徴量の派生 | 新しい時間認識特徴量を生成します。 この操作では、入力データセットが、操作ごとに指定した予測距離だけ拡張された出力データセットに置き換えられます。 |
| ラグ特徴量 | 特徴量を作成する過去の期間を設定し、1つ以上の特徴量をデータセットに追加します。 |
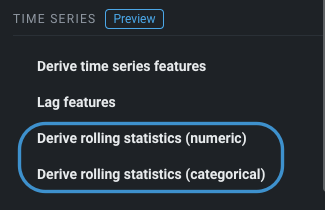
| ローリング統計の派生(数値とカテゴリー) | ローリング時間ウィンドウで統計を計算します。 この操作により、1つ以上の特徴量がデータセットに追加される場合があります。 |
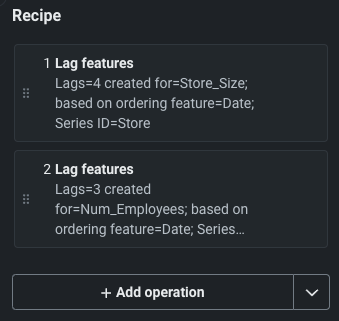
特定の操作のすべてのフィールドに入力したら、+ レシピに追加をクリックします。 プレビューは、変更内容に基づいて更新されます。 各操作のサマリーは、レシピパネルに表示されます。
時系列特徴量の派生
時間認識ラングリングを使用する場合、データは指定された日付列(「順序付け特徴量」)で順序付けされ、該当する場合は系列ID列でパーティション分割されます。 特徴量派生ウィンドウ(FDW)は行で定義されます。 これらのウィンドウでは、ウィンドウの開始は除外され、終了が含まれます。 つまり、データセットは日付順に「並べ替え」られ、たとえばFDW=5の場合、5行が特徴量の派生に使用されます。
時系列特徴量の派生操作では、新しい時系列特徴量が生成されます。 まず、基本的な情報を提供すると、DataRobotは予測距離に従ってデータを拡張し、(指定されている場合は)事前に既知の列とナイーブベースライン特徴量を追加してから、元のサンプルを置き換えます。 新しい特徴量を作成するには、DataRobotに派生プランを提案させて自動的に新しい特徴量を作成させるか、最大200の特徴量のタスクを手動で追加するか、またはハイブリッドアプローチを適用することができます。
備考
特徴量を手動で追加してから、提案された派生プランをリクエストして実行すると、手動の追加は自動生成された計画によって上書きされます。
パラメーターの設定
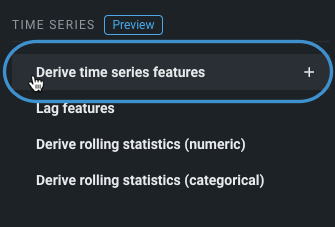
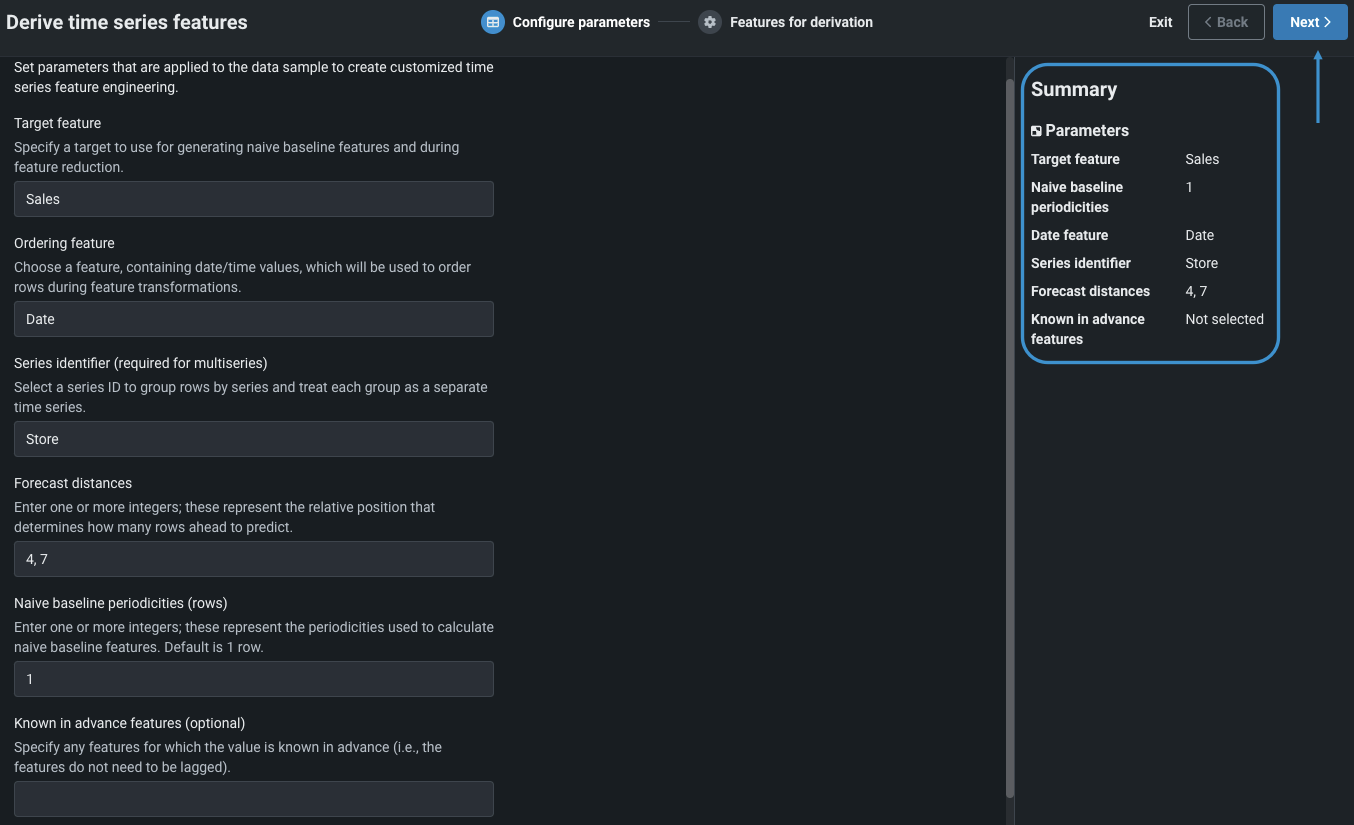
自動派生プランを使用するためのパラメーターを設定するには、サンプリング方法を日付/時刻に設定した後、時系列特徴量を派生操作を選択します。 また、サンプリング方法がランダムまたはN行の場合は、時間認識ラングリングパラメーターを設定できますが、自動化を利用することはできません。
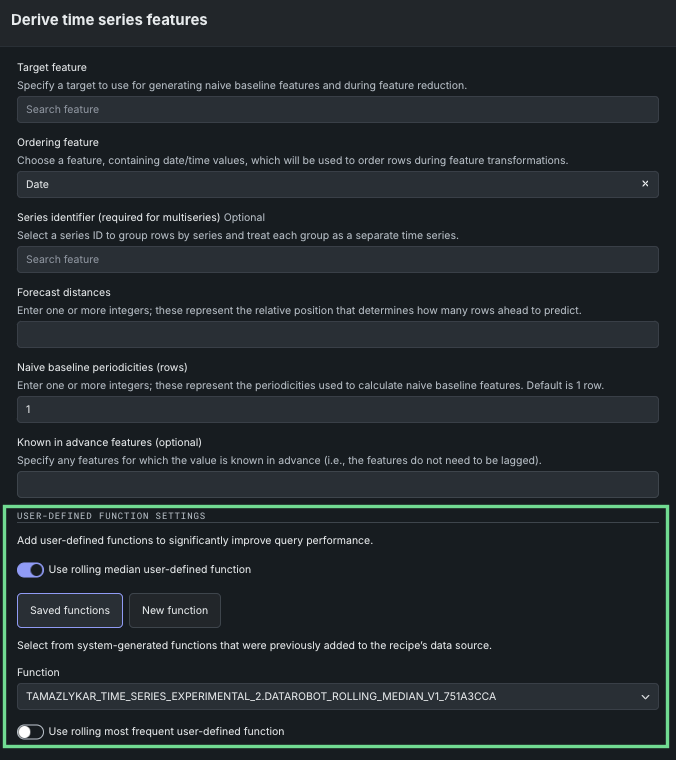
次の表に、設定するパラメーターを示します。
| フィールド | 説明 |
|---|---|
| ターゲット特徴量 | 特徴量の派生時にナイーブベースライン(おそらく季節的に最新の既知の値)特徴量を生成するために使用されるターゲット特徴量を設定します。 ターゲット特徴量は数値である必要があります。 |
| 順序付け特徴量 | 特徴量の変換中にDataRobotが行の並べ替えに使用するプライマリー日付/時刻の特徴量を含む列の名前を選択します。 |
| 系列識別子の列 | 複数系列モデリングが複数の個々の時系列データセットを識別するために使用する列の名前を入力します。 識別子は、各行がどの系列に属するかを示します。 |
| 予測距離 | 各位置から何行先を予測するかを決定する相対位置を設定します。 1つ以上の整数を入力します。 |
| ナイーブベースラインの周期性(行) | 行数として表される周期性を表す整数を1つ以上設定します。 これらの値は、ナイーブベースライン特徴量の計算に使用されます。 周期性は、将来のある時点の値が、周期の同じ時期に観測された最後の値と同じであることを前提としています。 |
| 事前に既知の特徴量 | (オプション)あらかじめ値がわかっている特徴量を指定します。 これにより、特徴量の実測値が維持され、予測日の特徴量値が予測値となります。 |
| ユーザー定義関数の設定 | |
| ローリング中央値のユーザー定義関数(数値) | (上級オプション)パフォーマンスを改善できる ヘルパー関数へのパスを指定します。 |
| ローリング最頻値のユーザー定義関数(カテゴリー) | (上級オプション)パフォーマンスを改善できる ヘルパー関数へのパスを指定します。 |
すべての設定は、右側のパネルのサマリーにまとめられていることに注意してください。 すべてのフィールドが入力され正しい場合、次へをクリックします。
派生のための特徴量
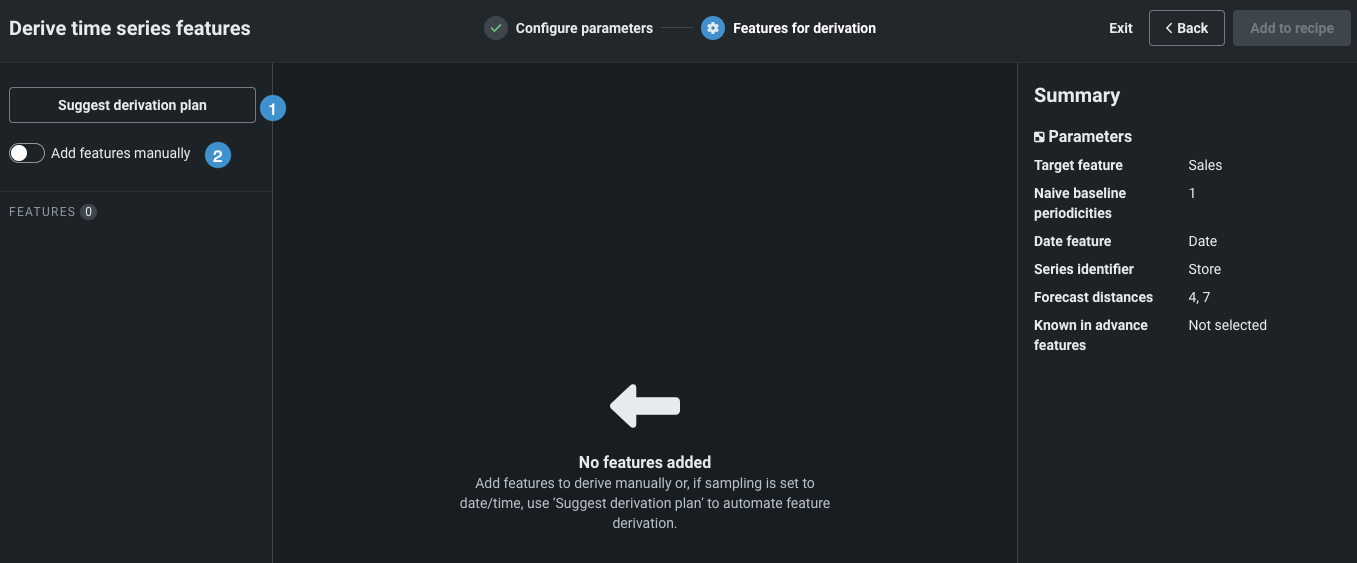
次へをクリックすると、派生のための特徴量パネルが開きます。
派生時系列の特徴量を作成するには、次のオプションを使用できます。
| 方法 | 説明 | サンプリング | |
|---|---|---|---|
| 1 | 派生プランの提案 | DataRobotに 派生プランを提案させ、新しい特徴量を自動的に作成させます。 | 日付/時刻が必要 |
| 2 | 手動で特徴量を追加 | 最大200の特徴量を追加して、タスクを割り当てます。 | 任意 |
| 1+2 | ハイブリッドアプローチ | 提案された派生プランを使用してから、結果に手動でさらに特徴量を追加します。 | 日付/時刻が必要(自動プランの場合) |
派生プランの提案
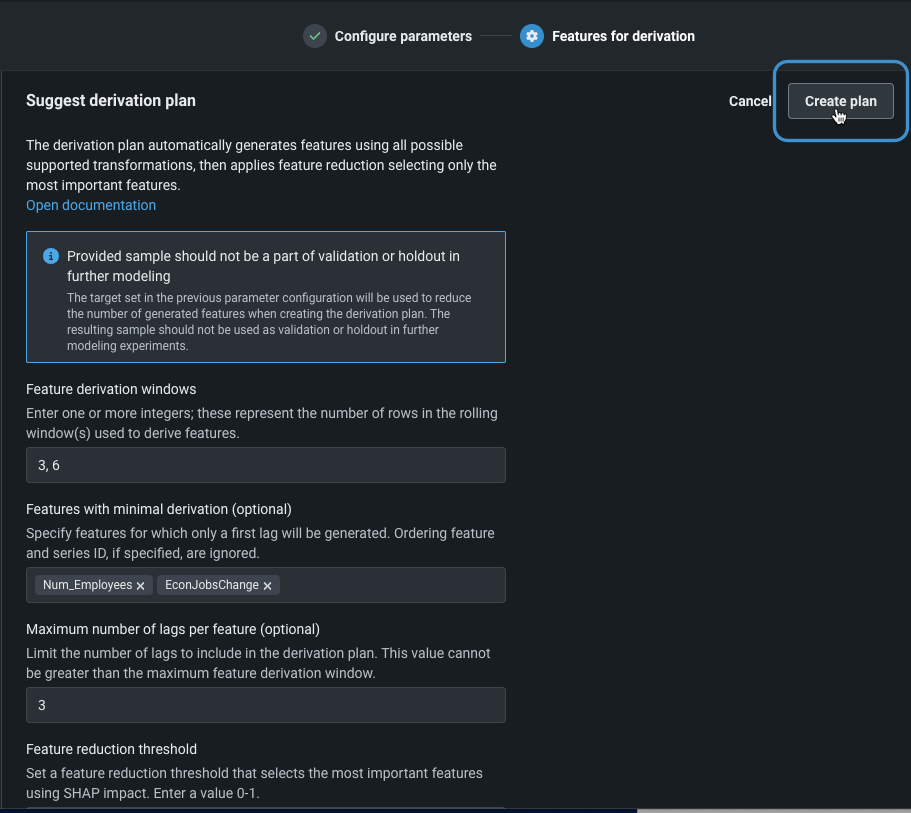
サンプリング方法を日付/時刻に設定し、指定した設定に基づいてラグとローリング統計をDataRobotに作成させたい場合は、派生プランの提案オプションを使用します。 オプションをクリックしてフィールドに入力します。
| フィールド | 説明 |
|---|---|
| 特徴量派生ウィンドウ* | DataRobotが特徴量の派生に使用する行数(データの期間)を設定します。 1つ以上の値を入力します。 |
| 派生が最小限の特徴量 | (オプション)単一のラグ(最初のラグ)のみが作成される特徴量を指定します。 プライマリー日付/時刻特徴量や系列IDを除外することはできません。 |
| 特徴量ごとのラグの最大数 | (オプション)派生プランによって作成されるラグの最大数を指定します。 |
| 特徴量削減のしきい値 | 特徴量削減のしきい値となる、最もインパクトのある特徴量を選択する特徴量削減しきい値を設定します。 たとえば、デフォルトの0.9は、有用性が累積で90%に達した特徴量が返されることを意味します。 有用性は、 SHAPインパクトの計算に基づいて派生されます。 |
| 情報量の少ない特徴量を除外 | 有効にすると、デフォルトでは、特徴量は「妥当性」チェックを通過する必要があります。このチェックでは、一般化が可能なモデルの構築に有用な情報が含まれているかどうかが判断されます。 |
* 予測ポイントは特徴量派生ウィンドウの一部です。特徴量派生ウィンドウの端は常にゼロです。 このため、時系列データラングリングには、 ブラインド履歴ギャップはありません。
すべてのフィールドに入力したら、プランを作成を選択します。 DataRobotは特徴量に操作(タスク)を適用します。
左側のパネルで特徴量名をクリックすると、作成されたタスクが中央のパネルに反映されます。 そこから、特徴量にさらにタスクを追加するには、派生タスクを追加をクリックします。 最終的にモデリングデータセットに適用したくないタスクを削除するには、タスクを削除をクリックします。 右側のパネルでは、特徴量ごとのタスクがサマリーに追加されます。
プランの見直し:
- 派生プランに問題がなければ、レシピに追加をクリックします。 ライブサンプルは、DataRobotがデータソースから新しいサンプルを取得し、操作を適用すると更新され、変換をリアルタイムで確認できます。
- 問題がある場合は、派生プランの提案をクリックして、設定を別の値にリセットします。 元の出力は、新しいプランからの出力で上書きされます。
手動で特徴量を追加
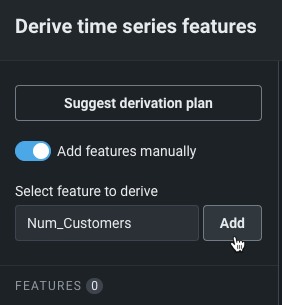
サンプリング方法に関係なく、特徴量を手動で追加するには、 パラメーターを設定し、手動で特徴量を追加するオプションをオンに切り替えます。 エントリーボックスをクリックして派生する特徴量を選択してから、追加をクリックします。
左側のパネルのリストに特徴量が追加され、派生の設定が中央パネルで使用可能になります。 または、左側のパネルで以前に追加した特徴量をクリックして派生設定を開きます。たとえば、設定を見直したり、タスクを追加または削除したりする場合に使用できます。
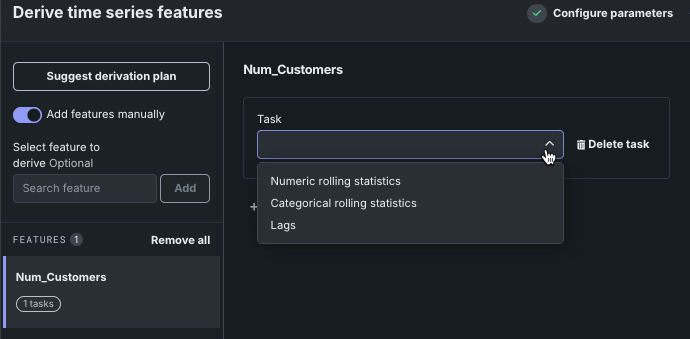
タスクを追加するには、タスクドロップダウンから選択します。 各タスクには、独自の設定フィールドがあります。
| タスク | フィールド |
|---|---|
| Lag | |
| 作成するラグ | 名前付き特徴量に対して作成するラグの順序を表す1つ以上の整数を入力します。 |
| 数値のローリング統計 | |
| 特徴量派生ウィンドウ(行) | 各ローリングウィンドウに含まれる行数を設定します。 統計は、現在の行を含むウィンドウで計算されます。 |
| 統計手法 | メソッドの設定:平均、中央値、標準偏差、最小、最大 |
| カテゴリーのローリング統計 | |
| 特徴量派生ウィンドウ(行) | 各ローリングウィンドウに含まれる行数を設定します。 統計は、現在の行を含むウィンドウで計算されます。 |
| 統計手法 | このフィールドは最頻値にあらかじめ設定されており、変更することはできません。 |
派生タスクを追加をクリックしてタスクを追加するか、タスクを削除をクリックして、派生の設定から個々のタスクを削除します。 特徴量を操作すると、DataRobotは右と左のパネルにタスクの数(未設定のタスクを含む)を報告します。
すべての派生タスクが特徴量に設定されたら、レシピに追加をクリックします。 ライブサンプルは、DataRobotがデータソースから新しいサンプルを取得し、操作を適用すると更新され、変換をリアルタイムで確認できます。
ハイブリッドアプローチ
サンプリングを日付/時刻に設定すると、派生プランの提案の自動化を活用しながら、設定が原因で見逃した可能性のある特徴量を追加できるハイブリッドアプローチを使用できます。 また、変換された特徴量にタスクを追加することもできます。
自動化されたプランが変換を作成した後に、新しい特徴量を追加するには、以下のいずれかの操作を行います。
- 手動で特徴量を追加をオンに切り替えて、特徴量を検索してから、タスクを設定します。
- 左側のパネルで特徴量をクリックしてタスクの設定を表示し、派生タスクを追加をクリックして、その特徴量の新しいタスクを設定します。
すべての特徴量の変換手順が完了したら、レシピに追加をクリックします。 ライブサンプルは、DataRobotがデータソースから新しいサンプルを取得し、操作を適用すると更新され、変換をリアルタイムで確認できます。
ラグ特徴量
ラグとは、発生と影響の間に生じる特定の時間差を指し、時系列データにおける特徴量間の遅延関係を把握するために重要です。 ラグ測定(3、7など)は、データで検出される時間ステップに基づいて実装されます。 ラグは現在の行を基準に計算されます。最初のラグは前の行、2番目のラグは2行前など。 右側の操作パネルでラグ特徴量をクリックし、ラグ設定を行います。
次の表にフィールドを示します。
| フィールド | 説明 |
|---|---|
| 特徴量名 | 特徴量の名前をラグに設定します。 |
| 順序付け特徴量 | 特徴量の変換中にDataRobotが行の並べ替えに使用するプライマリー日付/時刻の特徴量を含む列の名前を選択します。 |
| 系列識別子の列 | 複数系列モデリングが複数の個々の時系列データセットを識別するために使用する列の名前を入力します。 識別子は、各行がどの系列に属するかを示します。 |
| 作成するラグ | 名前付き特徴量に対して作成するラグの順序を表す1つ以上の整数を入力します。 |
ローリング統計の派生
ローリング統計では、指定した数の行で構成されるローリングウィンドウに対して統計量を計算できます。 これらはユーザー定義関数(UDF)として追加され、数値特徴量とカテゴリー特徴量の両方に対して作成できます。 これらのヘルパー関数は2つの場所から設定できます。
操作の出力は以下の通りです。
- 数値: 指定された統計方法に応じて、1つまたは複数の列
- カテゴリー:現在の行を含むウィンドウで計算された1つの列
次の表は、数値ローリング統計とカテゴリーローリング統計の両方のフィールドを示します。
| フィールド | 説明 |
|---|---|
| 特徴量名 | 特徴量の名前の設定 |
| 順序付け特徴量 | 特徴量の変換中にDataRobotが行の並べ替えに使用するプライマリー日付/時刻の特徴量を含む列の名前を選択します。 |
| 系列識別子の列 | 複数系列モデリングが複数の個々の時系列データセットを識別するために使用する列の名前を入力します。 識別子は、各行がどの系列に属するかを示します。 |
| 特徴量派生ウィンドウ(行) | 各ローリングウィンドウに含まれる行数を設定します。 統計は、現在の行を含むウィンドウで計算されます。 |
| 統計手法(数値) | メソッドの設定:平均、中央値、標準偏差、最小、最大 |
| 統計手法(カテゴリー) | このフィールドは最頻値にあらかじめ設定されており、変更することはできません。 |
| ユーザー定義関数の設定 | UDFヘルパー関数(DataRobotで生成またはカスタム)のパスを指定します。 |
UDFの指定
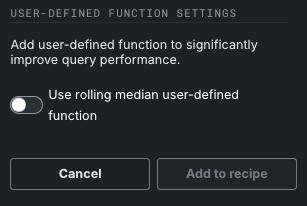
中央値統計(数値特徴量の場合)または最頻値統計(カテゴリー特徴量の場合)を使用する場合、UDFはクエリーのパフォーマンスを向上させるために不可欠であり、DataRobotでは、時系列の操作を行う際にUDFを使用することを推奨しています。 これらは、ウィンドウの作成に追加の結合を必要とせずに、より小さく高速なSQLを生成します。 関数を作成(DataRobotで生成、またはURL経由でリンク)すると、レシピのデータストアに追加されます。 つまり、それらを保存して再利用します。 関数を含むSQLスクリプトは、GitHubで入手できます。 スクリプトには、さまざまなデータベースのローリング中央値と最頻値の統計を計算するUDF/集計が含まれています。
数値またはカテゴリーのローリング統計に関数を追加するには、関数オプションを切り替えます。
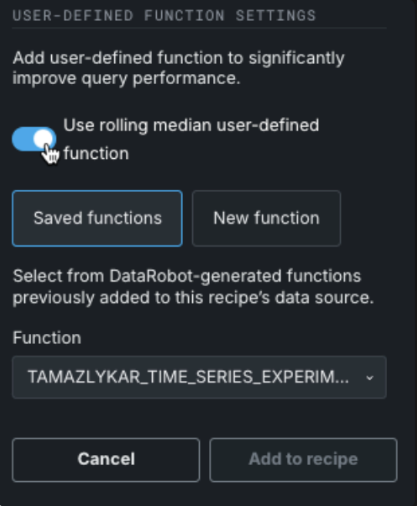
有効にすると、関数の原点を指定するオプションを利用できるようになります。
保存された関数
このレシピのデータソースに以前追加されたDataRobot生成の関数から選択するには、保存された関数を選択します。 保存されている関数がない場合は、新しい関数オプションを使用します。
新しい関数
新しい関数を作成する場合、自動または手動で作成するオプションがあります。
| 方法 | 説明 |
|---|---|
| 自動 | UDFが生成され、レシピのデータソースに追加されます。 |
| 手動 | スキーマデータベースに追加されたカスタム関数のパスを指定します。 関数の例については、GitHubのラングリングヘルパースクリプトを参照してください。 サンプルのUDFを使用するには、スクリプトをローカルにダウンロードし、必要に応じて修正した後、関数のパスフィールドにcatalog.schema.udf_nameの形式で入力します。 |
機能に関する注意事項
-
時間認識ラングリングでは、Snowflake、Databricks、BigQueryの接続のみが一般提供機能です。 Postgresの接続とDataRobotデータレジストリのデータセットは現在プレビュー機能です。
-
出力特徴量の最大数は200です。
-
浮動小数点数は、複数系列の特徴量には使用できません。
-
日付/時刻列の値は、日付、タイムスタンプ、またはタイムゾーンを含むタイムスタンプでなければなりません。
-
連続値エクスペリメント(数値ターゲット)のみがサポートされています。
-
1つの派生プランのみ許可されています。 さらに必要な場合は、プランの出力に特徴量を手動で追加できます。
-
日や分などの時間単位で定義されたウィンドウはサポートされていません。
-
入力データセットのデータ品質の検定はありません。
次のステップ
ここから、次のことができます。
