EDAのインサイト
EDA(探索的データ解析)は、DataRobotでデータセットを解析してその主要な特性のサマリーを作成するためのアプローチです。 EDAにはEDA1とEDA2には2つの段階があります。DataRobotは、データセットが最初にデータレジストリに追加される際には、モデリングの前にEDA1を実行します。EDAの一部として、データのサンプルに基づいてサマリー統計を生成し、すべての特徴量セットを評価して、一般的なデータ品質の問題を検出します。
以下は、1GB未満のデータセットに対するDataRobotモデルの構築プロセスを表しています。
- データセットをDataRobotにインポートし、データレジストリに登録します。
- DataRobotによってEDA1が起動されます(日付型の特徴量が検出された場合は、特徴量の変換が自動的に作成されます)。
- 特徴量探索プロジェクトの場合、DataRobotは以下の処理を行います。
- セカンダリーデータセットをロードします。
- セカンダリーデータセットから特徴量を探索します。
- 探索結果から新しい特徴量を生成します。
- 特徴量探索プロジェクトの場合、DataRobotは以下の処理を行います。
- EDA1が完了すると、データ探索ページの特徴量タブにインサイトが表示されます。
EDA2のインサイトはどこで表示できますか?
EDA2はターゲットを認識するため、データセットを使用してエクスペリメントを設定および実行した後にのみ、インサイトが生成されます。 唯一の例外は、特徴量探索データセットの特徴量の系統インサイトです。
EDA1
DataRobotでは、適用可能な変換または拡張の後、最大500 MBまでのデータセットに対してEDA1が計算されます。 拡張済みのデータセットが500 MB未満の場合、データセット全体が使用されます。500 MB以上の場合は、500 MBのランダムサンプルが使用されます(データセットが500 MB以上の場合は500 MB相当のランダムサンプリングが取得されます)。
EDA1では以下の要素が返されます。
| 分析タイプ | 分析します |
|---|---|
| 自動データスキーマとデータ型 |
|
| データの視覚化 |
|
| データ品質チェック |
インサイトへのアクセス
データの準備は反復プロセスです。 DataRobotにアップロードする前にトレーニングデータをクリーニングして準備したとしても、EDA1の結果として生成されたインサイトを使用して特徴を評価することで、その品質を向上させることができます。これらのインサイトにアクセスするには、
- ユースケースで、登録されているデータセットの右側にあるアクションメニュー をクリックし、探索するを選択して、データ探索ページを開きます。 動的データセットを選択した場合は、データ接続のための資格情報を再認証する必要がある場合があります。
-
左側の特徴量タイルを開きます。
-
パネルが開く特徴量をクリックすると、その特徴量の追加のサマリー指標が上部に表示され、使用可能な各インサイトのタブも表示されます。
使用可能なインサイト
データセットがDataRobotに登録されたら、特徴量の名前をクリックすると、その詳細が表示されます。 使用可能なオプションは特徴量の型に応じて異なります。
| インサイト | 説明 | サポートされているデータ型 |
|---|---|---|
| ヒストグラム | 数値特徴量値を均等なサイズの複数の範囲にバケット化して、特徴量の大まかな分布を示します。 | 数値、集計されたカテゴリー型特徴量、多カテゴリー |
| 頻出値 | 特徴量の最大頻出値に対する個々の値のカウントがプロットされます。 10以上のカテゴリーがある場合、DataRobotにはデータの95%を占める値が表示されます。残りの5%の値は、単一の「その他すべて」カテゴリーに区分けされます。 | 数値、分類、テキスト、ブール型 |
| 表 | 特徴量の値とその発生数の表が表示されます。 表示される値の先頭にスペースが含まれる場合、その旨を示すタグ(先頭にスペース)が表示されます。 これは、特定の同じに見える値がヒストグラムで2回表示される理由を明確にする際に役立ちます(36か月と36か月の両方が表示される場合など)。 | 数値、カテゴリー、テキスト、ブーリアン、集計されたカテゴリー型特徴量、多ラベル |
| 例示 | 集計されたカテゴリーデータ(カテゴリーのコレクションをホストする特徴量)が特徴量としてどのように表されるかを示します。 要約されたカテゴリー別のインサイトの違いも参照してください。 | 集計されたカテゴリー型特徴量 |
| 概要 | 特徴量で最も頻繁に使用される上位50のキーを表示します。 | 集計されたカテゴリー型特徴量 |
| 特徴量の系統 | 特徴量がどのように派生したかを示す視覚的な説明と特徴量の派生プロセスで使用されたデータセットを表示します。 | 特徴量探索データセットのみ |
データ品質評価
EDA1の一環として、DataRobotは一般的なデータ品質の問題を自動的に検出し、それらの多くをユーザーの手間をほとんどかけず、または全くかけずに処理します。 評価は、問題の発見と対処にかかる時間を節約するだけでなく、自動化されたデータ処理に対する透明性を提供します(適用された自動化処理を確認できます)。 これらのチェックは、日付/時刻やターゲット情報を必要としない特徴量に対してのみ実行されることに注意してください(データ品質チェックの完全なリストについては、上の表を参照してください)。
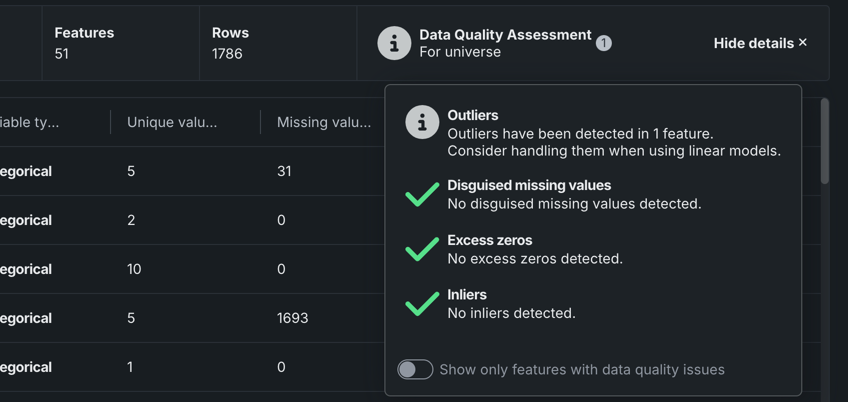
データ品質評価には、データプレビューまたは特徴量タイルのサマリーを表示(まだ開いていない場合、ボタンにはサマリーを表示しないと表示されます)をクリックすることでアクセスできます。
次に、詳細を表示をクリックして詳細なレポートを開きます。
各データ品質チェックは、問題のステータスフラグ、問題の短い説明、および推奨メッセージ(適切な場合)を提供します。
| ステータス | 説明 |
|---|---|
| Warning | 注意または対応が必要です |
| Informational | 対応は不要です |
| Passing | 問題は検出されませんでした |
データ品質チェック
データ品質に問題がないか、個々の特徴量をチェックするには:


