セルの作成と実行
ノートブック内でコード、テキスト、チャートのセルを作成し、実行することができます。 続行する前に、 ノートブック環境の設定と初期化に関するガイドラインを確認してください。
DataRobot APIの使用
DataRobot Notebooks内では、DataRobot APIを簡単に使用できます。 DataRobotが提供する環境イメージには、それぞれのDataRobot PythonクライアントおよびRクライアントがプリインストールされています。 DataRobotは、エンドポイントとAPIトークンを自動的に取得し、ノートブックコンテナ内の環境変数(PythonではDATAROBOT_ENDPOINTおよびDATAROBOT_API_TOKEN、RではDATAROBOT_API_ENDPOINTおよびDATAROBOT_API_TOKEN)として設定し、そのためセッション開始時に手動での認証を必要とせずにクライアントのインスタンス化を自動的に処理します。
DataRobotパッケージをインポートして、Pythonクライアントの使用を開始します。
import datarobot as dr
DataRobotライブラリをインポートして、Rクライアントの使用を開始します。
library(datarobot)
Pythonクライアントのユースケースサポート
ユースケースの一部であるノートブックでDataRobotのコードを実行する場合、デフォルトではユースケースはDataRobotのPythonクライアント用に設定されています。 Pythonクライアント(組み込みノートブック環境にプリインストールされているクライアントバージョン3.2を使用している場合)は、ノートブックがあるユースケースを検出し、それをデフォルトのユースケースとして設定します。 つまり、ユースケースでは、ノートブックからPythonクライアントを使用して作成したプロジェクトやデータセットは、ユースケースのアセットの中に自動的に含まれます。 このデフォルトの動作は、次のいずれかの方法でオーバーライドできます:
datarobot.Client()のインスタンス生成時にdefault_use_caseパラメーターを使用します。- プロジェクトやデータセットを作成する際に、それぞれの作成方法を使用して
use_caseパラメーターを明示的に指定します。
コードセルを作成
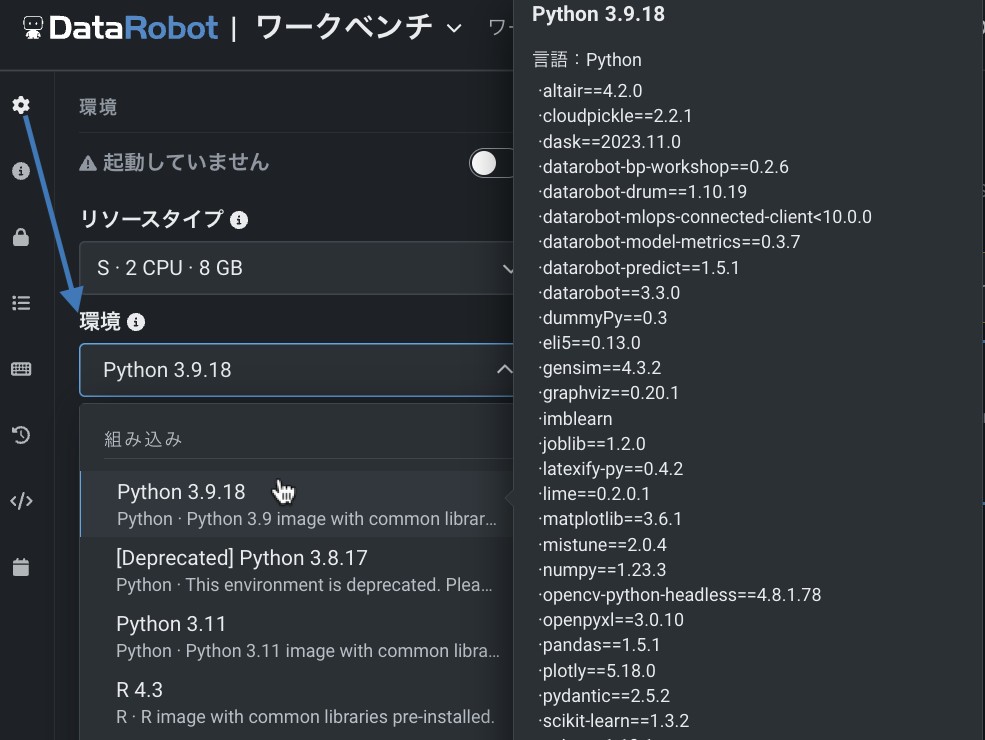
ノートブックのデフォルトイメージは、すべての依存関係と一般的なオープンソースソフトウェア(OSS)ライブラリがプリインストールされた事前に構築済みのPythonイメージです。 デフォルトイメージで利用可能なすべてのパッケージのリストを表示するには、環境タブでそのイメージにカーソルを合わせます。
備考
DataRobotノートブックは多言語対応ではありません。PythonコードまたはRコードを実行しますが、両方が混在することはありません。 サポートされている言語は、ノートブックの環境設定で選択したイメージによって異なります。
ノートブックの環境設定の詳細については、 環境管理を参照してください。
ライブラリを追加
PythonまたはRに追加ライブラリをアドホックにインストールするには、以下の手順に従ってください。
備考
ノートブックはJupyterに似たリッチな出力をサポートするため、プロットライブラリ(matplotlib、seabornなど)を選択して使用し、プロットされたチャートをセル出力内にインラインで表示できます。 Pythonの他のシェルコマンドも、!表記を使用して実行できます。
ノートブックセッションの実行時に、必要な追加パッケージを環境にインストールできます。 ノートブックセルからJupyterのマジックコマンド(!pip install <package-name>など)を使用できます。ただし、セッションがシャットダウンすると、実行時にインストールされたパッケージは保持されません。 次にセッションを再起動するときに、それらを再インストールする必要があります。代わりにcodespaceを使用しても、パッケージのインストールは保持されます。
デフォルトイメージに含まれていないPythonパッケージをインストールして使用するには、コードセル内で以下を実行します。
!pip install <your-package>
環境タブから事前に構築済みのRイメージを選択して、PythonではなくノートブックでR言語を操作できます。 その後、R Kernelを使用してノートブックのコードセルでRコードを記述して実行できます。 追加のRパッケージをインストールして使用するには、コードセルからの devtoolsまたは以下のコードを使用します。
install.packages(<package_name>)
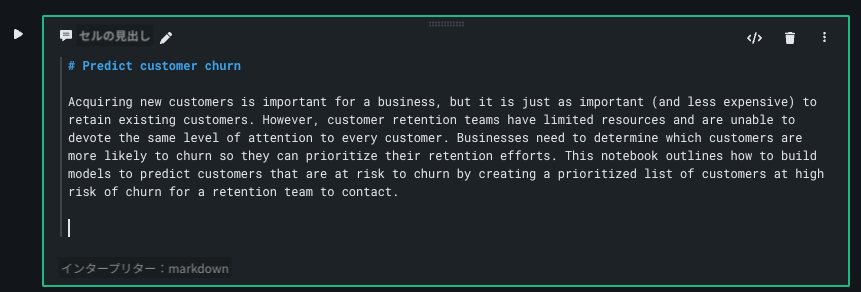
テキストセルを作成
マークダウンテキストセルは、従来のマークダウン構文と GitHub-flavored Markdown構文をサポートしています。 セルを実行して、マークダウンセルのレンダリングをします。 レンダリングされたマークダウンセルを編集するには、セルをダブルクリックします。
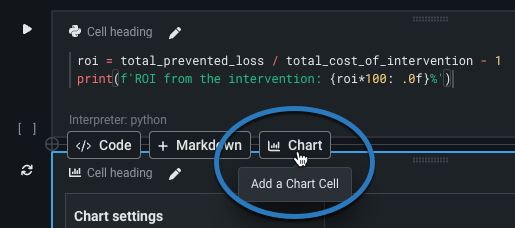
チャートセルの作成
DataRobotは、コードフリーのチャートセルを、DataRobot Notebooks内にビルトインで作成できるため、独自のプロットロジックをコーディングすることなく、データをすばやく視覚化できます。
備考
チャートセルは、Pythonノートブックでのみサポートされていることに注意してください。 Rノートブックでは使用できません。
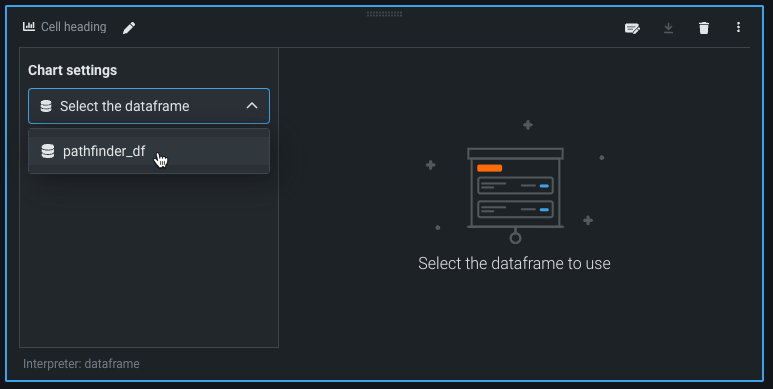
コードセルを追加するには、ノートブック内のセルの外側にカーソルを置き、チャートオプションを選択します。
チャートセルをノートブックに追加する場合、まずデータフレームを選択することで、視覚化するデータを指定する必要があります。 チャートセル内のドロップダウンリストから、DataFrameに対応する変数名を選択します。 セルには、現在インメモリーであるすべてのDataFrameオブジェクトをリストします。
備考
DataRobotでは、DataFrameの最初の5,000行だけをプロットすることに注意してください。
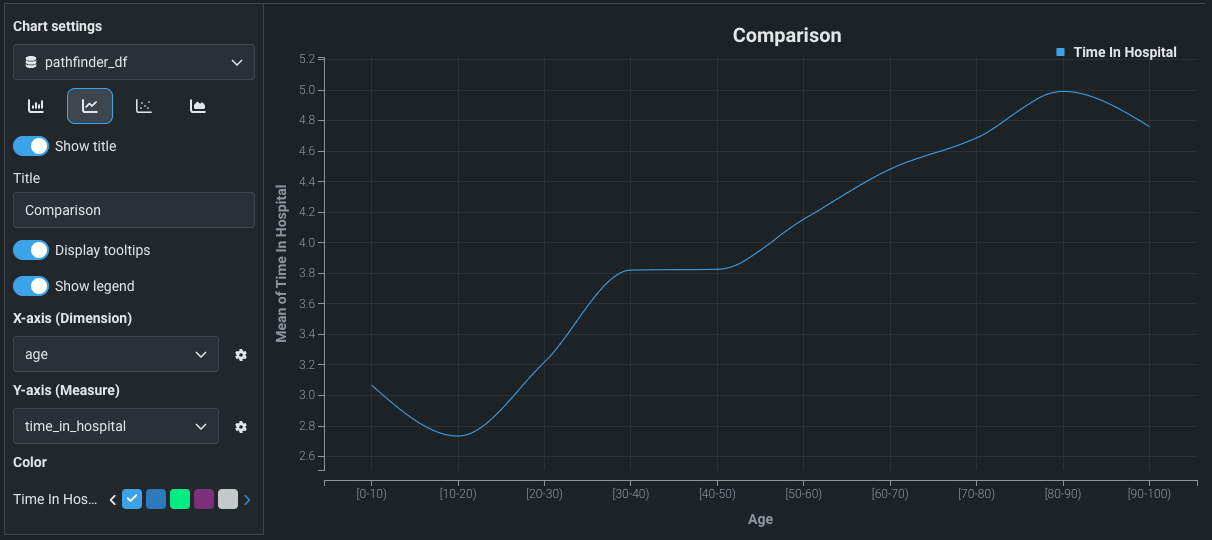
データフレームを選択した後、作成したいチャートのタイプを選択します。 DataRobotは、棒グラフ、折れ線グラフ、散布図、および面グラフの設定を提供します。 それらはすべて、同じ設定フィールドを必要とします(詳細は以下を参照)。
| フィールド | 説明 |
|---|---|
| タイトルを表示 | チャートのタイトルを表示します。 有効にしたら、タイトルの名前を入力します。 |
| ツールチップを表示 | チャートにカーソルを合わせると、データの詳細を含むツールチップを表示します。 |
| 凡例を表示 | 凡例を表示します。 |
| X軸(ディメンション) | X軸としてエンコードする列をDataFrame(ドロップダウンリストとして提供)から選択します。 |
| Y軸(メジャー) | Y軸としてエンコードする列をDataFrame(ドロップダウンリストとして提供)から選択します。 |
| 色 | チャート内容の色を選択します。 |
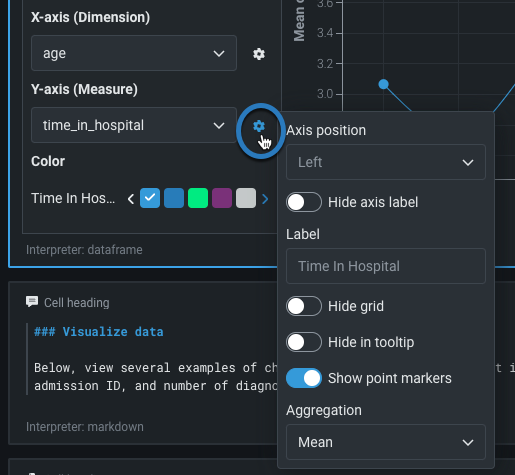
上記設定に加えて、各フィールドの横にある設定ホイールを選択することで、X軸とY軸の側面を変更できます。
| トグル | 説明 |
|---|---|
| 軸ラベルを非表示にする | 軸のラベルがチャートに表示されないようにします。 |
| グリッドを非表示にする | チャートの背景にあるグリッドパターンを削除します。 |
| ツールチップで非表示にする | チャートのポイントにカーソルを合わせると表示されるツールチップの軸の値が非表示になります。 |
| ポイントマーカーを表示 | チャート内の軸で、ポイントに沿ってポイントマーカーを表示します。 |
| 集約 | 軸の値を集計するかどうかを設定します。 中央値、平均、合計、標準偏差など、さまざまな値で集計できます。 |
チャートを設定したら、右上のアイコンを使ってセルの表示方法を編集できます。
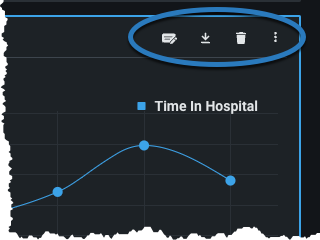
- 鉛筆アイコンを選択すると、チャートセルのエディターメニューが非表示になります。
- ダウンロードアイコンをクリックすると、チャートのローカルコピーをSVGファイルとして保存できます。
- ゴミ箱アイコンを選択すると、チャートセルが削除されます。
- メニューアイコンをクリックして、セルで使用できる アクションにアクセスします。
目次
セルを作成して実行してノートブックを作成すると、DataRobotは目次を自動的に生成し、ナビゲーションが容易になります。 アクセスするには、サイドバーの目次アイコン(![]() )をクリックします。
)をクリックします。
マークダウンタブには、自動生成された目次が表示されます。 各エントリーは、ノートブック内のマークダウンセルの見出しにマッピングされ、マークダウンの見出しレベル(#、##、###など)に対応します。 エントリーにはハイパーリンクが設定されているため、エントリーをクリックするとノートブック内の対応するセルに移動します。
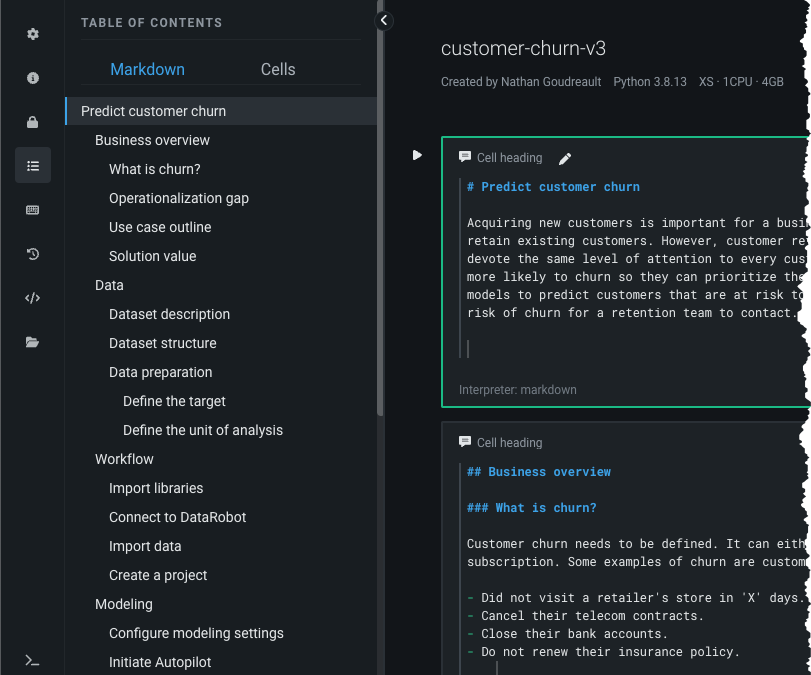
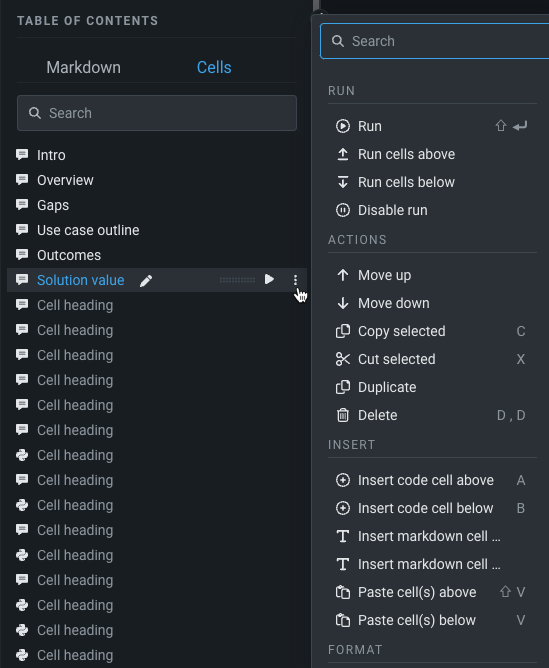
セルタブには、ノートブック内のすべてのセル(コードセルとマークダウンセルの両方)の概要が表示されます。 目次内のセルリストから セルアクションを実行(およびドラッグアンドドロップでセルを移動)できます。
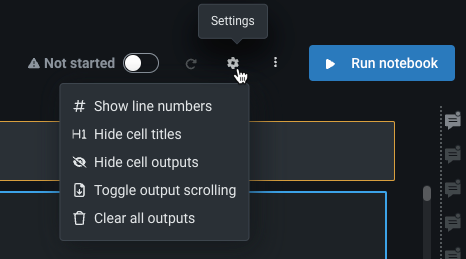
セル設定
ノートブック全体のセル設定は、ノートブックヘッダーの右上にある歯車アイコンメニューにアクセスして設定できます。
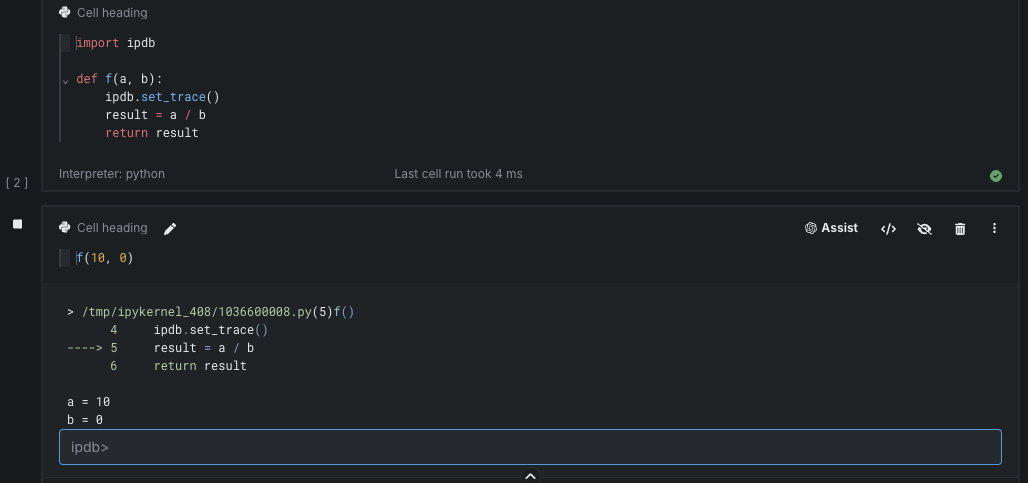
デバッグコード
DataRobot Notebooksには、Pythonデバッガー(pdb)とIPythonデバッガー(ipdb)が組み込まれており、Pythonコードを対話的にデバッグできます。 ipdbはpdbと同じデバッグインターフェイスを使いますが、シンタックスハイライトなどの追加機能があります。
ノートブックで一般的なデバッグ方法の1つは、コードを実行する前にデバッガーをアクティブにすることです。 これを行うには、ipdbをインポートし、ipdb.set_trace()を使ってブレークポイントを設定します(pdbを使ってこれを行うこともできます)。 set_trace()を含むセルを実行すると、セル出力で対話型デバッガーが起動します。 その後、入力フィールドで n(ext)、s(tep)、c(ontinue)、pなどのサポートされているデバッガーコマンドを使用して、コードを1行ずつ実行し、変数を詳しく調べることができます。
コードをデバッグする際、デバッガーをアクティブにしたセルでは、ノートブックのコード実行がブロックされることに注意してください。 セルの実行を終了するにはc(ontinue)を、他のセルを実行する前にデバッガーを終了するにはq(uit)を使用します。
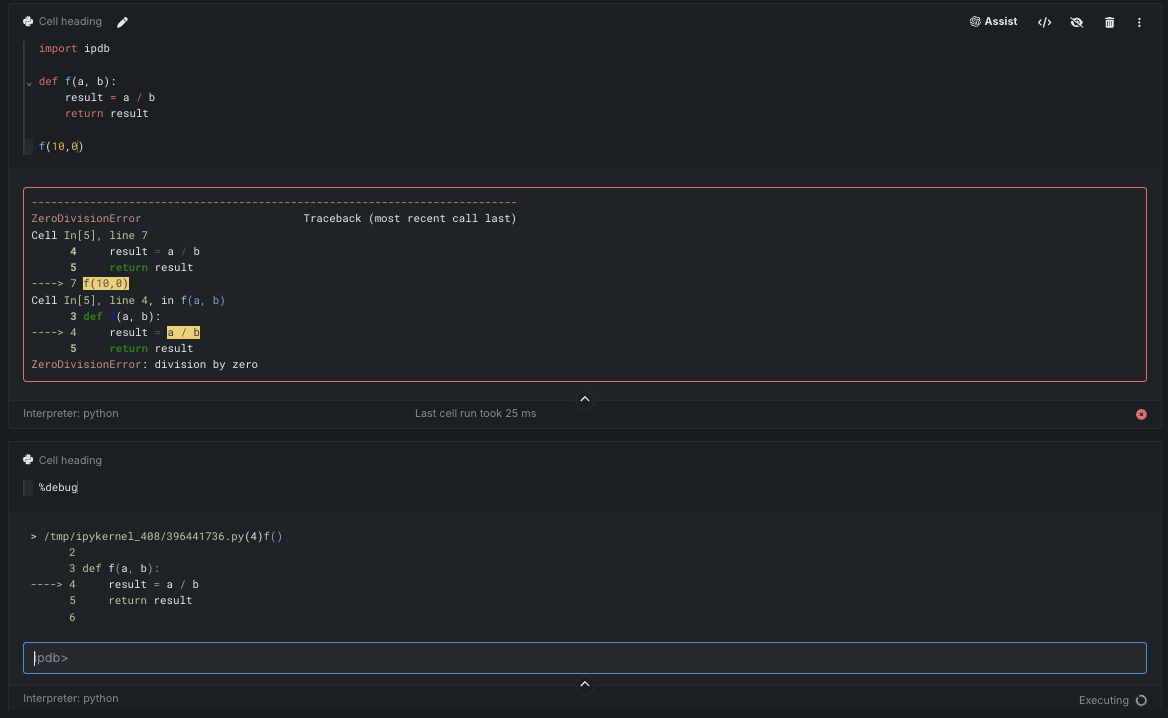
DataRobotでは、実行されたコードで例外が発生した後にデバッガーを起動したい場合のために、遡及的デバッグモードもサポートしています。 エラーが原因でコードが失敗した場合は、新しいセルから%debug magicを実行して、最後の例外のコンテキストから対話型デバッガーを起動します。 この機能を使えば、バックトラック、明示的なブレークポイントの設定、およびコードの再実行によって対話型デバッガーを起動することなく、コードをデバッグできます。
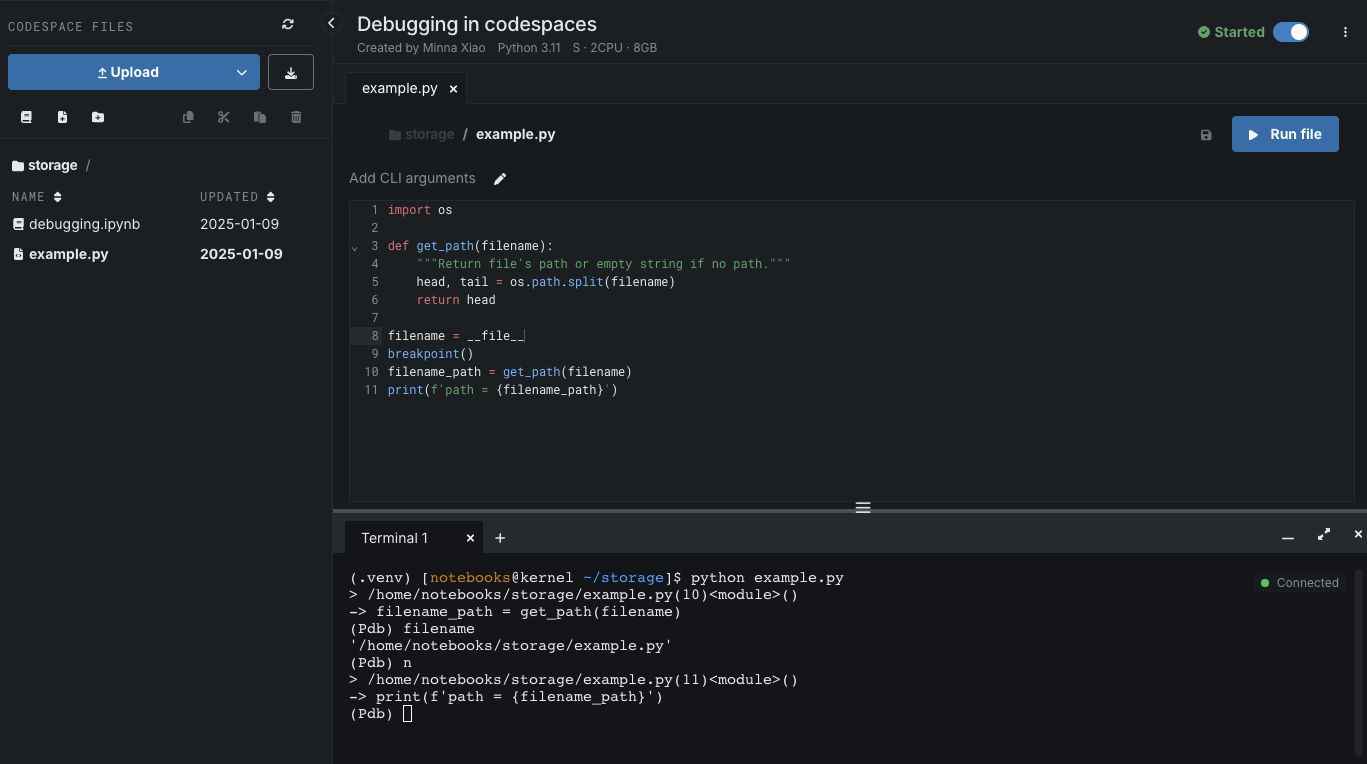
Codespaceでのデバッグ
連携されたターミナルからpdbを使用して、codespace内のPythonスクリプトをデバッグできます。 .pyファイル内で、Python 3.7で導入された組み込みのbreakpoint()関数を使用して、ブレークポイントを設定できます(または、pdbをインポートしてpdb.set_trace()を使用します)。 ターミナルセッションを開き、コマンドラインからスクリプトを実行します。 これにより対話型デバッガーが起動し、(Pdb)プロンプトで`pdbコマンドを使用できるようになります。