カスタム指標
デプロイのモニタリング > カスタム指標タブでは、 データ探索タブから収集するデータ(または他のカスタム指標を介して計算されたデータ)を使用して、カスタムビジネス指標またはパフォーマンス指標を計算して監視できます。 テキスト生成やエージェントワークフローのデプロイに対して評価およびモデレーションのガードレール(NeMo Evaluatorの指標を含む)を設定すると、各ガードからこのタブに指標(ガードのレイテンシー、プロンプトや回答の平均スコア、ガードごとのブロック数など)が報告されます。これにより、ガードの動作を長期的に監視およびデバッグできます。 これらの指標は、変更可能なカスタム指標のサマリーダッシュボードに記録され、そこで各指標の経時変化を監視、視覚化、およびエクスポートします。 この機能により、組織固有の指標を実装して、DataRobotに組み込まれているサービスの正常性、データドリフト、精度の各指標によって提供されるインサイトを拡張できます。
カスタム指標数の上限
デプロイごとに最大50個のカスタム指標を設定でき、その50個のうち5個をホストされたカスタム指標にすることができます。
カスタム指標を表示して追加するには、コンソールでカスタム指標を作成するデプロイを開き、モニタリング > カスタム指標タブをクリックします。
どのようなカスタム指標がサポートされていますか?
3つのタイプのカスタム指標を使用できます。
| カスタム指標の種類 | 説明 |
|---|---|
| 外部カスタム指標 |
|
| ホストされたカスタム指標 |
|
| ホストされたカスタム指標テンプレート |
|
カスタム指標を追加
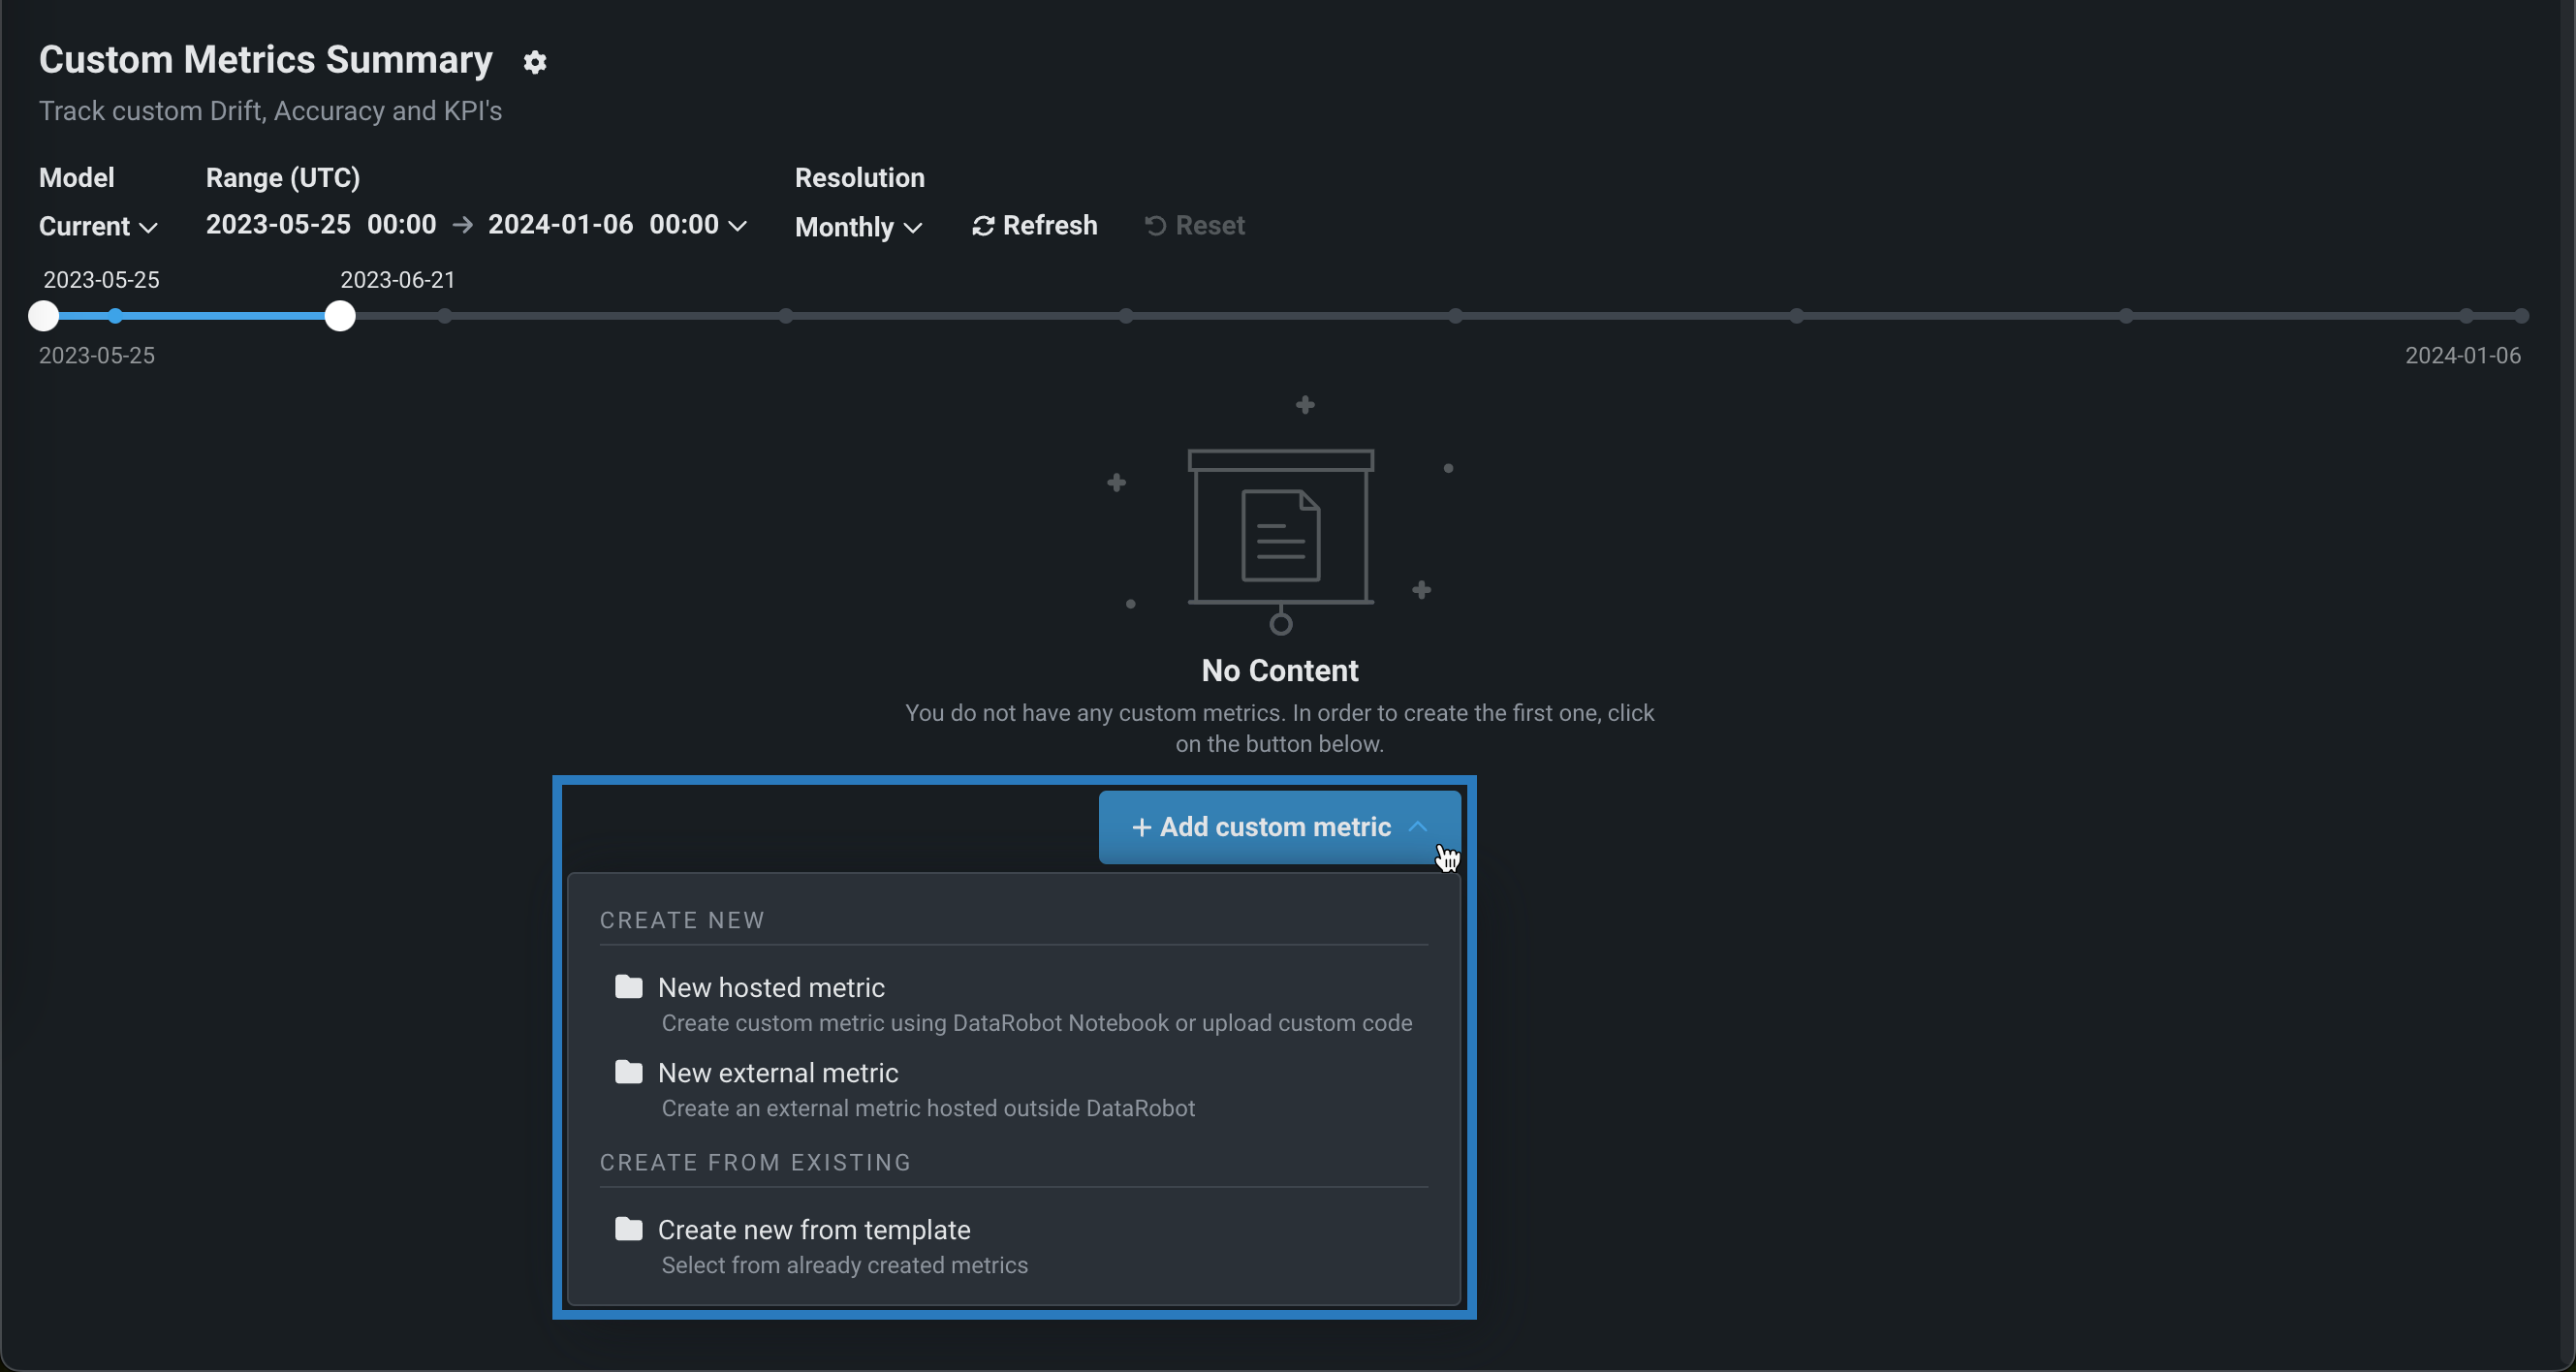
指標を追加するには、予測モデルデプロイまたは生成モデルデプロイで、モニタリング > カスタム指標タブをクリックします。 次に、カスタム指標タブで、+ カスタム指標を追加をクリックし、次のカスタム指標タイプのいずれかを選択して、テーブルでリンクされている設定ステップに進みます。
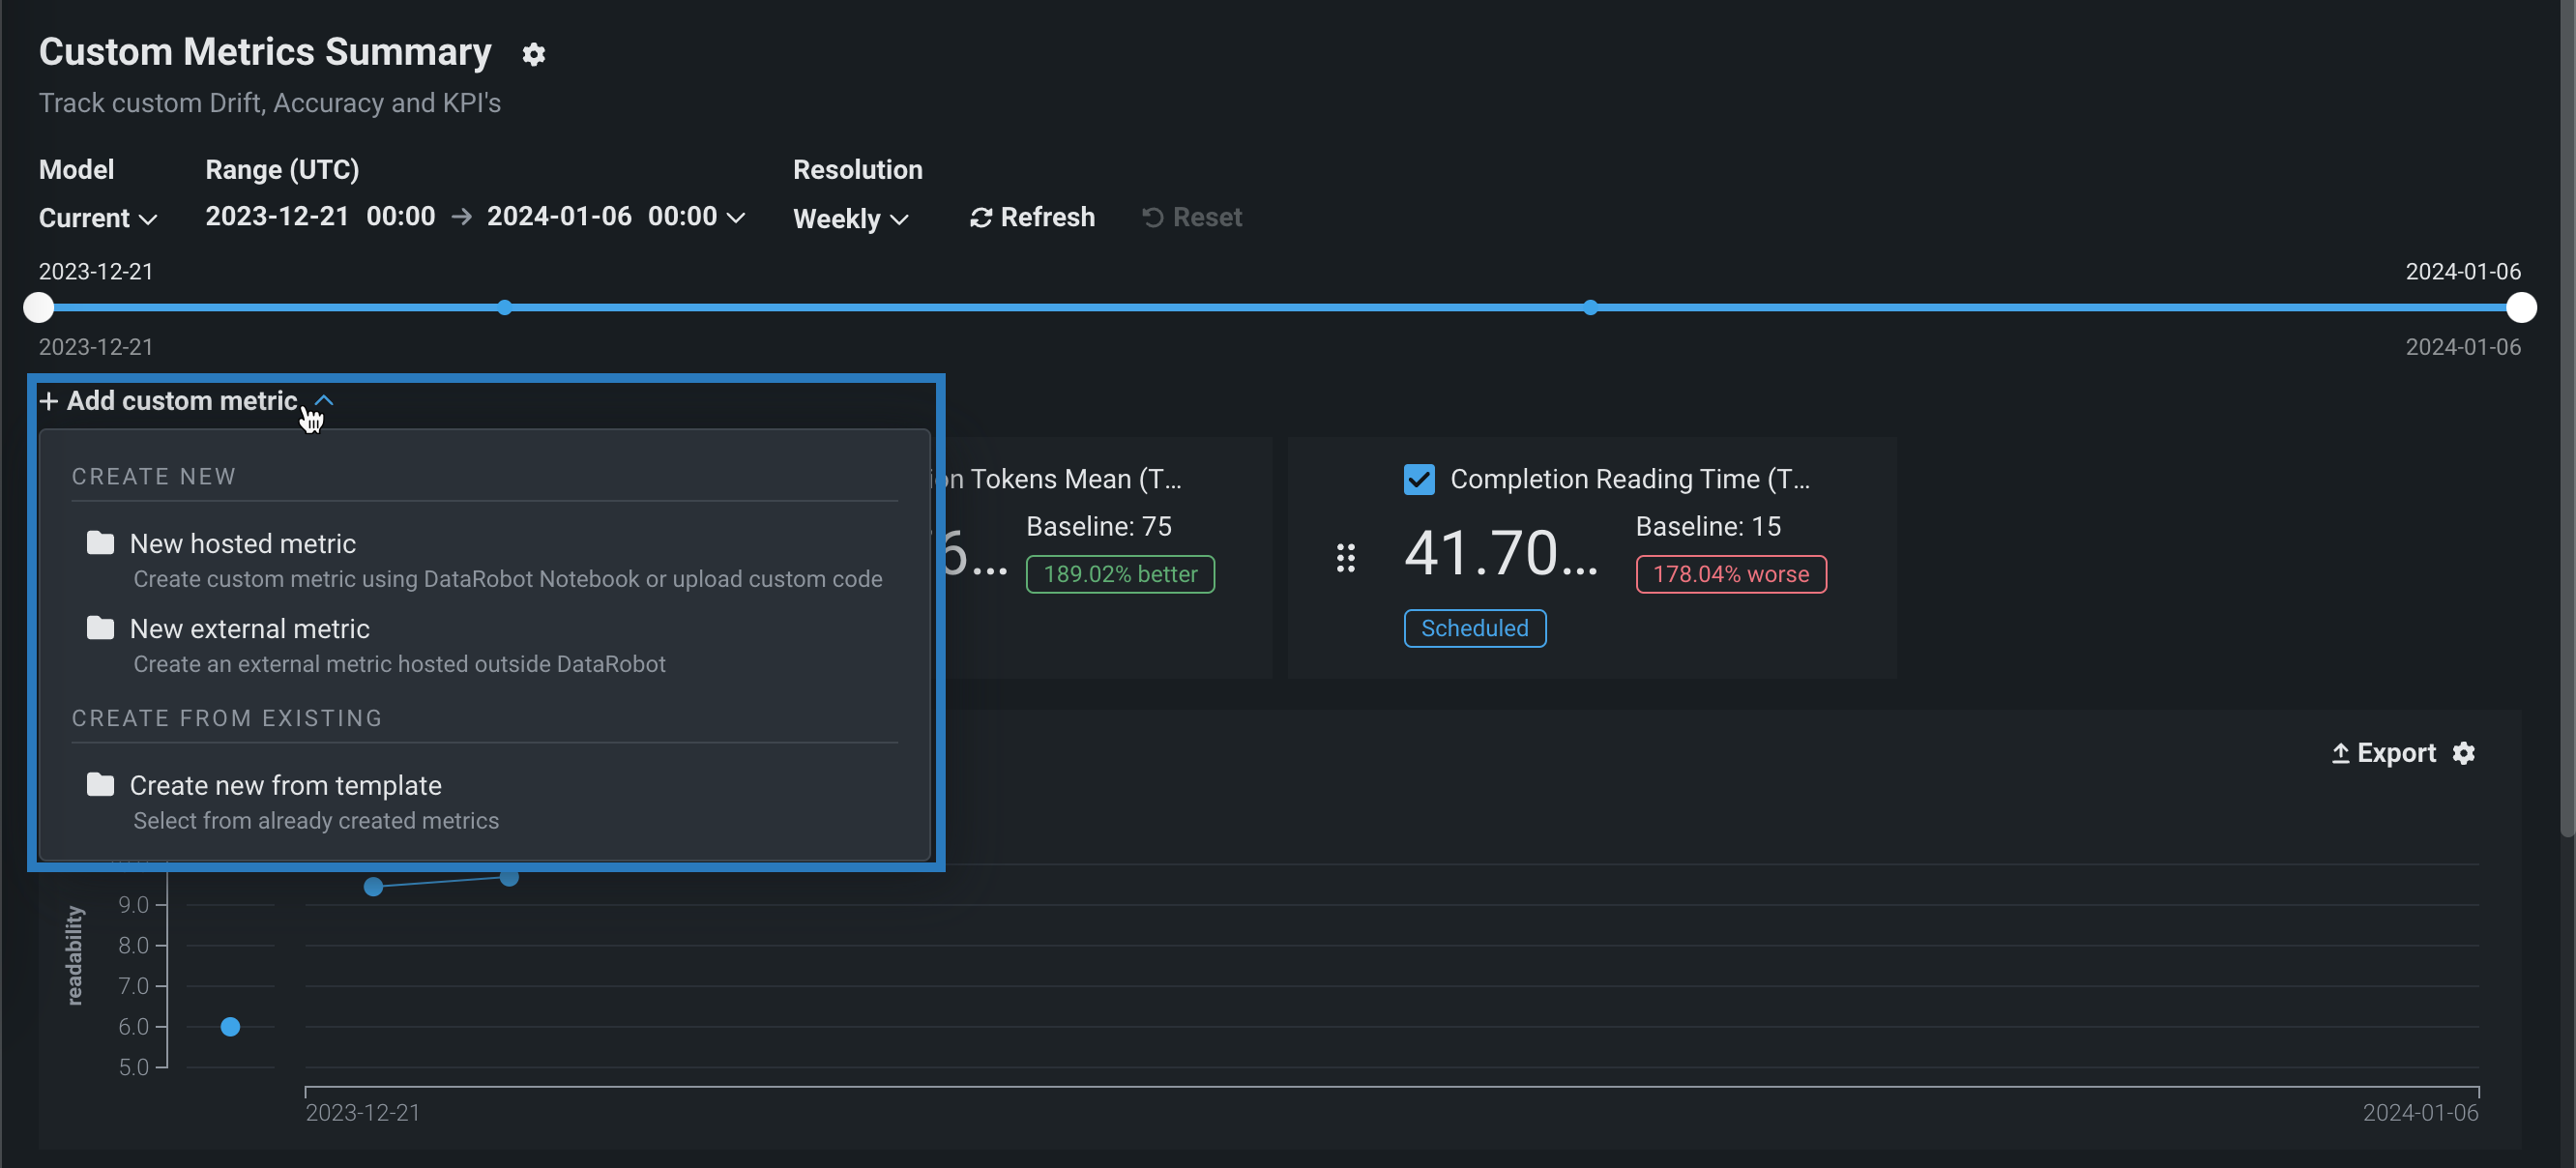
| カスタム指標の種類 | 説明 |
|---|---|
| 新しい外部指標 | 指標の計算がDataRobotによって直接ホストされないカスタム指標を追加します。 外部指標は、DataRobotが保存および視覚化するための指標値を送信するために使用されるシンプルなAPIです。 指標の計算は、ユーザーが外部で処理します。 外部指標は、ノートブック、ジョブ、カスタムモデルなどのDataRobotの他のツール、Airflowなどの外部ツール、またはクラウドプロバイダーと組み合わせて、特定の指標に必要なホスティングと計算を提供できます。 外部カスタム指標は、DataRobotで追跡および視覚化するためにAIソリューションから値を保存するシンプルなオプションを提供します。 たとえば、LLMプロバイダーによって計算されたLLMコストの経時変化を追跡できます。 |
| 新しいホストされた指標 | 指標計算がDataRobot内のカスタムジョブでホストされるカスタム指標を追加します。 ホストされた指標の場合、DataRobotはデータのプル、指標値の計算、値をストレージに保存、およびデータの視覚化を調整します。 外部ツールまたはインフラストラクチャは必要ありません。 ホストされたカスタム指標は、DataRobotでビジネス固有の指標とダッシュボードを構築するための完全なエンドツーエンドワークフローを提供します。 |
| テンプレートから新規作成 | テンプレートからカスタム指標、またはDataRobotがコードを提供し作成プロセスを自動化するホストされたカスタム指標のすぐに使用できる例を追加します。 指標テンプレートを使用すると、最初から開始することなく、ホストされた指標が生成されます。 テンプレートはDataRobotによって提供され、そのまま使用したり、変更して新しい指標を計算したりできます。 ホストされたカスタム指標テンプレートは、DataRobotが実装例と完全なエンドツーエンドワークフローを提供するカスタム指標を開始する最も簡単な方法を提供します。 数回のクリックで使用できます。 |
外部カスタム指標の追加
外部カスタム指標を使用すると、DataRobotの外部で計算が行われる指標を作成できます。 外部指標を使用すると、DataRobotに保存および視覚化する指標値を送信できます。 外部指標は、ノートブック、ジョブ、カスタムモデルなどのDataRobotの他のツール、Airflowなどの外部ツール、またはクラウドプロバイダーと組み合わせて、特定の指標に必要なホスティングと計算を提供できます。
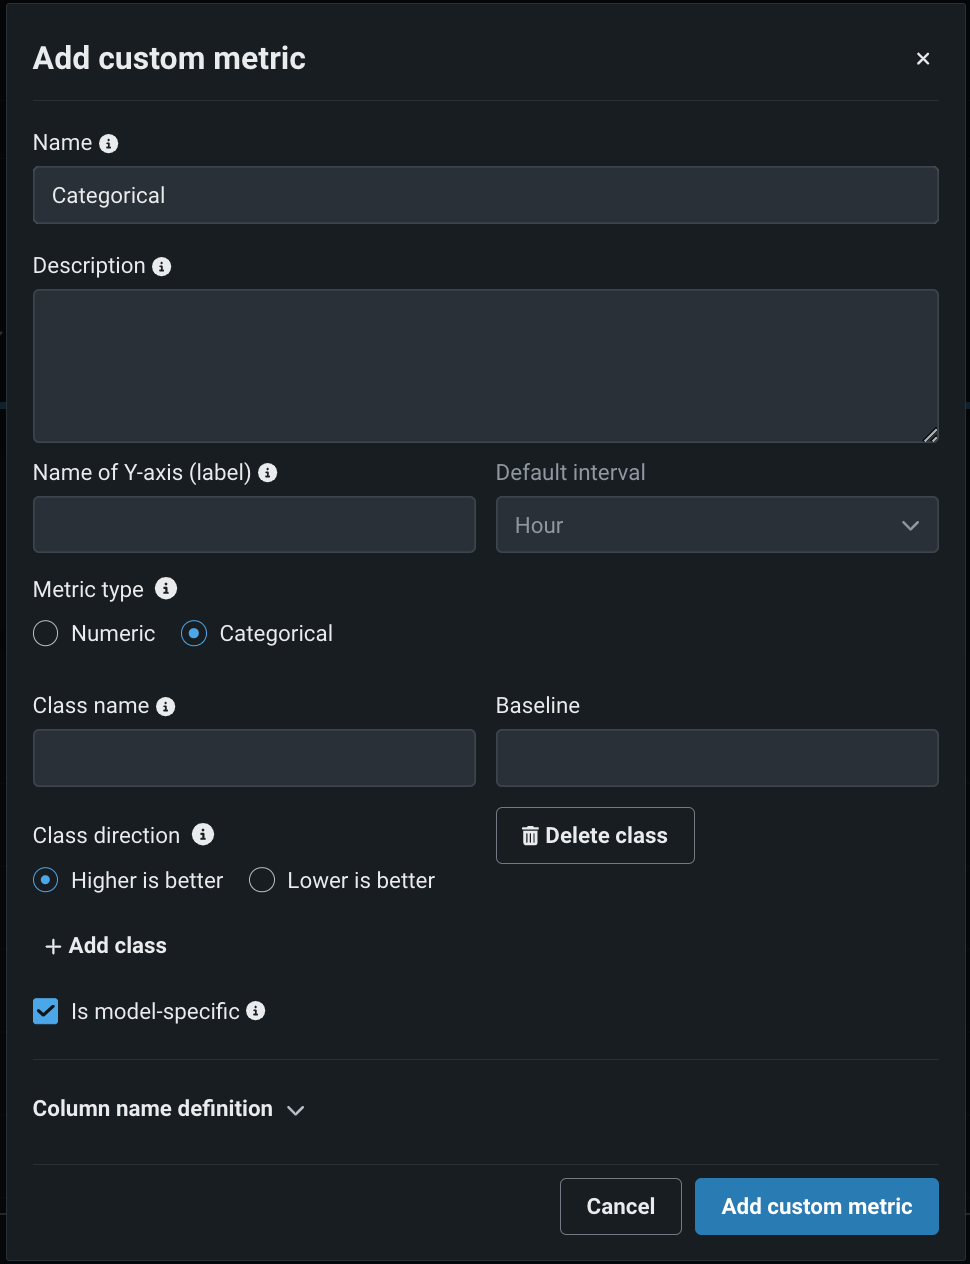
外部カスタム指標を追加するには、カスタム指標を追加ダイアログボックスで指標の設定を行い、カスタム指標を追加をクリックします。
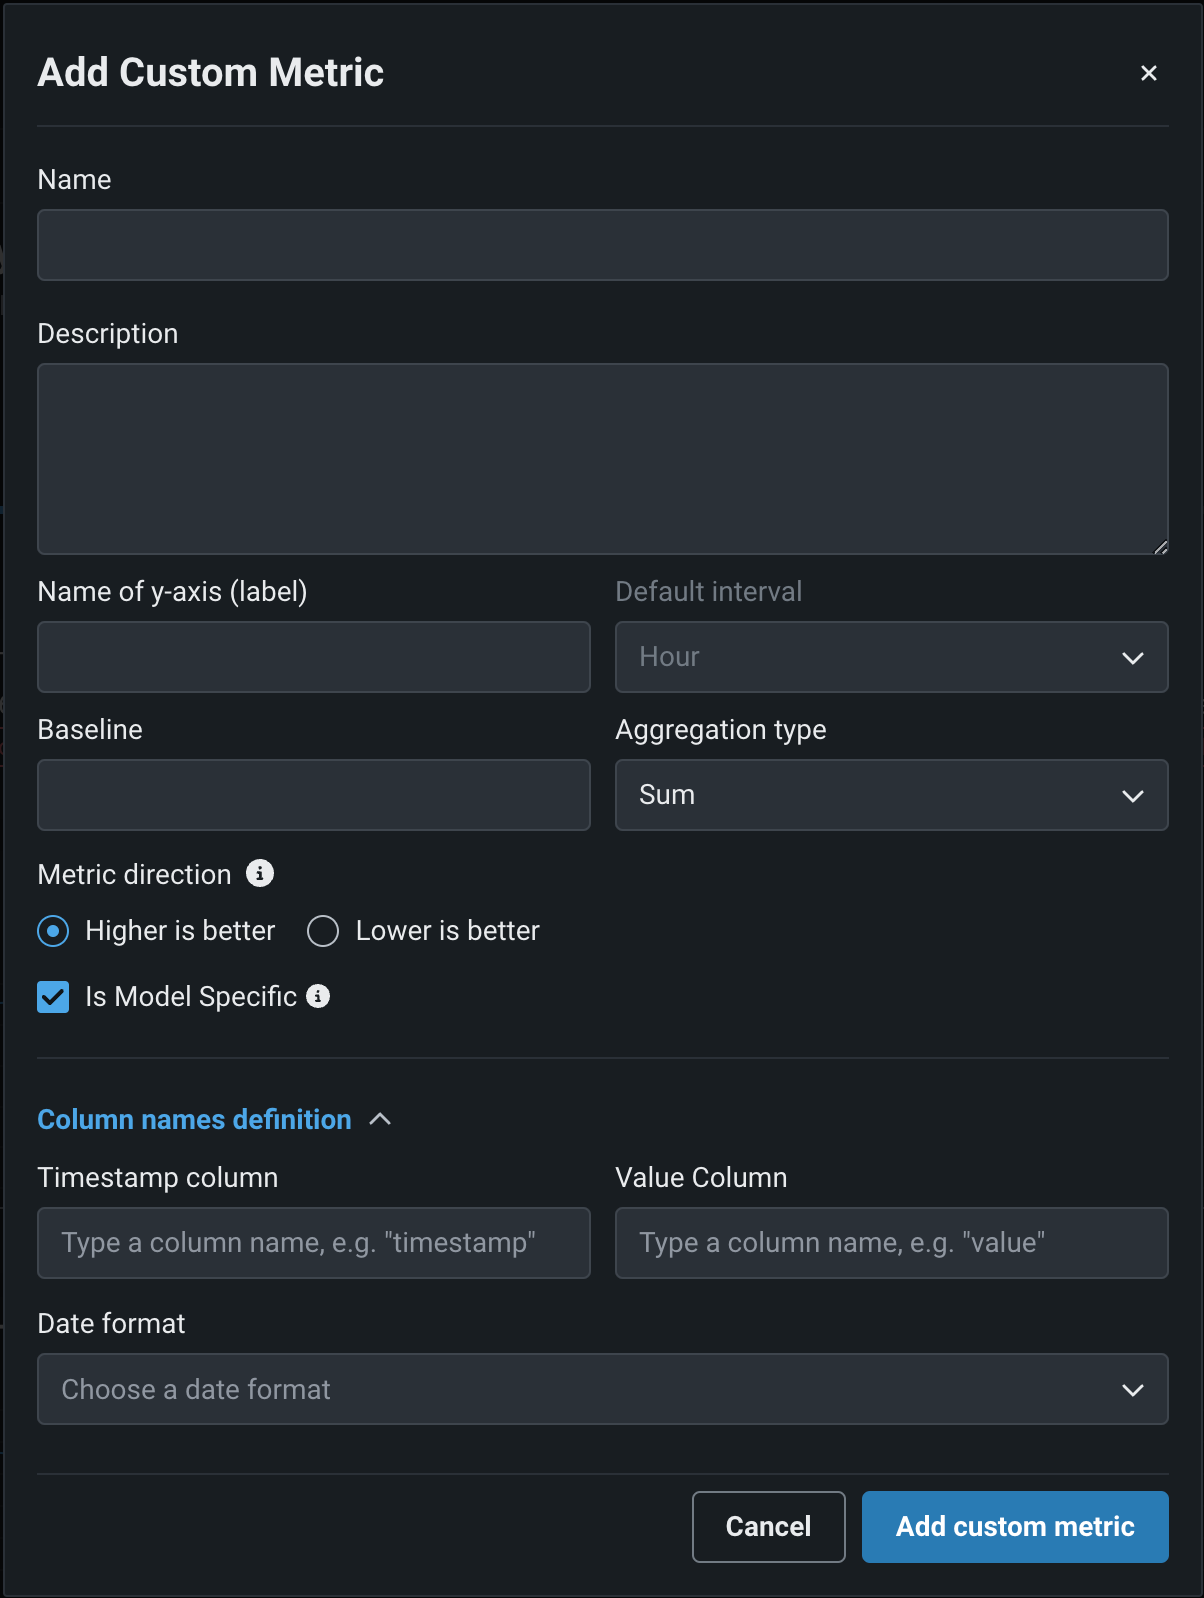
| フィールド | 説明 |
|---|---|
| 名前 | 指標のわかりやすい名前。 この名前は、カスタム指標のサマリーダッシュボードに表示されます。 |
| 説明 | (オプション)カスタム指標の説明。たとえば、目的、計算方法などを説明することができます。 |
| Y軸の名前(ラベル) | 従属変数のわかりやすい名前。 この名前は、カスタム指標のサマリーダッシュボードのカスタム指標のチャートに表示されます。 |
| デフォルトの間隔 | 選択した集計タイプで使用されるデフォルトの間隔。 時間のみサポートされています。 |
| 指標の種類 | 作成する指標のタイプ、数値またはカテゴリー 利用可能な指標設定は、この選択に基づいて変更されます。 |
| 数値指標の設定 | |
| ベースライン | (オプション)x%良い値またはx%悪い値を計算するときに比較の基準として使用する値。 |
| 集計タイプ | 指標計算のタイプ。 単一の時点で測定された個別の値を持つ指標を、合計、平均、またはゲージから選択します。 |
| 指標の方向性 | 指標の方向性:指標の変化をどのように視覚化するかを制御します。 大きいほど良いまたは低いほど良いを選択できます。 たとえば、低いほど良いを選択すると、カスタム指標の計算値が10%減少することが、10%改善とみなされ、緑色で表示されます。 |
| カテゴリー指標の設定 | |
| クラス名 | 追加された各クラスについて、わかりやすい名前(最大200文字) |
| ベースライン | (オプション) 追加された各クラスについて、x%良いまたはx%悪い値を計算する際に比較の基準となる値 |
| クラスの方向 | 追加された各クラスについて、指標の変化がどのように視覚化されるかを制御する指標の方向性 大きいほど良いまたは低いほど良いを選択できます。 たとえば、低いほど良いを選択すると、カスタム指標の計算値が10%減少することが、10%改善とみなされ、緑色で表示されます。 |
| +クラスを追加 | カテゴリー指標に必要な各クラスを定義するには、+ クラスを追加をクリックし、上記の必要なクラス設定を行います。 最大10クラスまで追加できます。 クラスを削除するには、 クラスを削除をクリックします。 |
| モデル固有の集計設定 | |
| モデル固有のものです | この設定を有効にすると、データセットで提供されたモデルパッケージID(登録されているモデルバージョンID)を使用して、指標をモデルにリンクします。 この設定は、値が集計(またはアップロード)される場合に影響します。 例:
|
| 地理空間 | カスタム指標で地理空間データを使用するかどうかを決定します。 有効にした場合、地理空間セグメント属性を選択します。 デプロイには、少なくとも1つの地理空間/位置特徴量が必要です。 |
| 標準デプロイでの列名の定義 | |
| タイムスタンプ列 | タイムスタンプを含むデータセット内の列。 |
| 値列 | カスタム指標の計算に使用される値を含むデータセット内の列。 |
| 日付形式 | (オプション)タイムスタンプ列で使用される日付形式。 |
| バッチデプロイでの列名の定義 | |
| バッチ列 | データセット内の列で、各バッチのバッチID(バッチ名ではありません)が含まれているもの。 許容最大長は100文字です。 |
| 値列 | カスタム指標の計算に使用される値を含むデータセット内の列。 フィールドの最大長は100文字です |
プレミアム機能
地理空間の監視はプレミアム機能です。 この機能を有効にする方法については、DataRobotの担当者または管理者にお問い合わせください。
地理空間特徴量の監視サポート
地理空間特徴量の監視は、二値分類、多クラス、連続値、位置のターゲットタイプでサポートされています。
備考
カスタム指標にデータをアップロードするときに、列名の定義設定をオーバーライドできます。
ホストされたカスタム指標の追加
ホストされたカスタム指標を使用すると、デプロイに組織の特殊な指標を最大5つ実装し、 DataRobot Notebooksを使用してカスタム指標コードをアップロードし、カスタムジョブインフラストラクチャで指標計算をホストできます。 作成後、これらのカスタム指標は、他のデプロイで再利用できます。
カスタム指標数の上限
デプロイごとに最大50個のカスタム指標を設定でき、その50個のうち5個をホストされたカスタム指標にすることができます。
時系列のサポート
DataRobotモデル指標(DMM)ライブラリは、時系列モデル、特に時系列モデルの データエクスポートをサポートしていません。 データのエクスポートと取得には、 DataRobot APIクライアントを使用します。
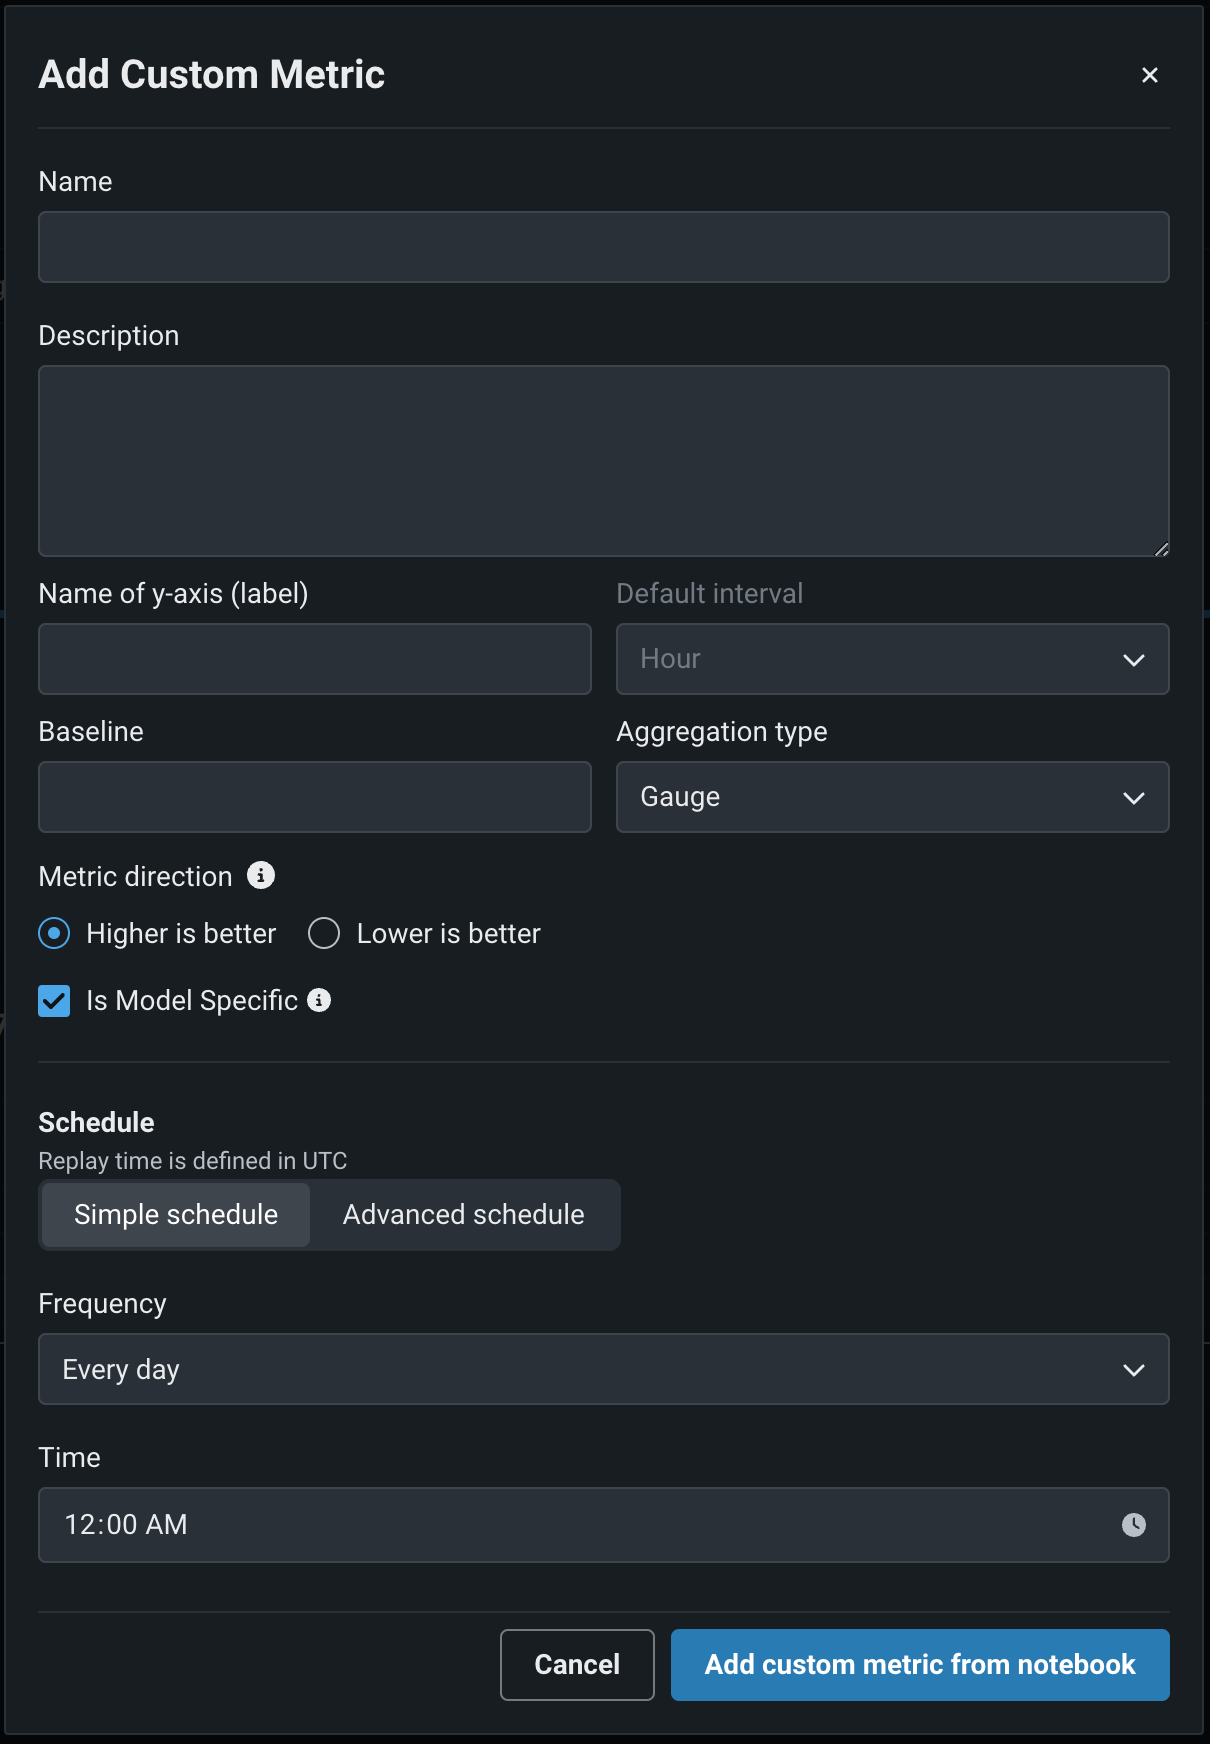
カスタム指標を追加ダイアログボックスで、ホストされたカスタム指標を追加するには、指標を設定し、ノートブックからカスタム指標を追加をクリックします。
| フィールド | 説明 |
|---|---|
| 名前 | (必須)指標のわかりやすい名前。 この名前は、カスタム指標のサマリーダッシュボードに表示されます。 |
| 説明 | カスタム指標の説明。たとえば、目的、計算方法などを説明することができます。 |
| Y軸の名前(ラベル) | (必須)従属変数のわかりやすい名前。 この名前は、カスタム指標のサマリーダッシュボードのカスタム指標のチャートに表示されます。 |
| デフォルトの間隔 | 選択した集計タイプで使用されるデフォルトの間隔を決定します。 時間のみサポートされています。 |
| ベースライン | x%良い値またはx%悪い値を計算するときに比較の基準として使用する値を決定します。 |
| 集計タイプ | 指標を合計、平均、またはゲージ(単一時点で測定された明確な値を持つ指標)として計算するかどうかを決定します。 |
| 指標の方向性 | 指標の方向性を決定し、指標の変更を視覚化する方法を変更します。 大きいほど良いまたは低いほど良いを選択できます。 たとえば、低いほど良いを選択すると、カスタム指標の計算値が10%減少することが、10%改善とみなされ、緑色で表示されます。 |
| モデル固有のものです | この設定を有効にすると、データセットで提供されたモデルパッケージID(登録されているモデルバージョンID)を使用して、指標をモデルにリンクします。 この設定は、値が集計(またはアップロード)される場合に影響します。 以下に例を示します。
|
| 地理空間 | カスタム指標で地理空間データを使用するかどうかを決定します。 有効にした場合、地理空間セグメント属性を選択します。 デプロイには、少なくとも1つの地理空間/位置特徴量が必要です。 |
| スケジュール | カスタム指標に値が入力されるタイミングを定義します。 頻度(1時間ごと、1日ごと、1か月ごとなど)と時間を選択します。 詳細なスケジューリングオプションを使用するには、高度なスケジューラーを使用するを選択します。 |
プレミアム機能
地理空間の監視はプレミアム機能です。 この機能を有効にする方法については、DataRobotの担当者または管理者にお問い合わせください。
地理空間特徴量の監視サポート
地理空間特徴量の監視は、二値分類、多クラス、連続値、位置のターゲットタイプでサポートされています。
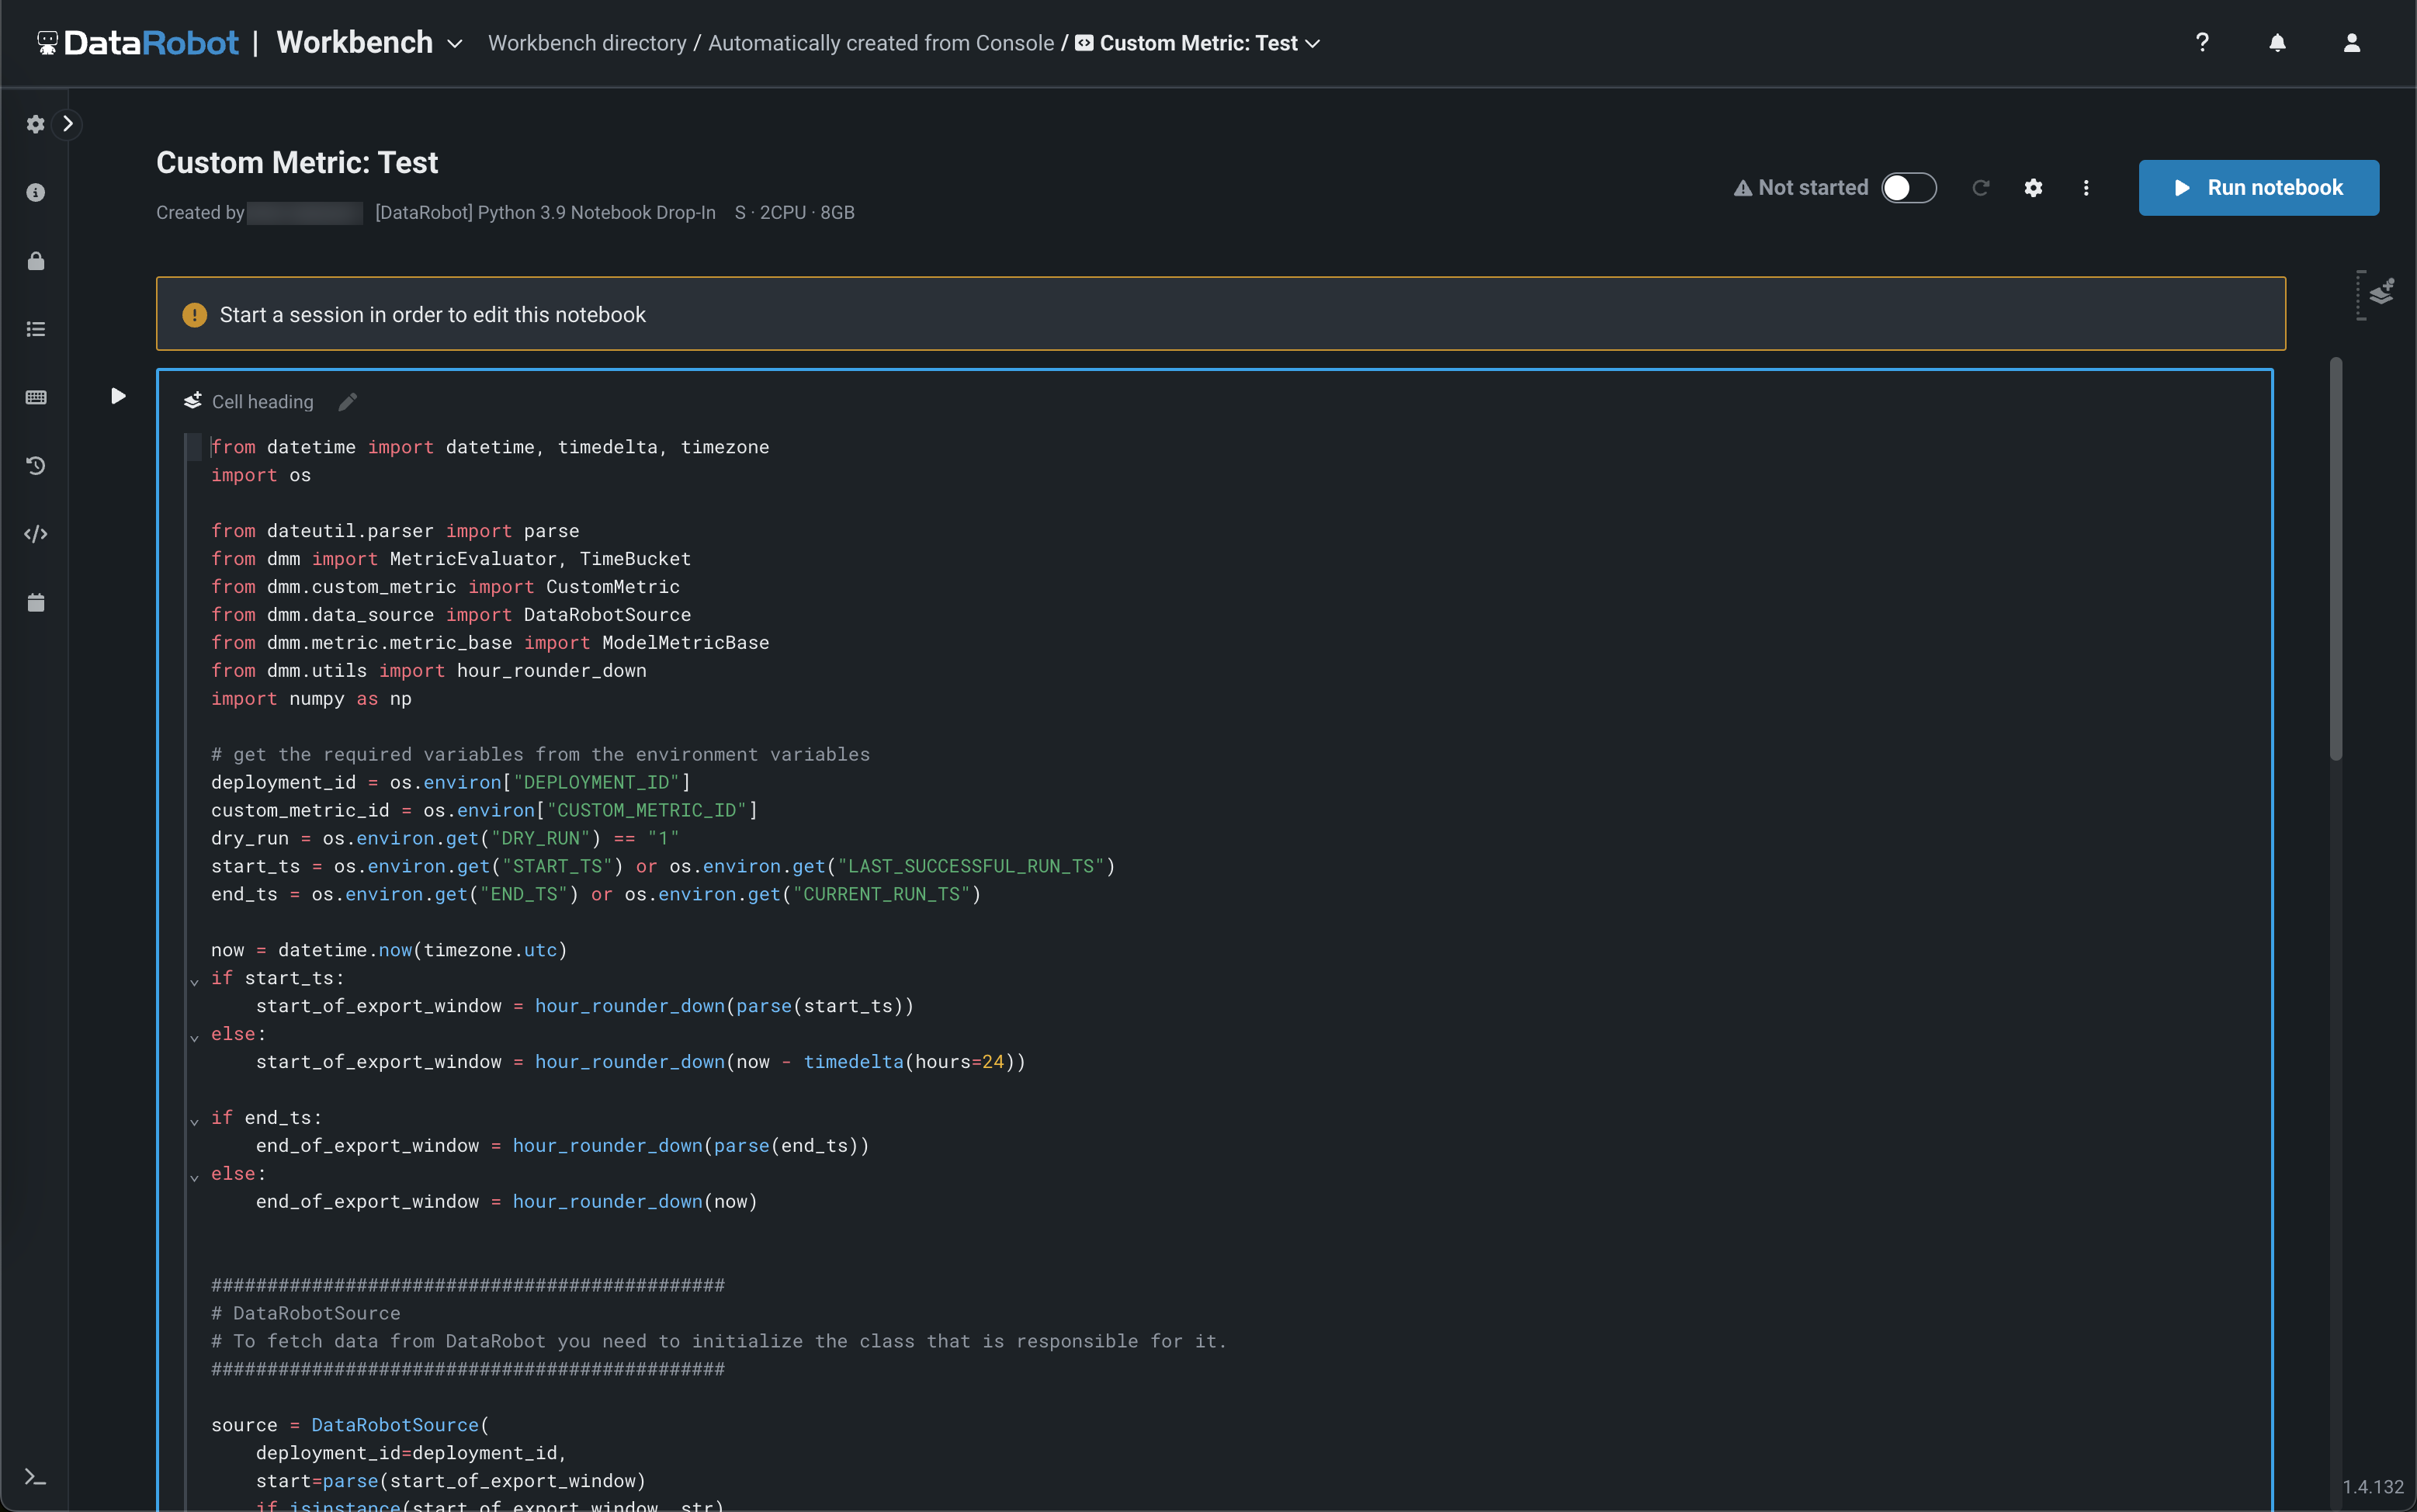
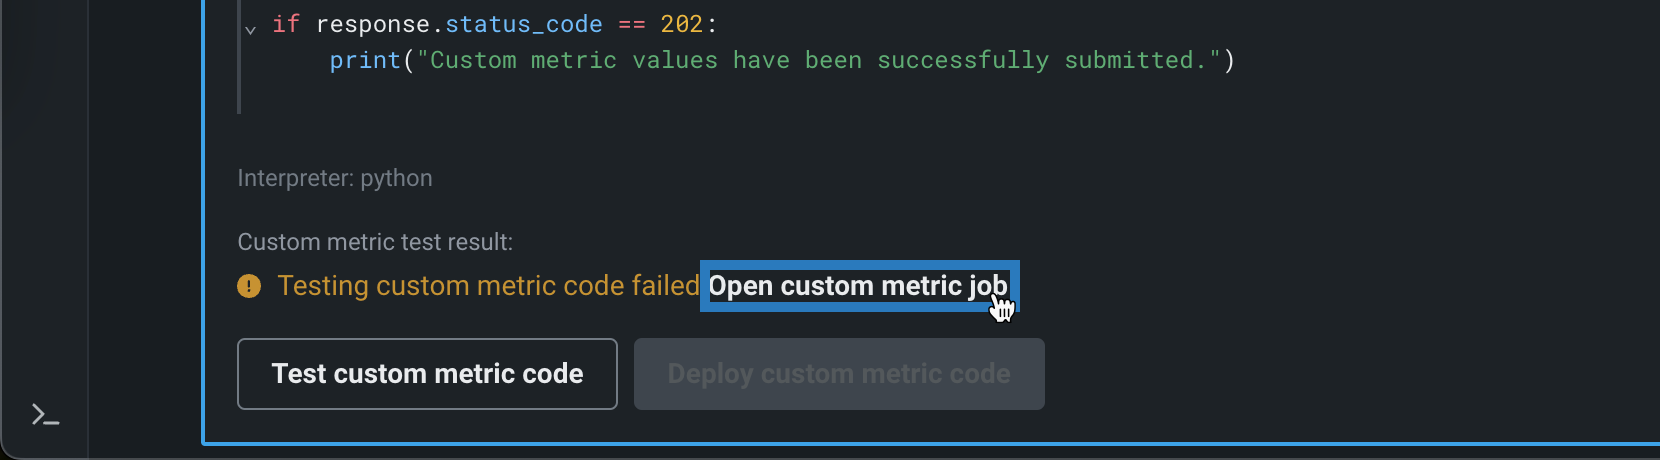
カスタム指標を設定すると、そのコードを含むノートブックがロードされます。 ノートブックには、1つのカスタム指標セルが含まれています。 カスタム指標セルは独自のノートブックセルで、指標のエクスポートと計算の方法を定義するPythonコード、スコアリングのコード、および指標を設定するコードが含まれます。 必要に応じて、カスタム指標セルのコードを変更します。 次に、セルの下部にあるカスタム指標コードをテストをクリックして、コードをテストします。 テストではカスタムジョブが作成されます。 テストが正常に実行された場合、カスタム指標コードをデプロイをクリックして、カスタム指標をデプロイに追加します。
本機能の提供について
ホストされたカスタム指標のノートブックは、デフォルトではオフになっています。 この機能を有効にする方法については、DataRobotの担当者または管理者にお問い合わせください。
機能フラグ:Notebooksでカスタム環境を有効にする
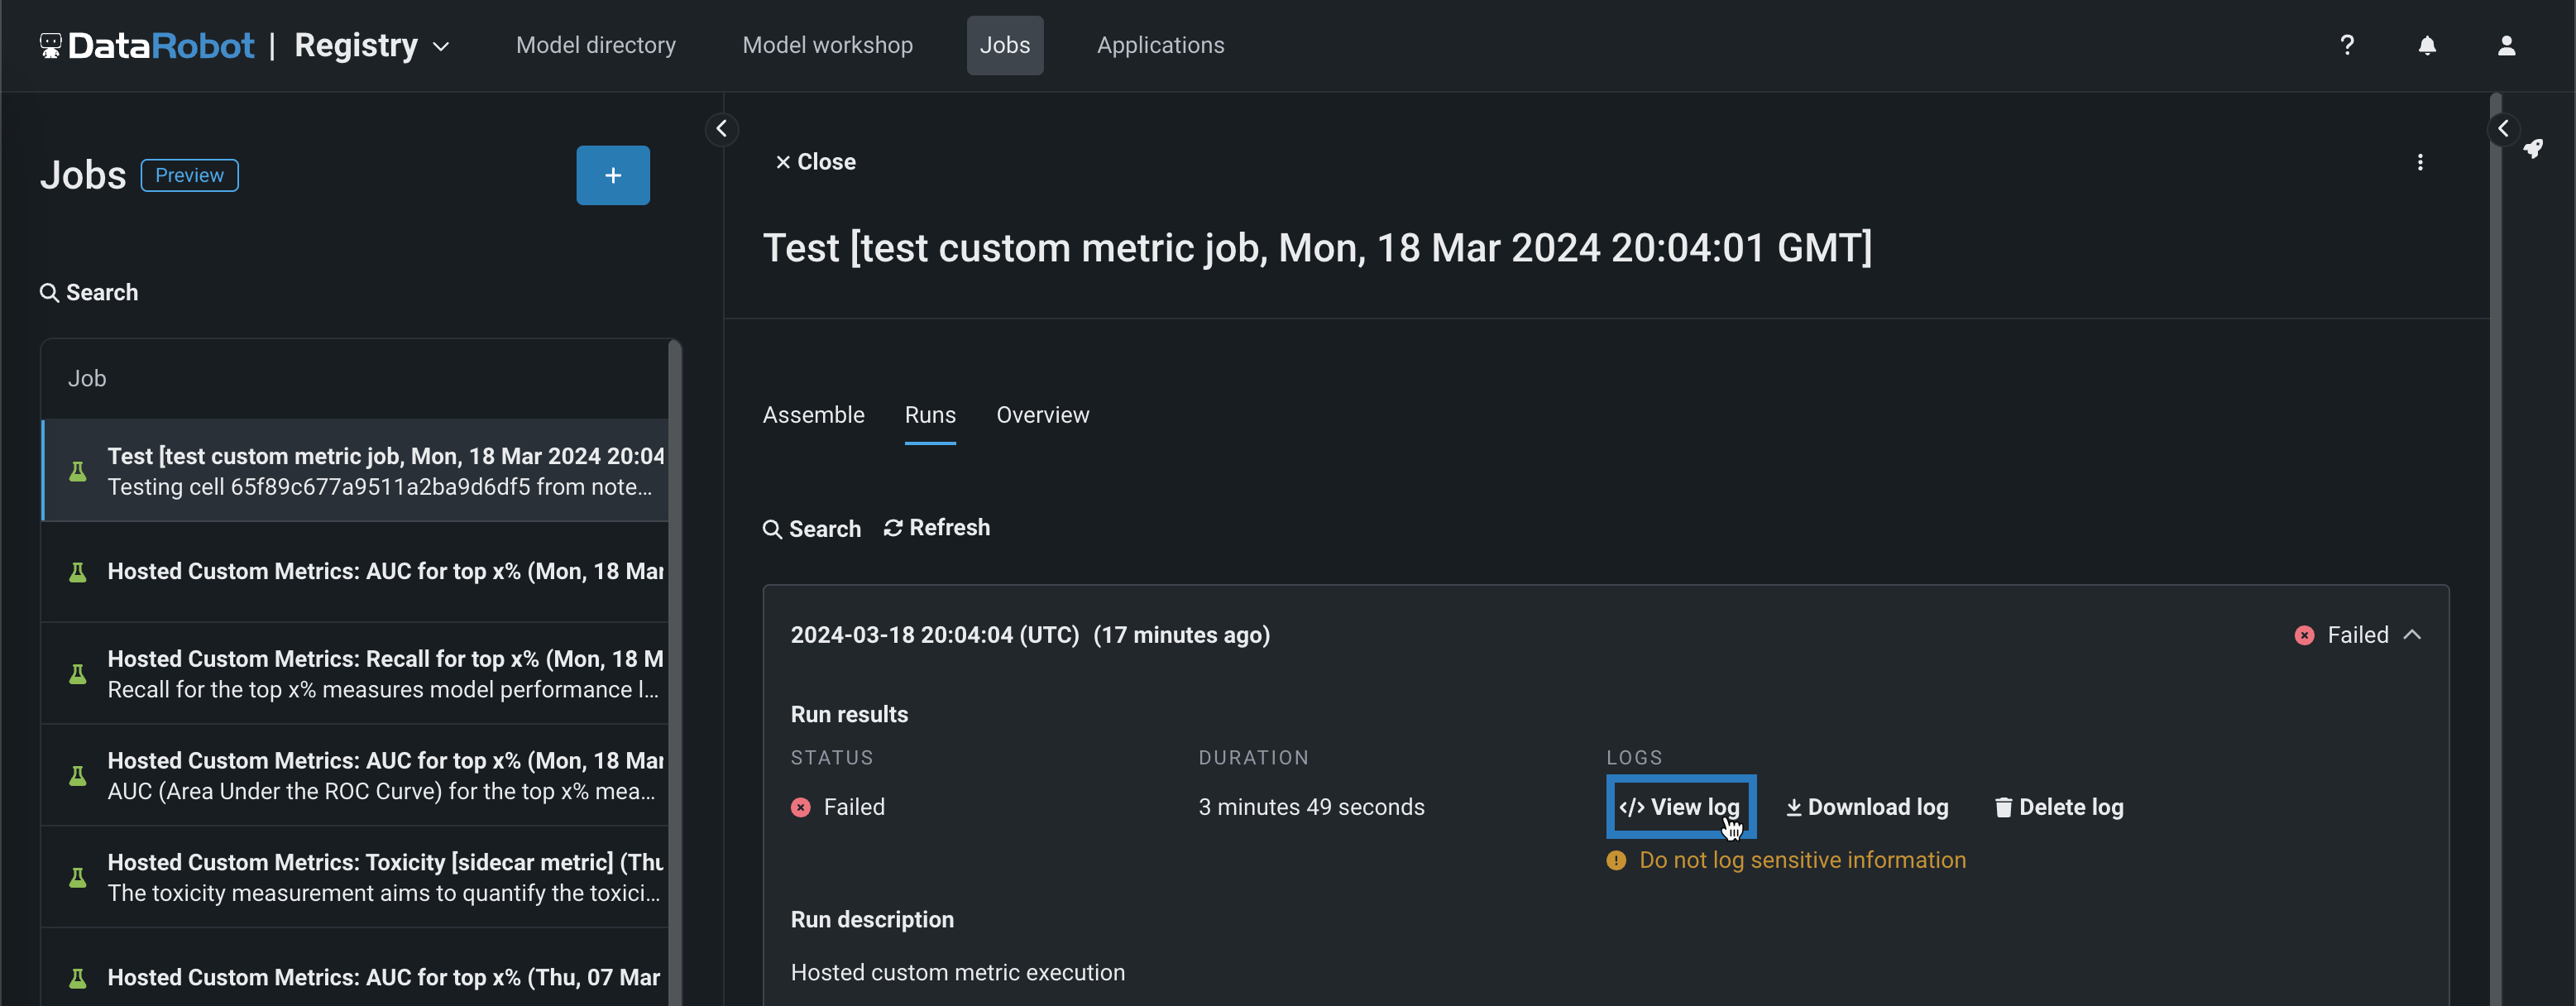
コードが正しく実行されない場合、テスト完了後に、カスタム指標コードのテストに失敗しましたという警告が表示されます。 カスタム指標ジョブを開くをクリックしてジョブにアクセスし、ログを確認して問題のトラブルシューティングを行います。
カスタム指標のコードをトラブルシューティングするには、失敗したテストのログなどのジョブの実行タブに移動します。 失敗した実行で、 ログを表示をクリックします。
ギャラリーからホストされたカスタム指標を追加
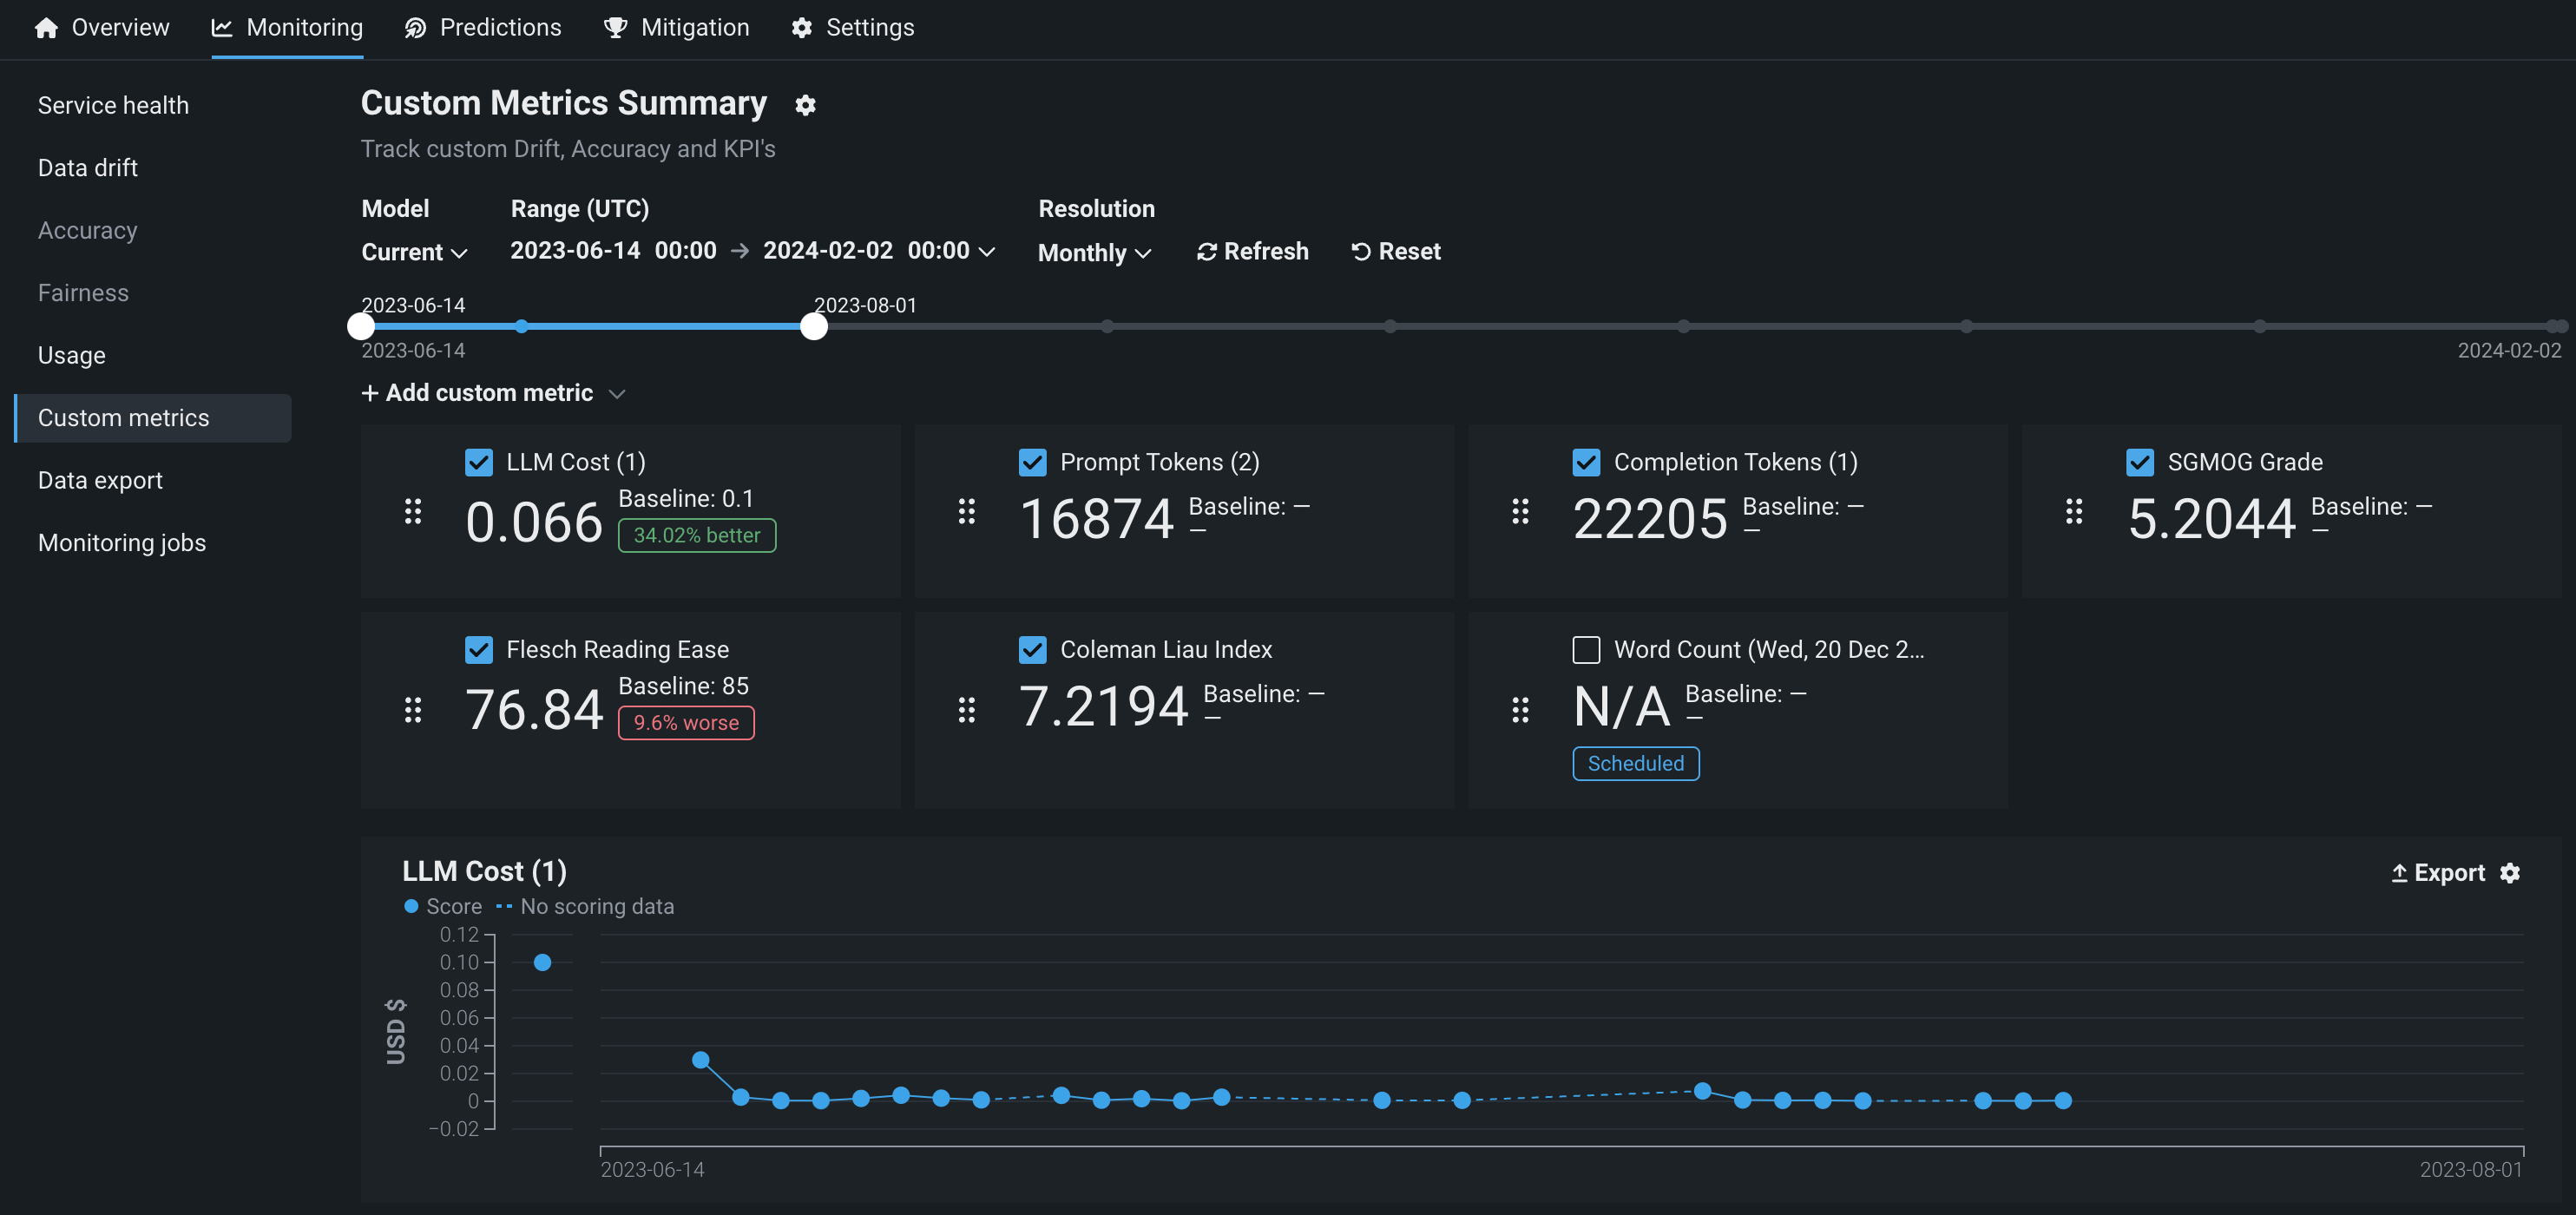
カスタム指標ギャラリーは、事前に作成され、再利用と共有が可能なコードを含む一元化されたライブラリを提供します。このコードは、予測モデルや生成モデル向けに、ホストされた各種カスタム指標を実装します。 これらの指標は、変更可能なカスタム指標のサマリーダッシュボードで、外部のカスタム指標とともに記録されます。 このダッシュボードから、各指標の時間経過に伴う変化を監視、視覚化、およびエクスポートできます。 この機能により、組織固有の指標を実装して、DataRobotに組み込まれているサービスの正常性、データドリフト、精度の各指標によって提供されるインサイトを拡張できます。
事前に作成されたカスタム指標をデプロイに追加するには:
-
カスタム指標を追加パネルで、ユースケースに適したカスタム指標テンプレートを選択します。
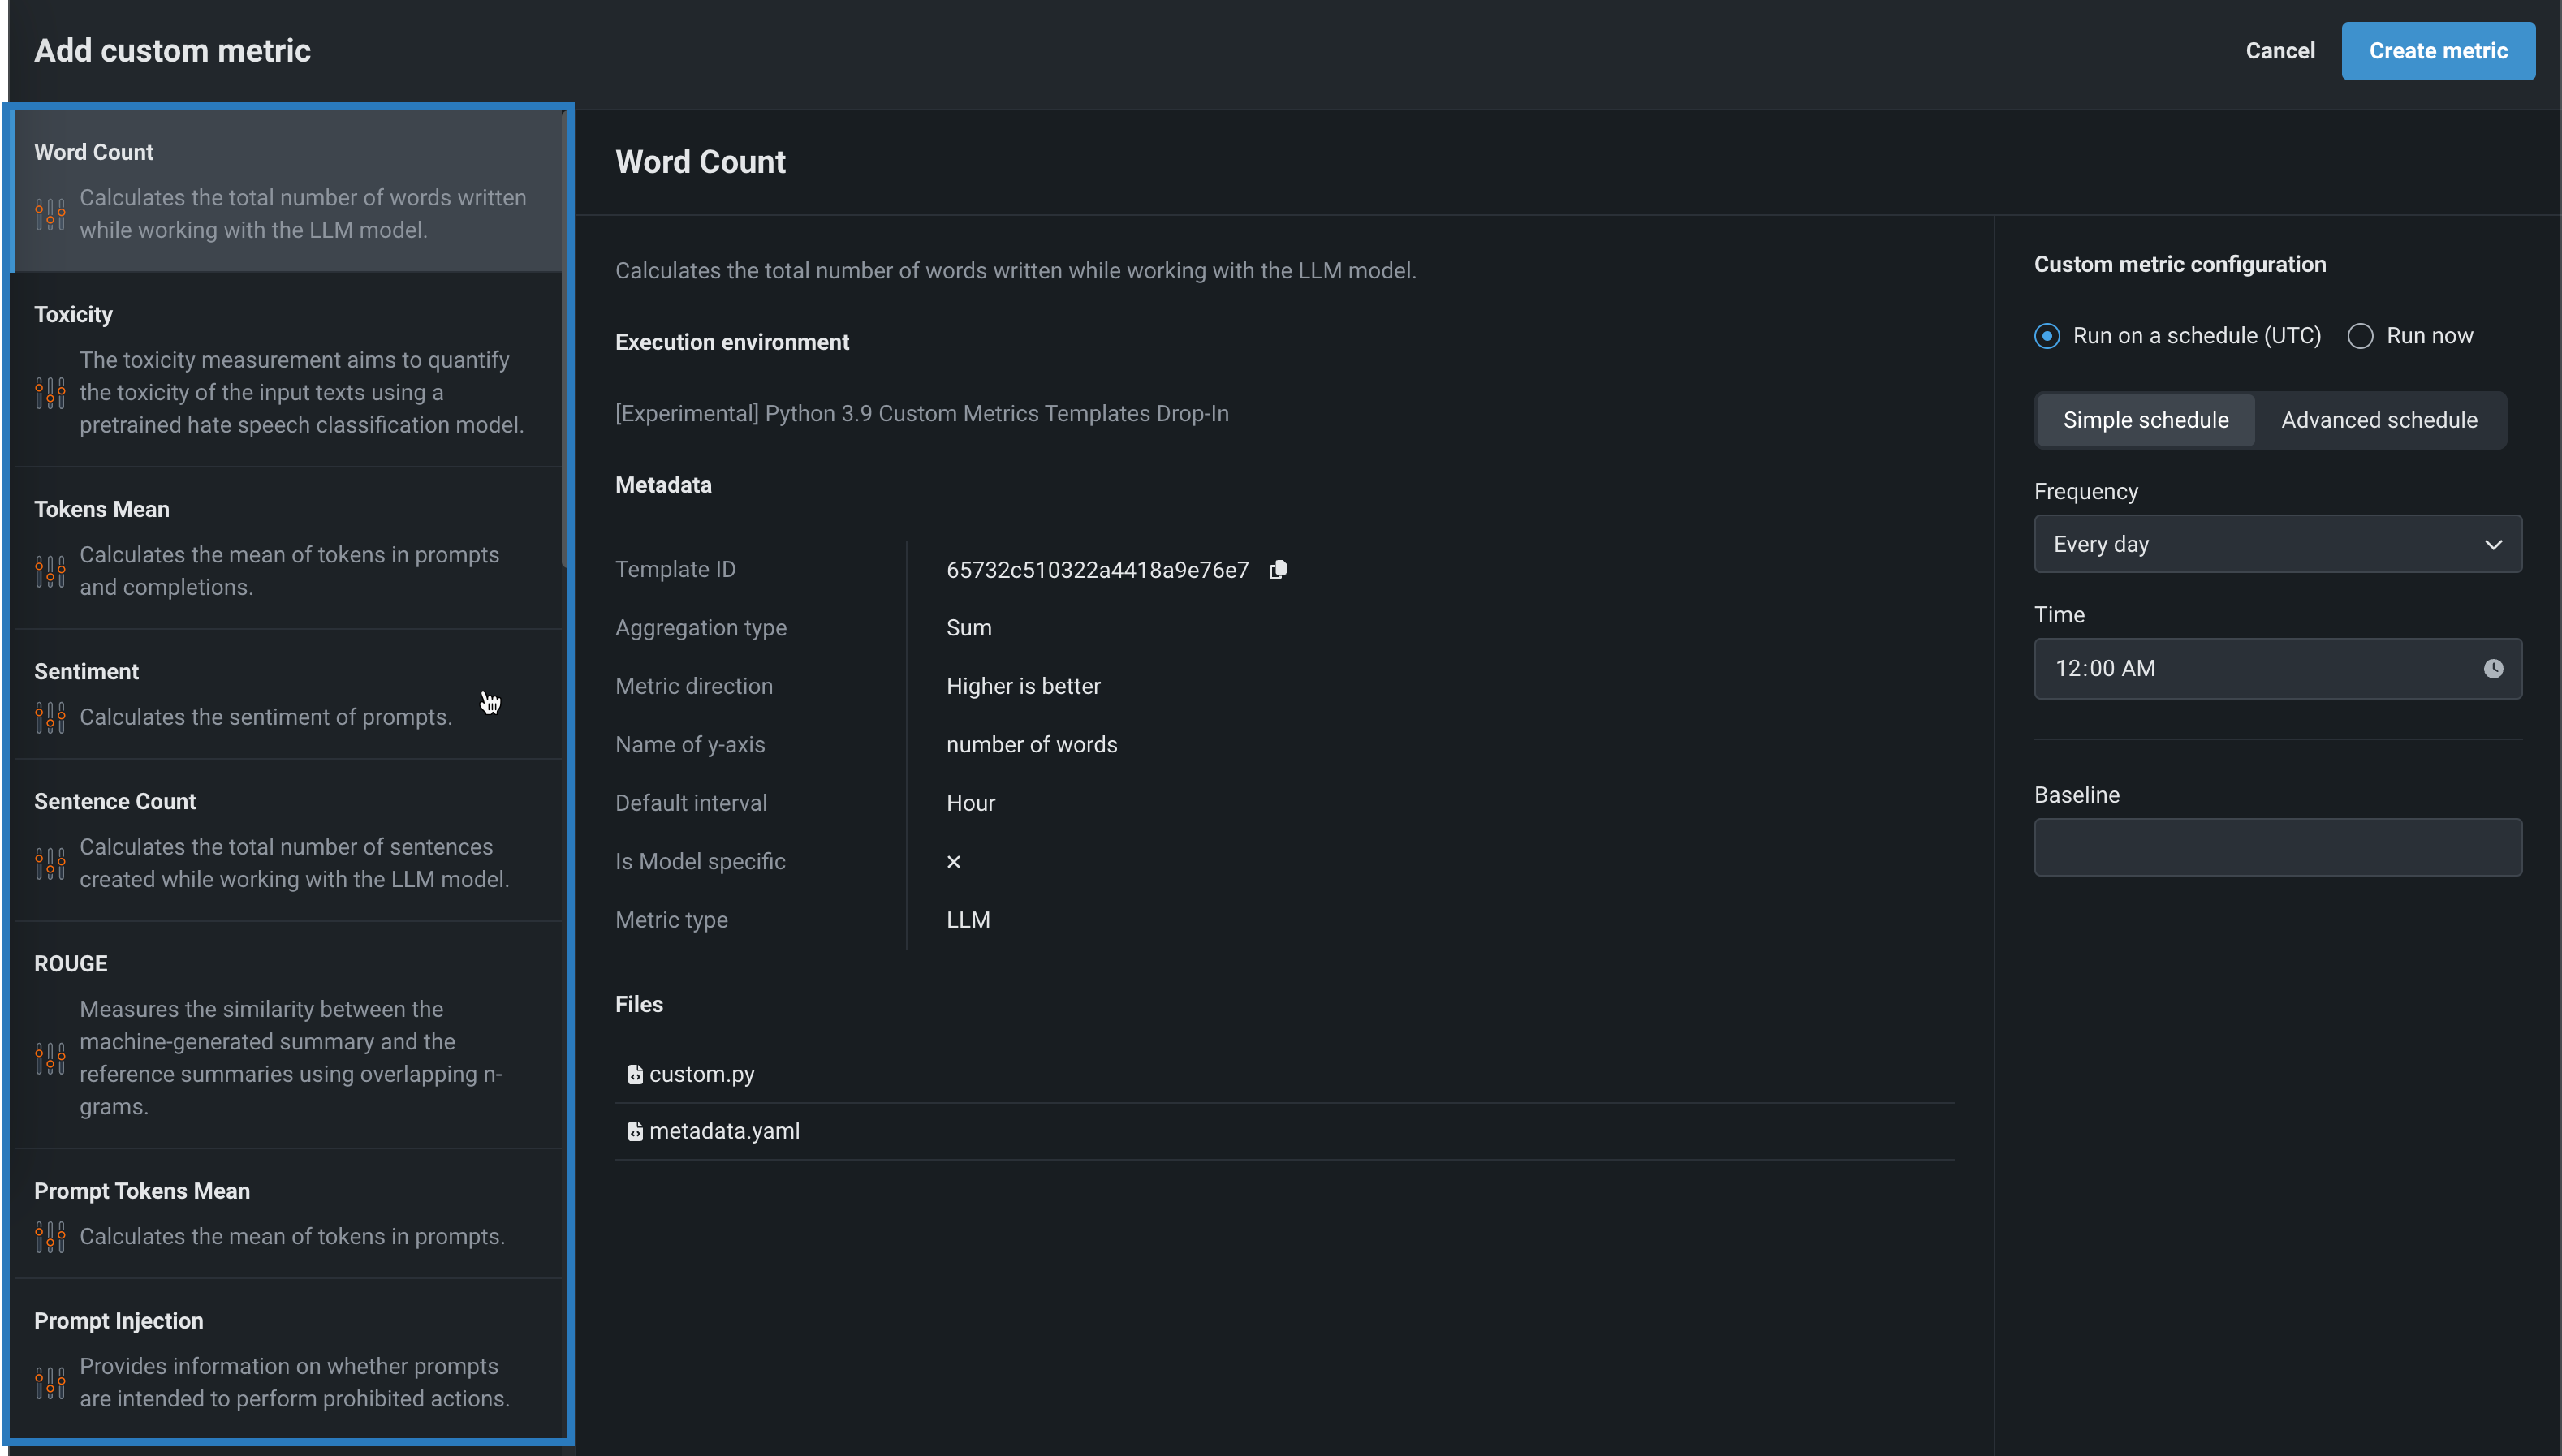
DataRobotは、3つの異なるカテゴリーの指標タイプを提供しています。
カスタム指標のテンプレート 説明 上位x%のリコール 並べ替えられた予測確率の特定の上位部分に限定して、モデルのパフォーマンスを測定します。 リコールは、モデルによって正しく識別される実際の陽性の割合を計算するモデルのパフォーマンス指標です。 上位x%の陽性的中率 並べ替えられた予測確率の特定の上位部分に限定して、モデルのパフォーマンスを測定します。 陽性的中率は、予測された陽性の合計から正しく予測された陽性の観測値の割合を計算するモデルのパフォーマンス指標です。 上位x%のF1 並べ替えられた予測確率の特定の上位部分に限定して、モデルのパフォーマンスを測定します。 F1スコアは、陽性的中率とリコールの両方を考慮するモデルのパフォーマンス指標です。 上位x%のAUC(ROC曲線下の領域) 並べ替えられた予測確率の特定の上位部分に限定して、モデルのパフォーマンスを測定します。 カスタム指標のテンプレート 説明 平均二乗対数誤差(MSLE) 予測値と実測値の対数の平方差の平均を計算します。 これは、ターゲット値が人口数、期間内の商品の平均売上高などの指数関数的に増加すると予想される場合に、連続値問題で使用される損失関数です。 中央絶対誤差(MedAE) ターゲット値と予測値の間の絶対差の中央値を計算します。 これは、予測の精度を測定するために連続値問題で使用される堅牢な指標です。 カスタム指標のテンプレート 説明 読み終わるまでの時間 LLMが生成したテキストを人が読むのにかかる平均時間を推定します。 出力トークン数の平均 リクエストされた期間の完了時のトークンの平均数を計算します。 使用されるcl100k_baseエンコーディングは、OpenAIモデル(gpt-4、gpt-3.5-turbo、text-embedding-ada-002)のみをサポートします。別のモデルを使用する場合は、エンコーディングを変更してください。 コサイン類似度の平均 各プロンプトベクターと対応するコンテキストベクター間の平均コサイン類似度を計算します。 コサイン類似度の最大値 各プロンプトベクターと対応するコンテキストベクター間の最大のコサイン類似度を計算します。 コサイン類似度の最小値 各プロンプトベクターと対応するコンテキストベクター間の最小のコサイン類似度を計算します。 コスト 入力、出力、および検索されたテキストのトークン数を計算してから、トークンの価格設定を適用することで、LLMを使用する際の財務コストを推定します。 使用されるcl100k_baseエンコーディングは、OpenAIモデル(gpt-4、gpt-3.5-turbo、text-embedding-ada-002)のみをサポートします。別のモデルを使用する場合は、エンコーディングを変更してください。 Dale-Chall 読みやすさ 難解な単語の割合と平均的な文章の長さに基づいて、テキストを理解するのに必要な米国の学年レベルを測定します。 ユークリッド平均 各プロンプトベクターと対応するコンテキストベクター間の平均ユークリッド距離を計算します。 ユークリッド最大値 各プロンプトベクターと対応するコンテキストベクター間の最大ユークリッド距離を計算します。 ユークリッド最小値 各プロンプトベクターと対応するコンテキストベクター間の最小ユークリッド距離を計算します。 フレッシュ読解容易性 テキストの読みやすさを、平均の文章長さと単語あたりの平均音節数に基づいて測定します。 プロンプトインジェクション[サイドカー指標] システムプロンプトの上書きや変更など、モデルの出力を変えることを目的とした入力操作を検出します。 この指標には、プロンプトインジェクション分類器の グローバルモデルを追加でデプロイする必要があります。 プロンプトトークンの平均 リクエストされた期間のプロンプトでの平均トークン数を計算します。 使用されるcl100k_baseエンコーディングは、OpenAIモデル(gpt-4、gpt-3.5-turbo、text-embedding-ada-002)のみをサポートします。別のモデルを使用する場合は、エンコーディングを変更してください。 文章数 LLMによって生成されたユーザープロンプトとテキスト内の文章の総数を計算します。 センチメント テキストのセンチメントを肯定的か否定的に分類します センチメント[サイドカー指標] 事前に学習された感情分類モデルを使用して、テキストの感情を肯定的または否定的に分類します。 この指標には、感情分類器の グローバルモデルを追加でデプロイする必要があります。 音節数 ユーザープロンプトとLLMが生成したテキストに含まれる単語の音節数の合計を計算します。 トークンの平均 プロンプトと補完のトークンの平均を計算します。 使用されるcl100k_baseエンコーディングは、OpenAIモデル(gpt-4、gpt-3.5-turbo、text-embedding-ada-002)のみをサポートします。別のモデルを使用する場合は、エンコーディングを変更してください。 毒性[サイドカー指標] 事前に訓練された差別的発言の分類モデルを使用してテキストの毒性を測定し、有害なコンテンツを防止します。 この指標には、毒性分類器の グローバルモデルを追加でデプロイする必要があります。 ワードカウント ユーザープロンプトとLLMが生成したテキストに含まれる単語数の合計を計算します。 日本語テキストの指標 [日本語] 文字数 LLMでの作業中に生成された文字数の合計を計算します。 [日本語] PII出現数 LLMでの作業中に発生したPIIの総数を計算します。 カスタム指標のテンプレート 説明 エージェントの出力トークン エージェントベースのLLM呼び出しの総出力トークン数を計算します。 エージェントのコスト エージェントベースのLLM呼び出しの総コストを計算します。 指標がトレースからコストを計算できるように、各LLMスパンがトークンの使用状況を報告する必要があります。 エージェントのプロンプトトークン エージェントベースのLLM呼び出しの総プロンプトトークン数を計算します。 -
リストから指標を選択したら、カスタム指標設定サイドバーで、指標計算スケジュールを設定するか、指標計算を直ちに実行し、必要に応じて指標ベースライン値を設定します。

サイドカー指標
[sidecar metric]を選択した場合は、アセンブルタブを開いたときに、ランタイムパラメーターセクションに移動してSIDECAR_DEPLOYMENT_IDを設定します。サイドカー指標を、その指標の計算に必要な接続されたデプロイに関連付けます。 指標を計算するモデルをデプロイしていない場合、これらの指標には、 グローバルモデルとして事前に定義されたモデルがあります。 -
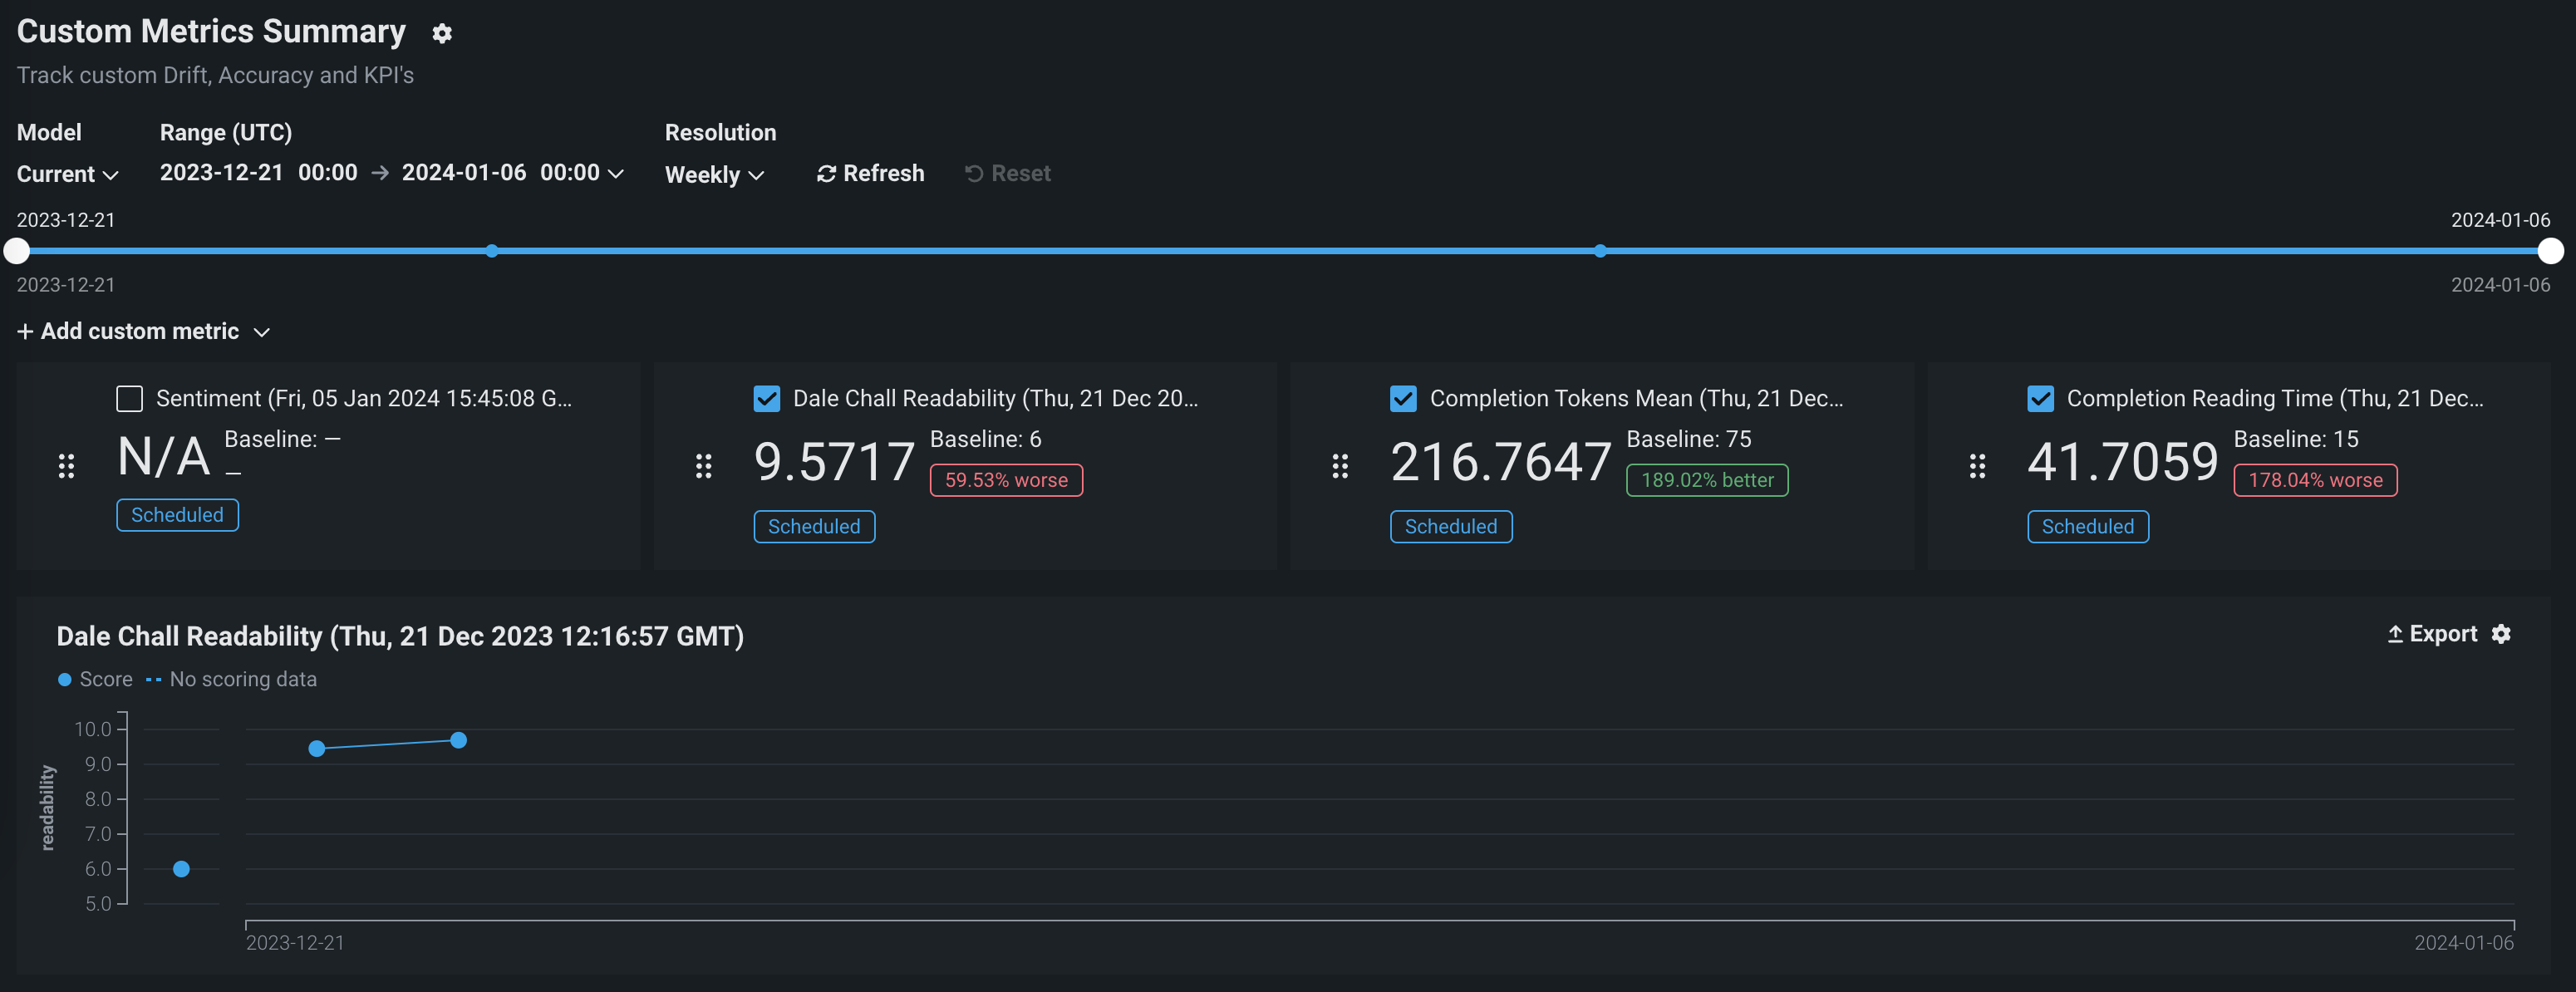
指標を作成をクリックします。 新しい指標が、カスタム指標ダッシュボードに表示されます。
-
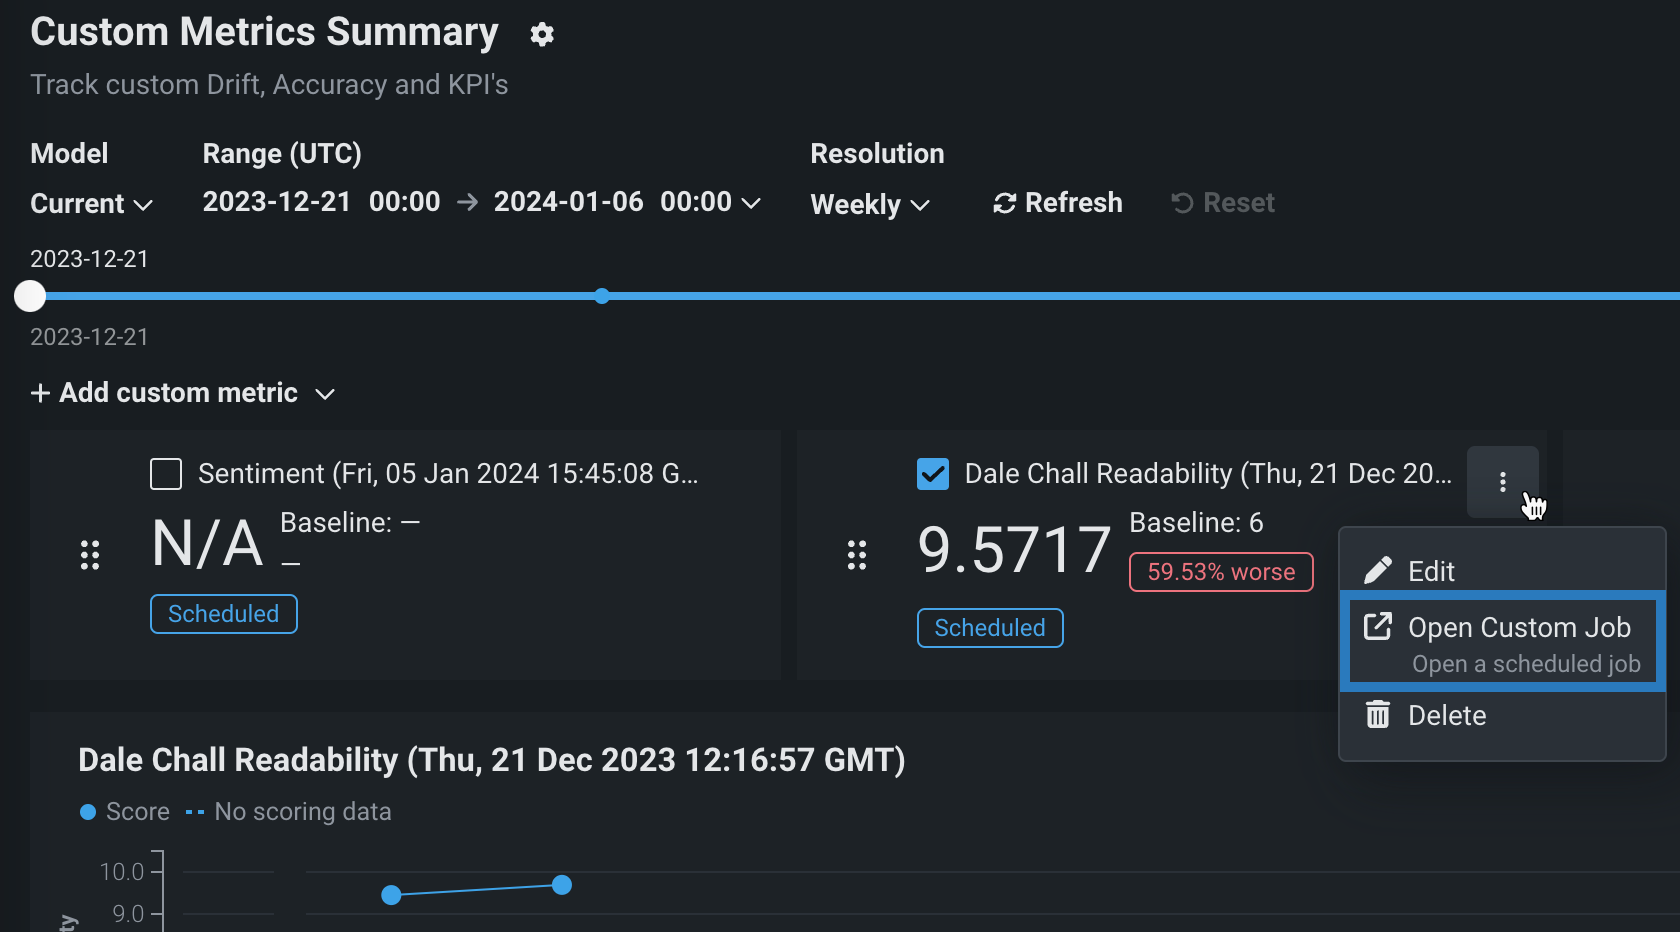
カスタム指標を作成すると、その指標に関連付けられたカスタムジョブを表示できます。 このジョブは定義されたスケジュールで実行され、ギャラリーからではない ホストされたカスタム指標と同様にカスタム指標を計算します。 関連付けられたカスタムジョブへのアクセスと管理を行うには、アクションメニュー をクリックして、 カスタムジョブを開くをクリックします。
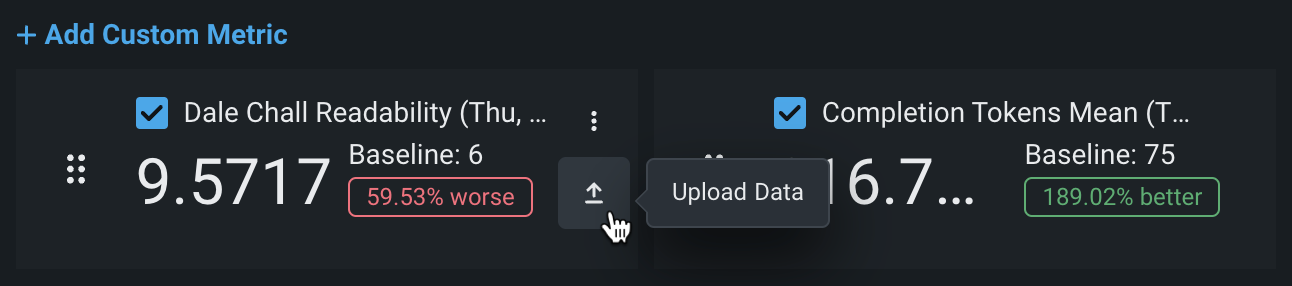
カスタム指標にデータをアップロード
カスタム指標を作成した後、データを提供して指標を計算できます。
-
カスタム指標タブで、データをアップロードするカスタム指標を見つけ、 データをアップロードするアイコンをクリックします。
-
データをアップロードダイアログボックスで、アップロード方法を選択してから、次へをクリックします:
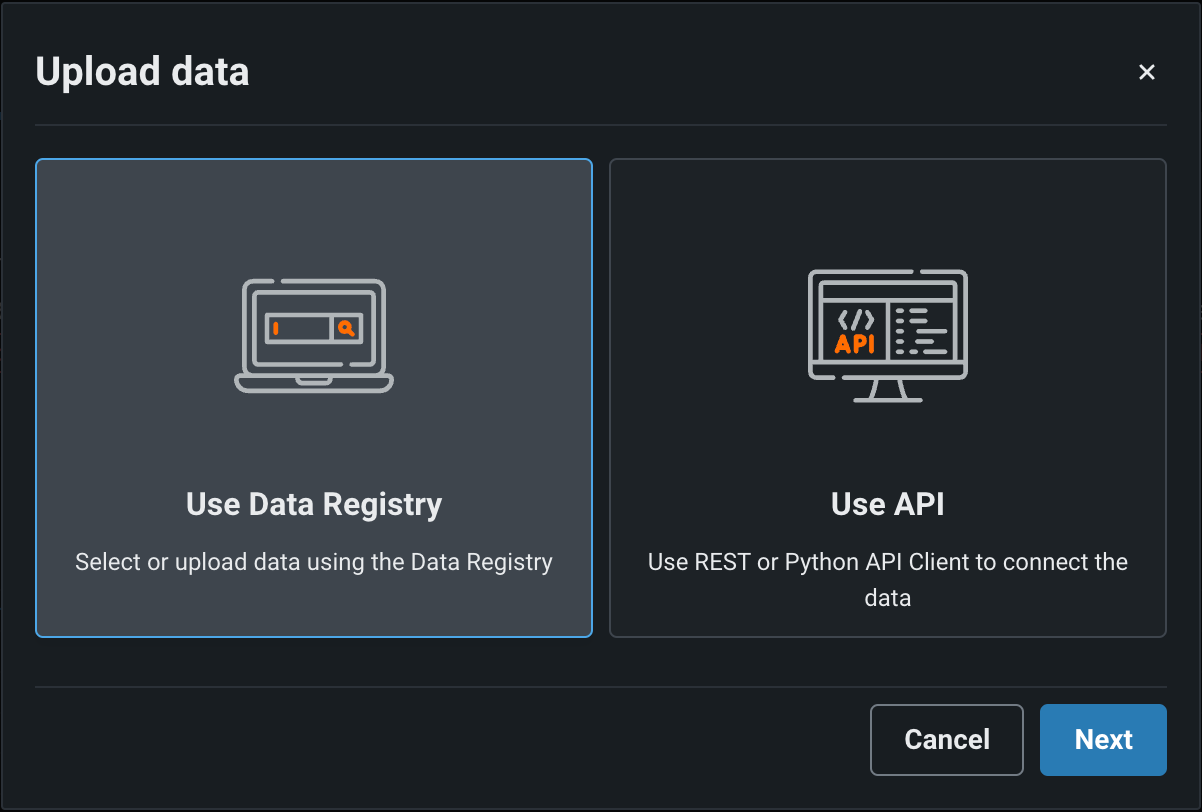
アップロード方法 説明 データレジストリを使用 データセットを選択パネルで、データセットをアップロードするか、またはリストからデータセットをクリックして、その後確認をクリックします。 データレジストリには、 データ探索タブのデータセットが含まれます。 APIを使用 APIクライアントを使用ダイアログボックスで、クリップボードにコピーをクリックしてから、APIスニペットを変更し、それを使用してデータセットをアップロードします。 1回のAPI呼び出しで最大10,000個の値をアップロードできます。 -
データセット列を選択ダイアログボックスで、以下を設定します。
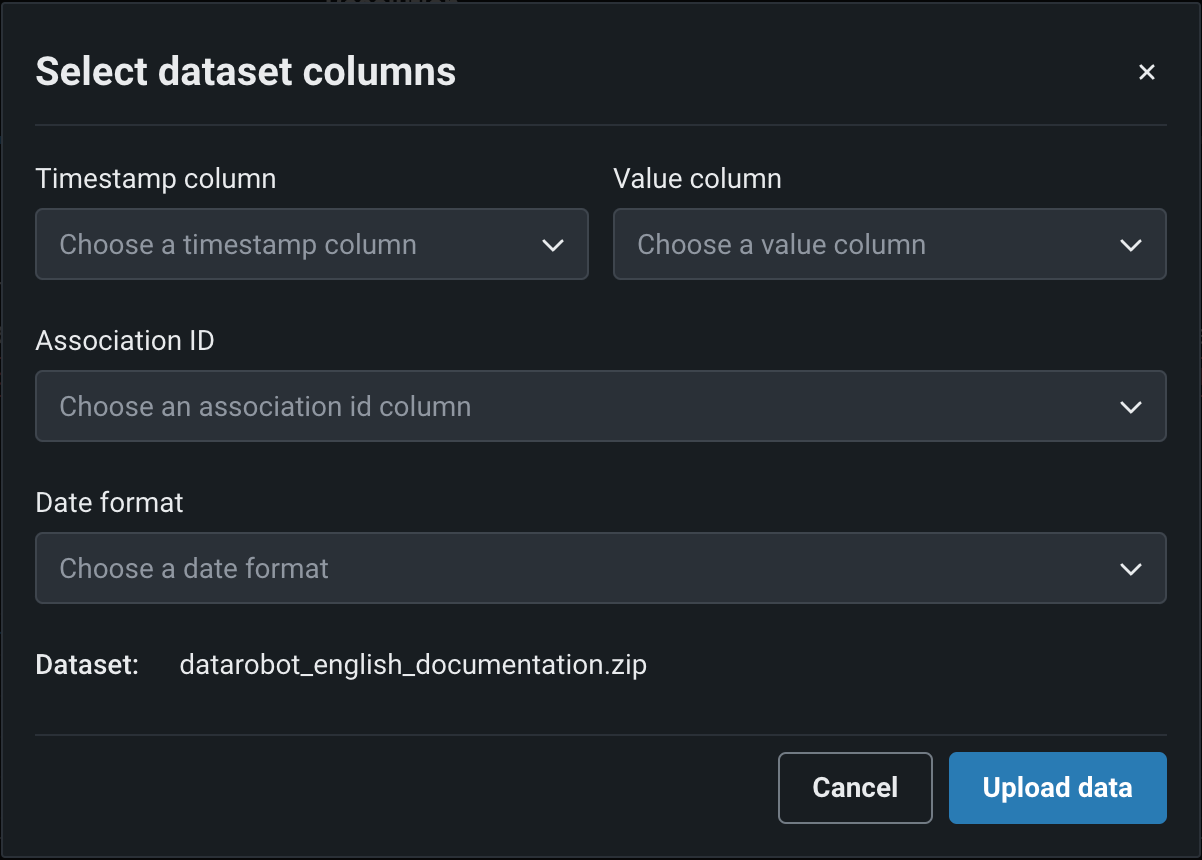
フィールド 説明 タイムスタンプ列 (必須)タイムスタンプを含むデータセット内の列。 値列 (必須)カスタム指標の計算に使用される値を含むデータセット内の列。 関連付けID 予測値を実測値にリンクするためにカスタム指標で必要とする関連付けIDを含む行。 日付形式 タイムスタンプ列で使用される日付形式。 -
データをアップロードするをクリックします。
チャットリクエストによるカスタム指標の報告
DataRobotにデプロイされたテキスト生成およびエージェントワークフローのカスタムモデルで、chat()フックを実装する場合、extra_bodyフィールドによって、チャット補完リクエスト内で直接カスタム指標値を報告できます。 これにより、チャットリクエストを行うと同時にカスタム指標を報告することができ、データを別々にアップロードする必要はありません。
手動でのチャットリクエスト作成
OpenAIクライアントは、extra_bodyパラメーターの内容を、チャットPOSTリクエストのJSONペイロード内の上位レベルフィールドに変換します。 OpenAIクライアントを使用せずにチャットペイロードを手動で構築する場合、ペイロードのトップレベルに"datarobot_metrics": {...}を含めます。
チャットリクエストでカスタム指標を報告するには:
-
デプロイに関連付けID列が定義され、モデレーションが設定されていることを確認します。 これらは、カスタム指標を処理するために必要です。
-
外部カスタム指標の追加の説明に従って、カスタム指標タブでカスタム指標を定義します。
-
OpenAIクライアントを使用してチャット補完リクエストを行う場合、
extra_bodyフィールドにdatarobot_metricsを含め、報告する指標の名前と値を入力します。
from openai import OpenAI

openai_client = OpenAI(
    base_url="https://<your-datarobot-instance>/api/v2/deployments/{deployment_id}/",
    api_key="<your_api_key>",
)

extra_body = {
    # These values pass through to the LLM
    "llm_id": "azure-gpt-6",
    # If set here, replaces the auto-generated association ID
    "datarobot_association_id": "my_association_id_0001",
    # DataRobot captures these for custom metrics
    "datarobot_metrics": {
        "field1": 24,
        "field2": 25
    }
}

completion = openai_client.chat.completions.create(
    model="datarobot-deployed-llm",
    messages=[
        {"role": "system", "content": "Explain your thoughts using at least 100 words."},
        {"role": "user", "content": "What would it take to colonize Mars?"},
    ],
    max_tokens=512,
    extra_body=extra_body
)

print(completion.choices[0].message.content)
カスタム指標の要件
datarobot_metricsの各名前に一致するカスタム指標が、デプロイですでに定義されている必要があります。- この方法で報告されるカスタム指標値は、数値である必要があります。
- デプロイされたカスタムモデルには、指標を処理するために、関連付けID列が定義され、モデレーションが設定されている必要があります。
関連付けIDの指定方法など、チャットリクエストでのextra_bodyの使用の詳細については、chat()フックのドキュメントを参照してください。
カスタム指標の管理
カスタム指標ダッシュボードでは、カスタム指標を追加した後、それらを編集または削除できます。
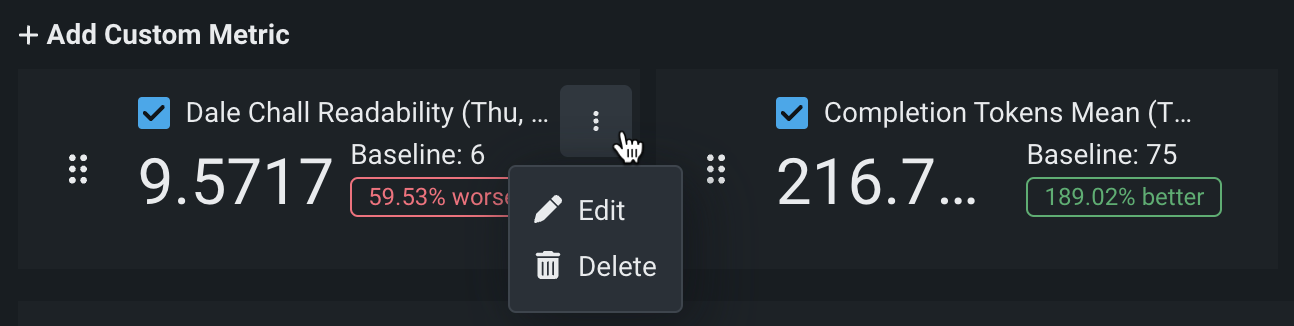
カスタム指標タブで、管理したいカスタム指標を見つけてから、アクションメニュー をクリックします。
-
指標を編集するには、 編集をクリックし、変更可能な設定を更新して、カスタム指標を更新をクリックします。
-
指標を削除するには、 削除をクリックします。
カスタム指標ダッシュボードの表示設定
以下の設定を行い、ダッシュボードに表示するカスタム指標の計算を指定します。
評価とモデレーションのカスタム指標には関連付けIDが必要
評価とモデレーションを設定するときに追加された指標について、カスタム指標タブでデータを表示するには、デプロイされたLLMを介して予測を開始する前に、関連付けIDを設定して予測ストレージを有効にします。 関連付けIDを設定せず、LLMの予測とともに関連付けIDを指定した場合、モデレーションの指標は カスタム指標タブでは計算されません。 この設定は、デプロイ 中やデプロイ 後に有効化できます。
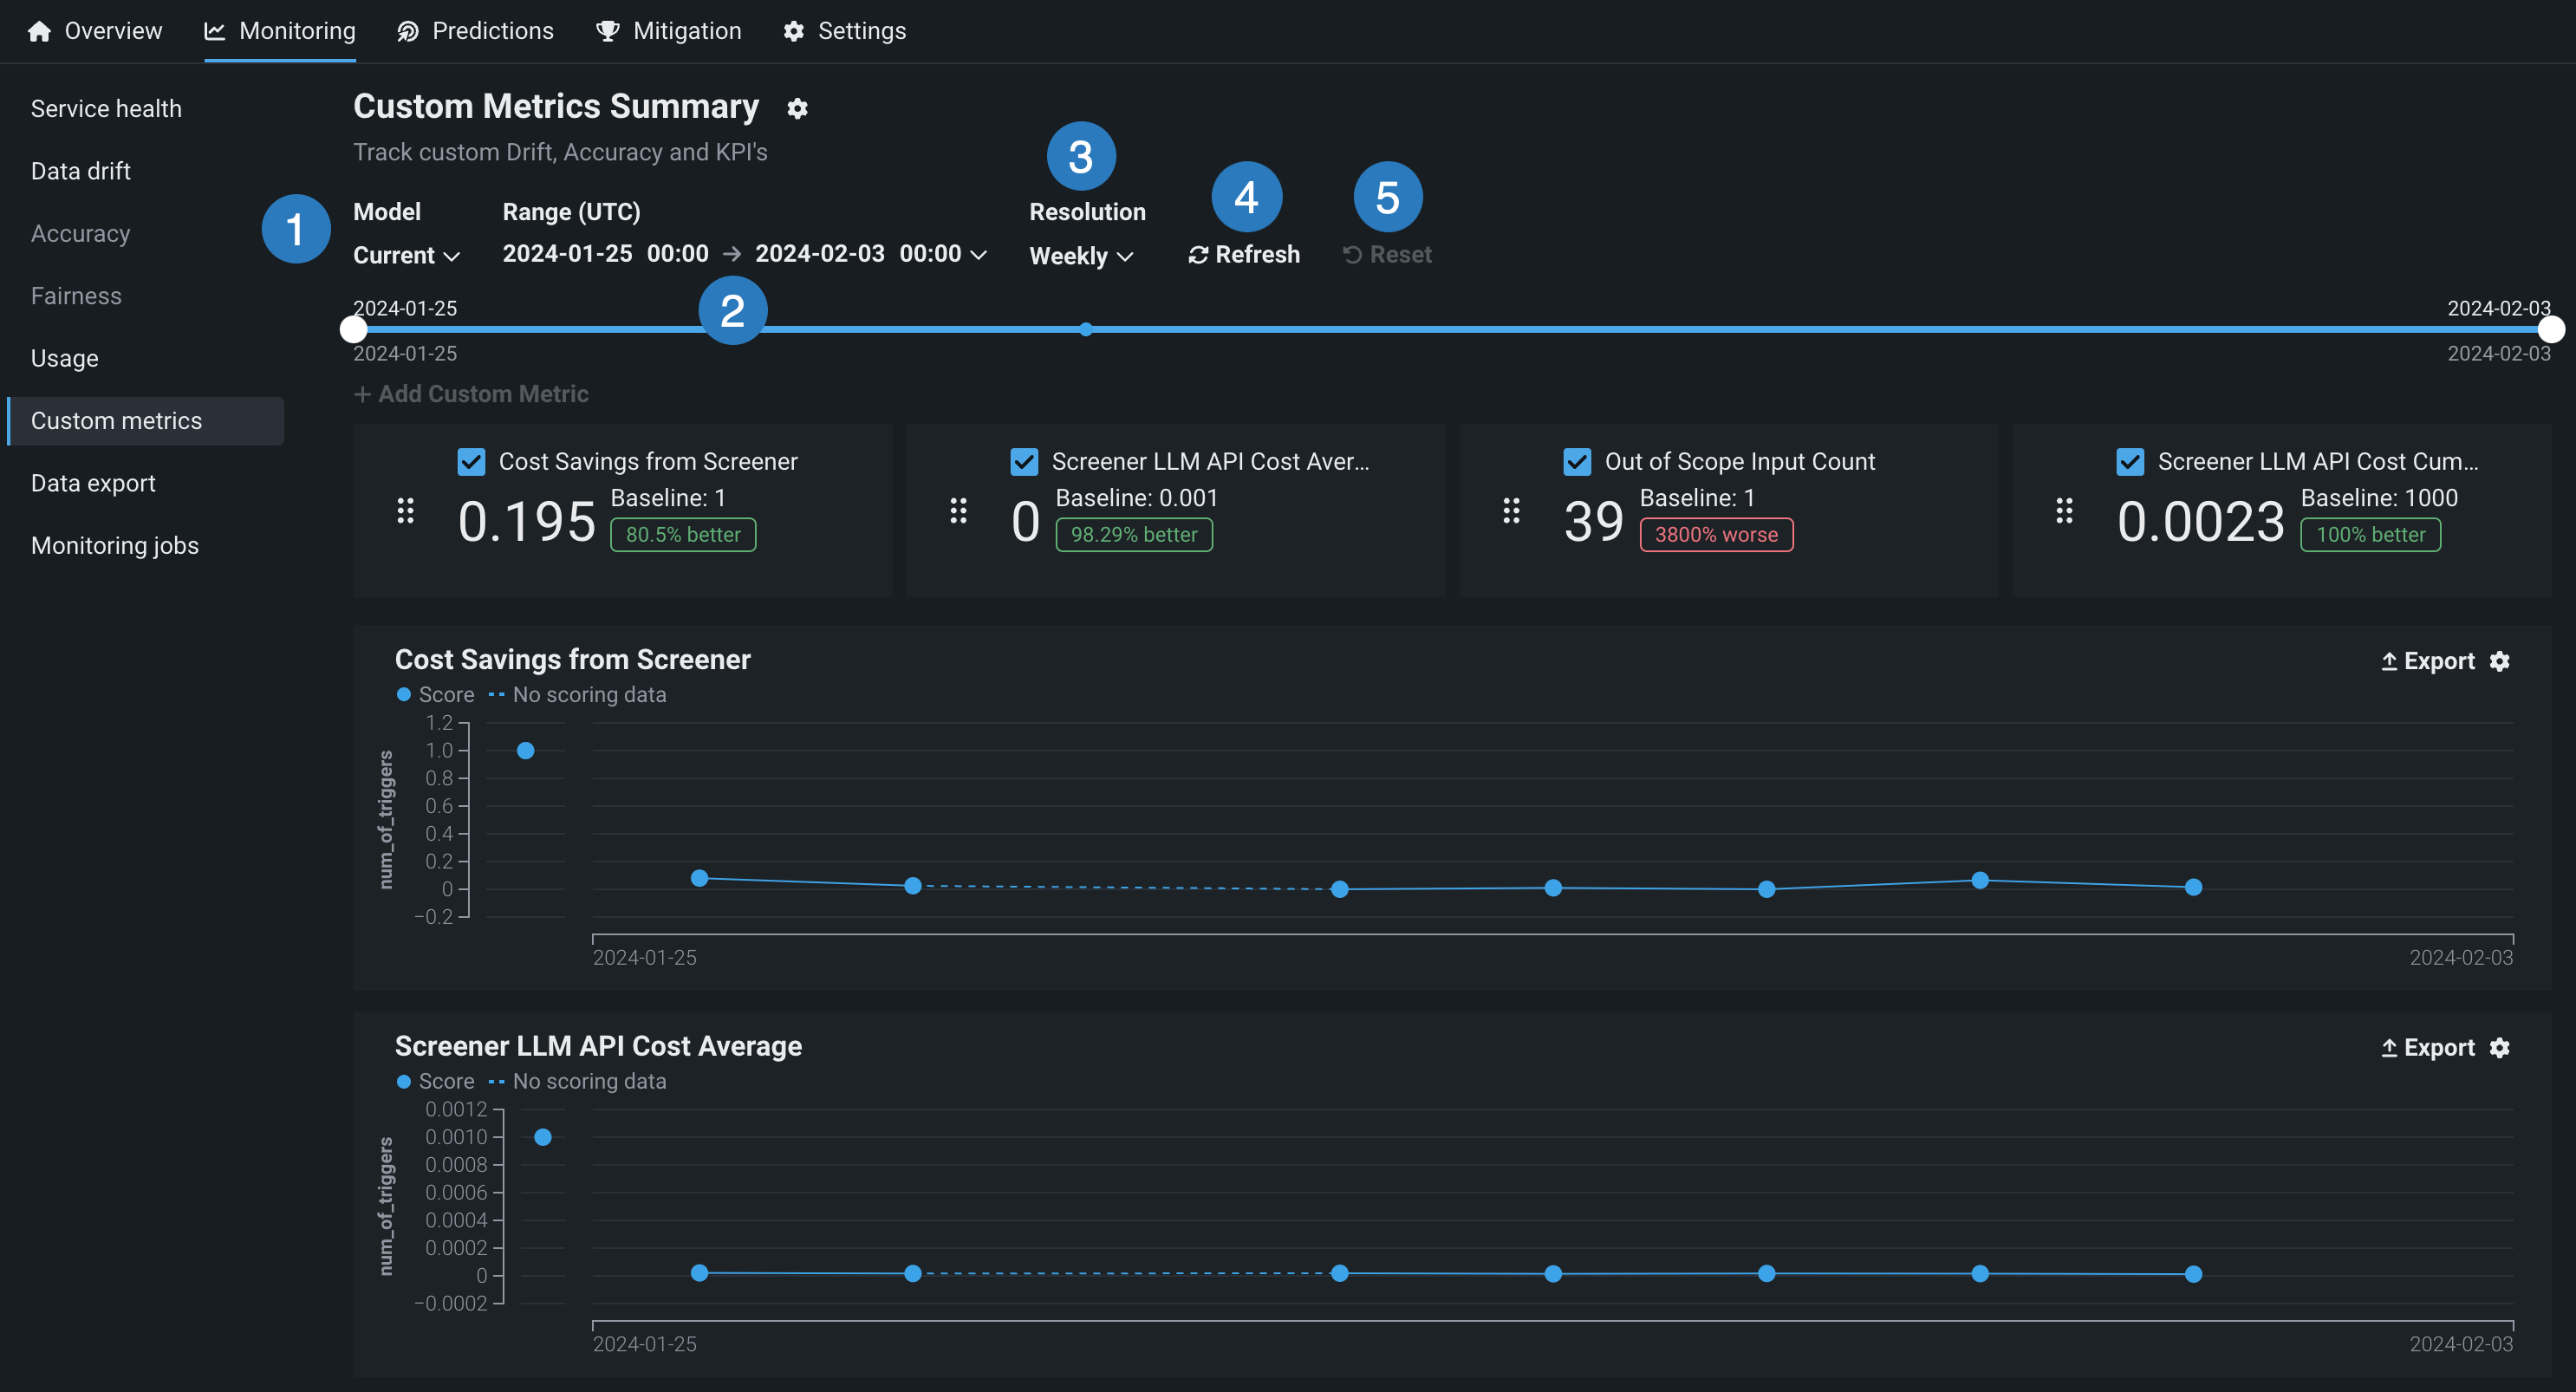
| 設定 | 説明 | |
|---|---|---|
| 1 | モデル | カスタム指標を表示するデプロイのモデル(現在または以前)を選択します。 |
| 2 | 範囲(UTC)/ 日付スライダー | カスタム指標を表示する期間の開始日と終了日を選択します。 |
| 3 | 単位 | 日付スライダーの時間単位を選択します。 選択した時間範囲に基づき、単位を毎時、毎日、毎週、毎月から選択します。 時間範囲が7日を超える場合、単位を毎時にすることはできません。 |
| 4 | セグメント属性 / セグメント値 | セグメント分析で視覚化されるデータドリフトをフィルターするために、個々の属性と値を設定します。 |
| 5 | 表示を更新 | カスタム指標ダッシュボードを更新します。 |
| 6 | リセット | カスタム指標ダッシュボードの表示設定をデフォルトに戻します。 |
ダッシュボード上の指標の配置または非表示
カスタム指標のサマリーダッシュボードで指標を並べ替えたり非表示にしたりするには、移動または非表示にするカスタム指標を見つけます。
-
指標を移動するには、指標タイルの左側にあるグリッドアイコン をクリックしてから、指標を新しい場所にドラッグします。
-
指標のチャートを非表示にするには、指標名の横にあるチェックボックスをオフにします。
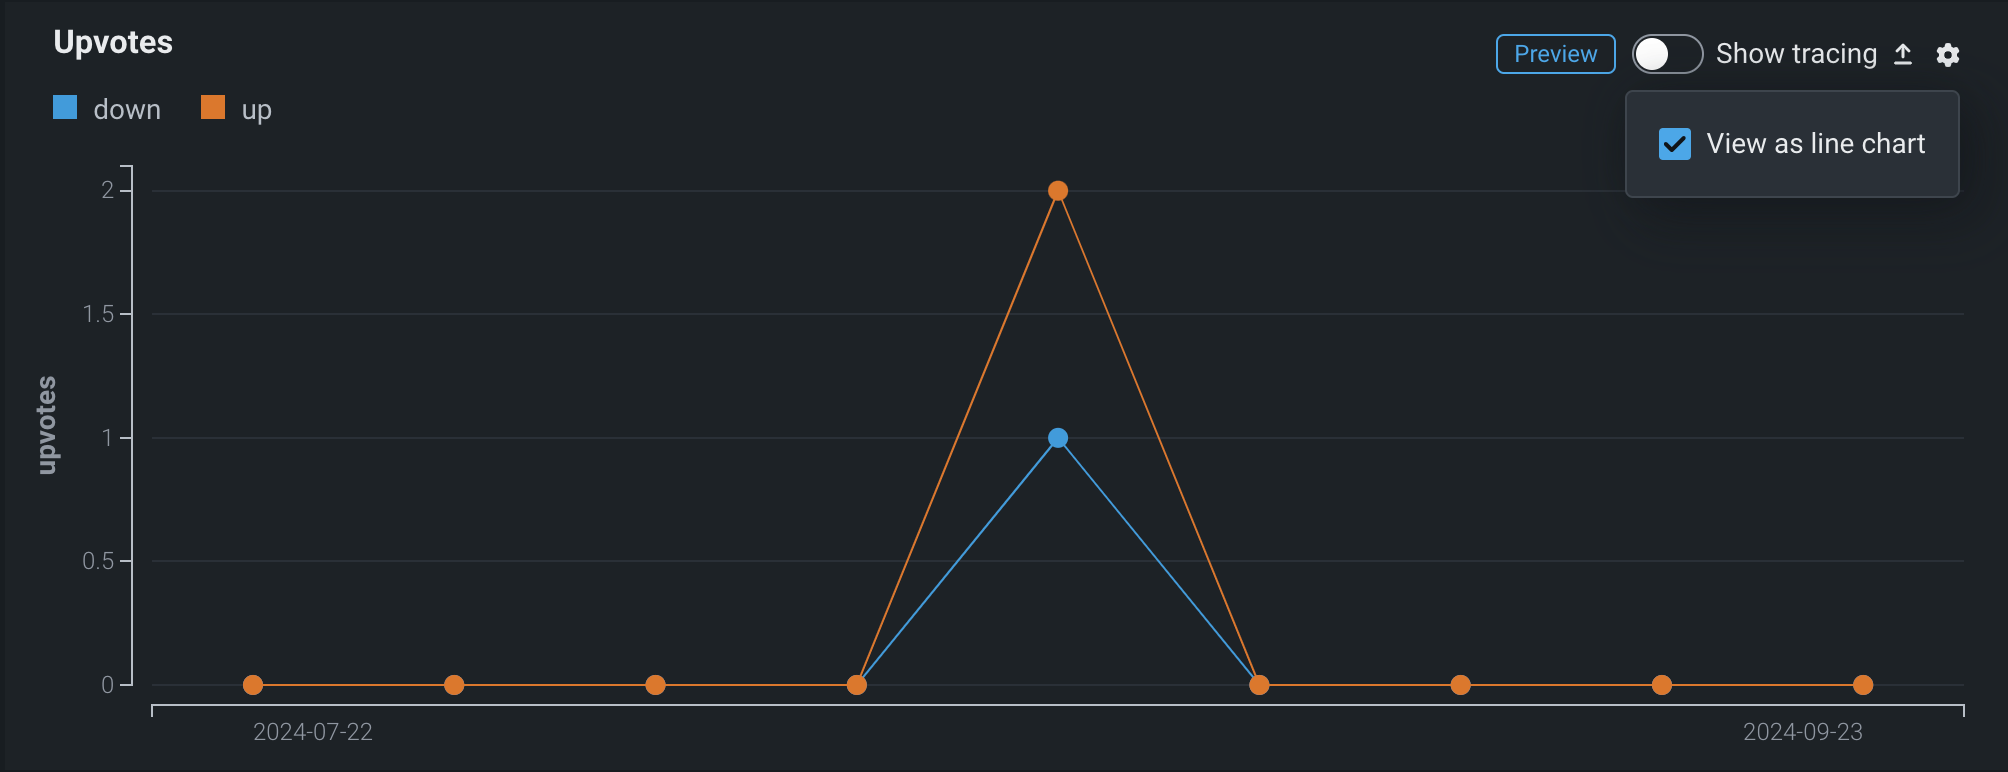
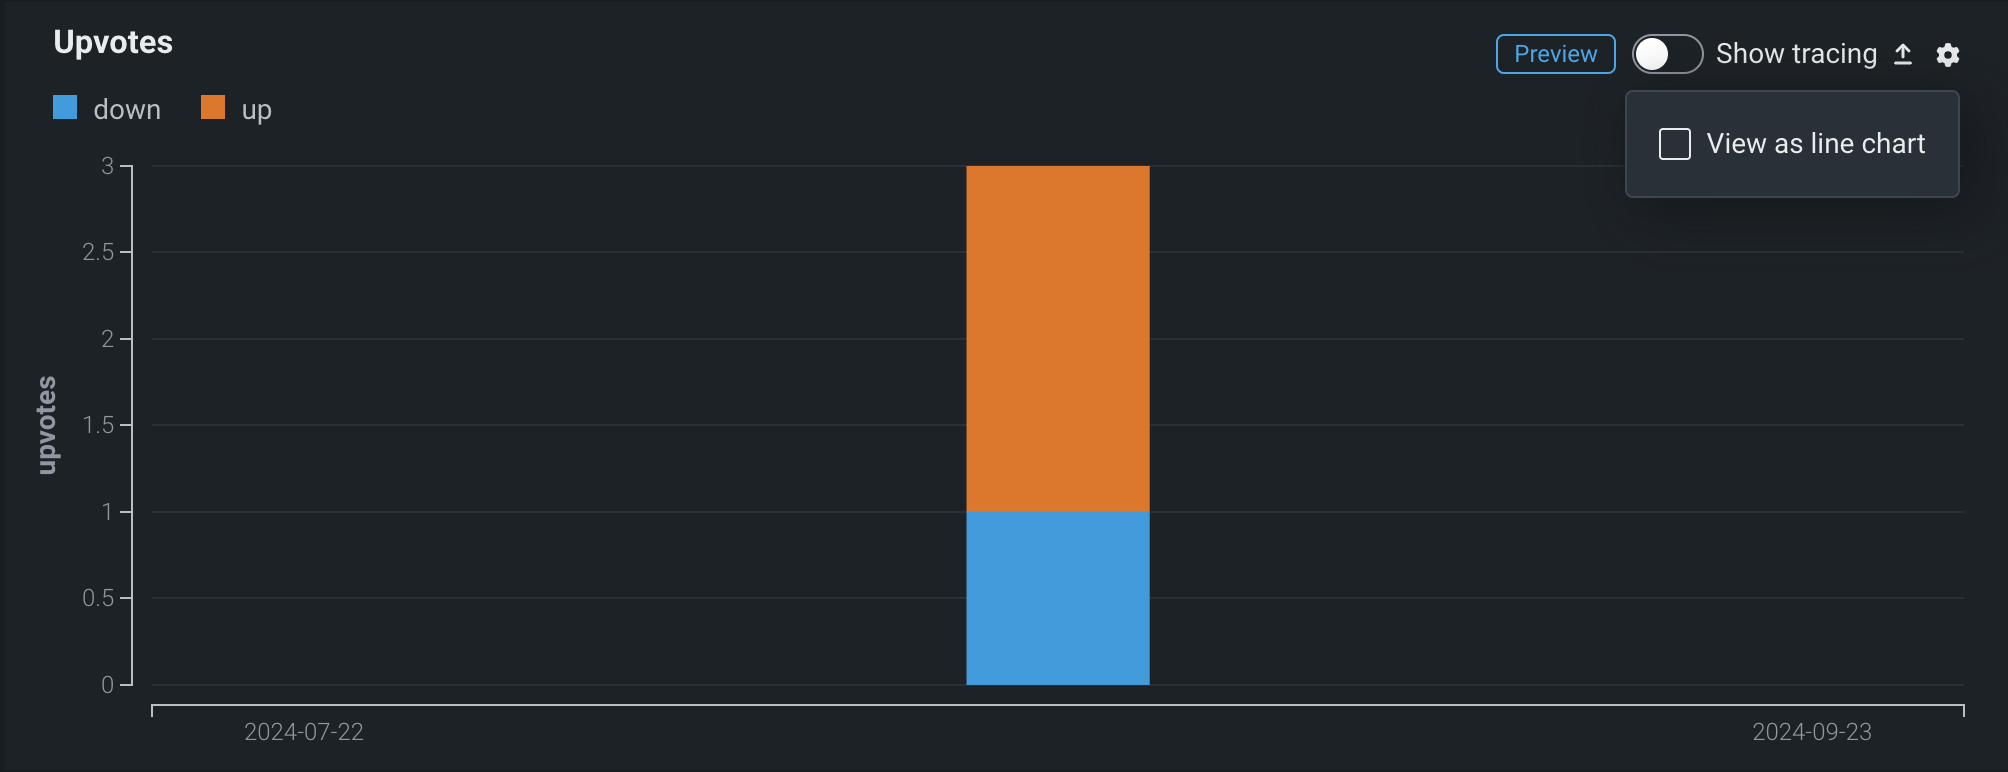
カテゴリー指標のチャートタイプの選択
カテゴリーの外部カスタム指標を追加した場合、カスタム指標サマリーダッシュボードの指標チャートは、折れ線グラフまたは棒グラフとして表示できます。 チャートビューを変更するには、プロット領域の右上隅にある設定アイコンをクリックしてから、折れ線グラフとして表示チェックボックスをオン(またはオフ)します。
地理空間指標のチャートタイプを選択
プレミアム機能
地理空間の監視はプレミアム機能です。 この機能を有効にする方法については、DataRobotの担当者または管理者にお問い合わせください。
地理空間特徴量の監視サポート
地理空間特徴量の監視は、二値分類、多クラス、連続値、位置のターゲットタイプでサポートされています。
地理空間指標を追加した場合、カスタム指標のサマリーダッシュボード上の指標チャートは、標準のチャートまたは地理空間チャート(地図に重ねて表示)として表示できます。 表示を変更するには、プロット領域の右上隅にある地理空間チャートを表示をクリックします。
デプロイデータトレースの探索
プレミアム機能
トレースはプレミアム機能です。 この機能を有効にする方法については、DataRobotの担当者または管理者にお問い合わせください。
カスタムまたは外部モデルのデプロイのカスタム指標タブで、カスタム指標チャートのヘッダーのトレースを表示をクリックして、デプロイのトレースデータを表示します。
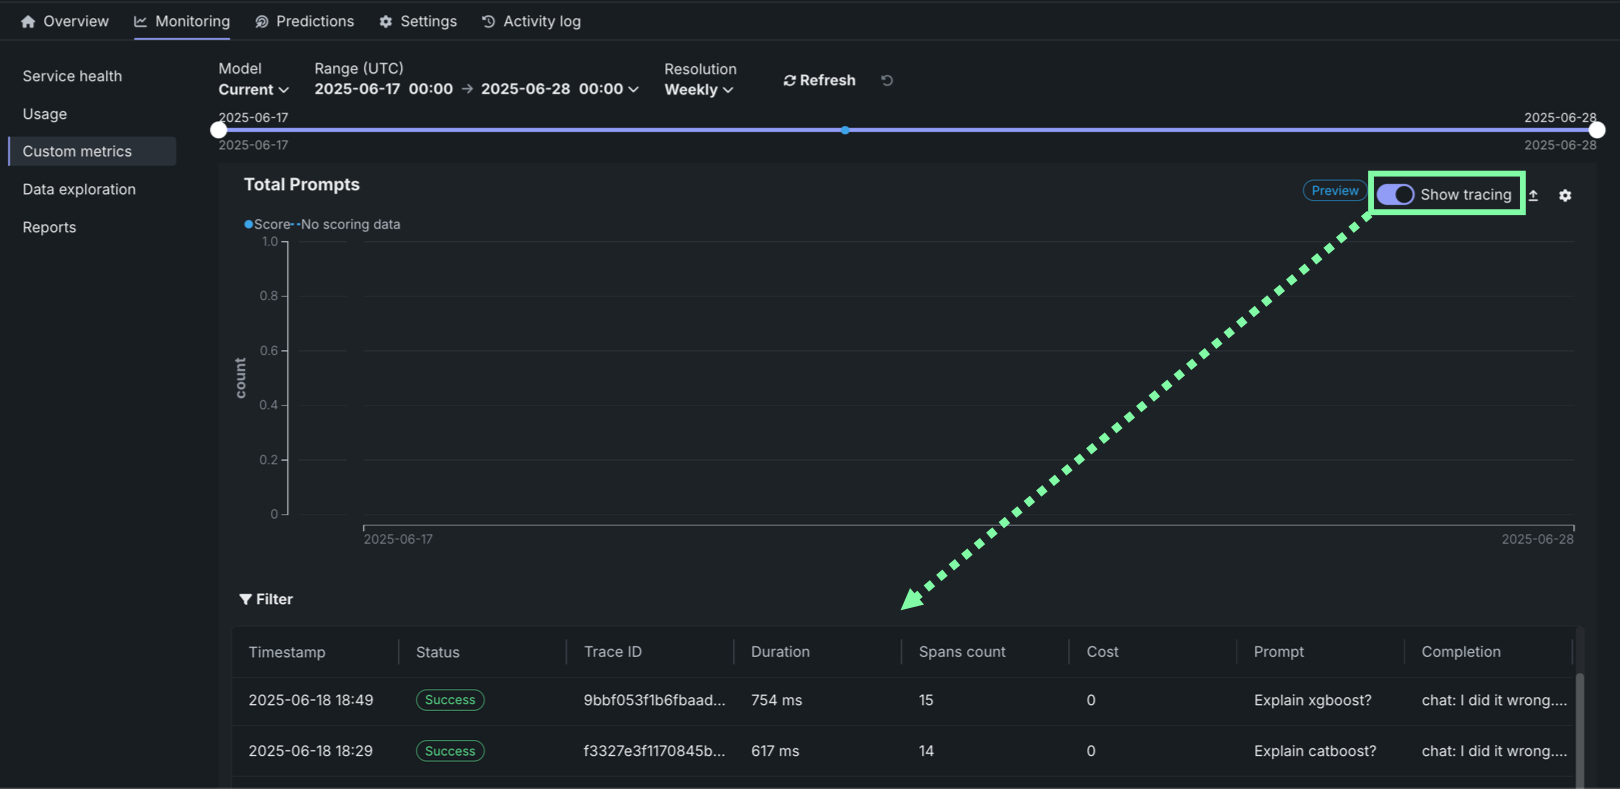
トレースは、モデルまたはエージェントのワークフローに対するリクエストがたどった経路を表します。 DataRobotでは、トレースにOpenTelemetryフレームワークを使用しています。 トレースは、起点から解決まで、リクエストのエンドツーエンドの経路全体を追跡します。 各トレースには、ルートスパンから始まる1つ以上のスパンが含まれます。 ルートスパンはリクエストの経路全体を表し、プロセスの各ステップの子スパンが含まれます。 ルート(または親)スパンと各子スパンは、同じトレースIDを共有します。
アクセスと保持
トレーステーブルは、すべてのカスタムモデルおよび外部モデルのデプロイで利用できます。
保持期間は、システム管理者が組織レベルで設定し、その組織内のすべてのユーザーに適用されます。 ポリシーが明示的に設定されていない場合、トライアル版利用の組織には14日間のポリシーが、有料版利用の組織には30日間のポリシーが適用されます。 管理者は、シグナルタイプ(トレース、ログ、メトリクス)ごとに、保持期間を14、30、60、90、180、または360日に設定できます。
組織の保持期間設定を確認または変更するには、OTelの保持期間の設定を参照してください。
トレーステーブルでは、各トレースに関連する以下のフィールドを確認できます。
| 列 | 説明 |
|---|---|
| タイムスタンプ | YYYY-MM-DD HH:MM形式でのトレースの日時。 |
| ステータス | すべてのスパンを含むトレースの全体的なステータス。 依存タスクが失敗した場合、ステータスはエラーになります。 |
| トレースID | トレースの一意の識別子。 |
| 期間 | トレースの完了にかかった時間(ミリ秒単位)。 この値は、(四捨五入された)ルートスパンの期間と同じで、子スパンによって表されるすべてのアクションが含まれます。 |
| スパン数 | トレースに含まれる完了したスパン(アクション)の数。 |
| コスト | コストデータが指定されている場合は、トレースの総コスト。 |
| プロンプト | トレースに関連するユーザープロンプト。 |
| 補完 | トレースのプロンプトに関連付けられているエージェントまたはモデルの回答(補完)。 |
| ツール | トレースで表されたリクエスト中に呼び出されるツールまたはツール群。 |
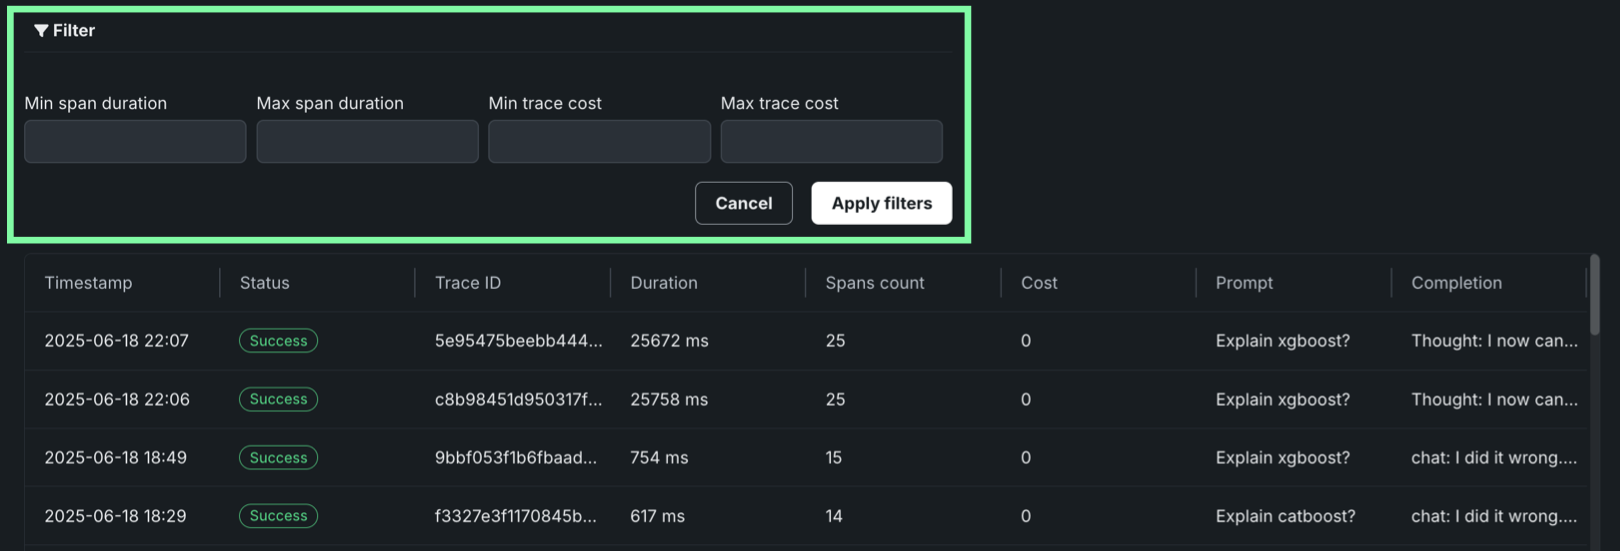
フィルターをクリックして、最小スパン期間、最大スパン期間、最小トレースコスト、最大トレースコストでフィルターします。 スパンフィルターの単位はナノ秒(ns)です。チャートにはスパンがミリ秒(ms)で表示されます。
フィルターのアクセシビリティ
スパンが詳細ビューに展開されると、 フィルターボタンは非表示になります。 フィルターを適用したチャートビューに戻るには、 詳細パネルを表示しないをクリックします。
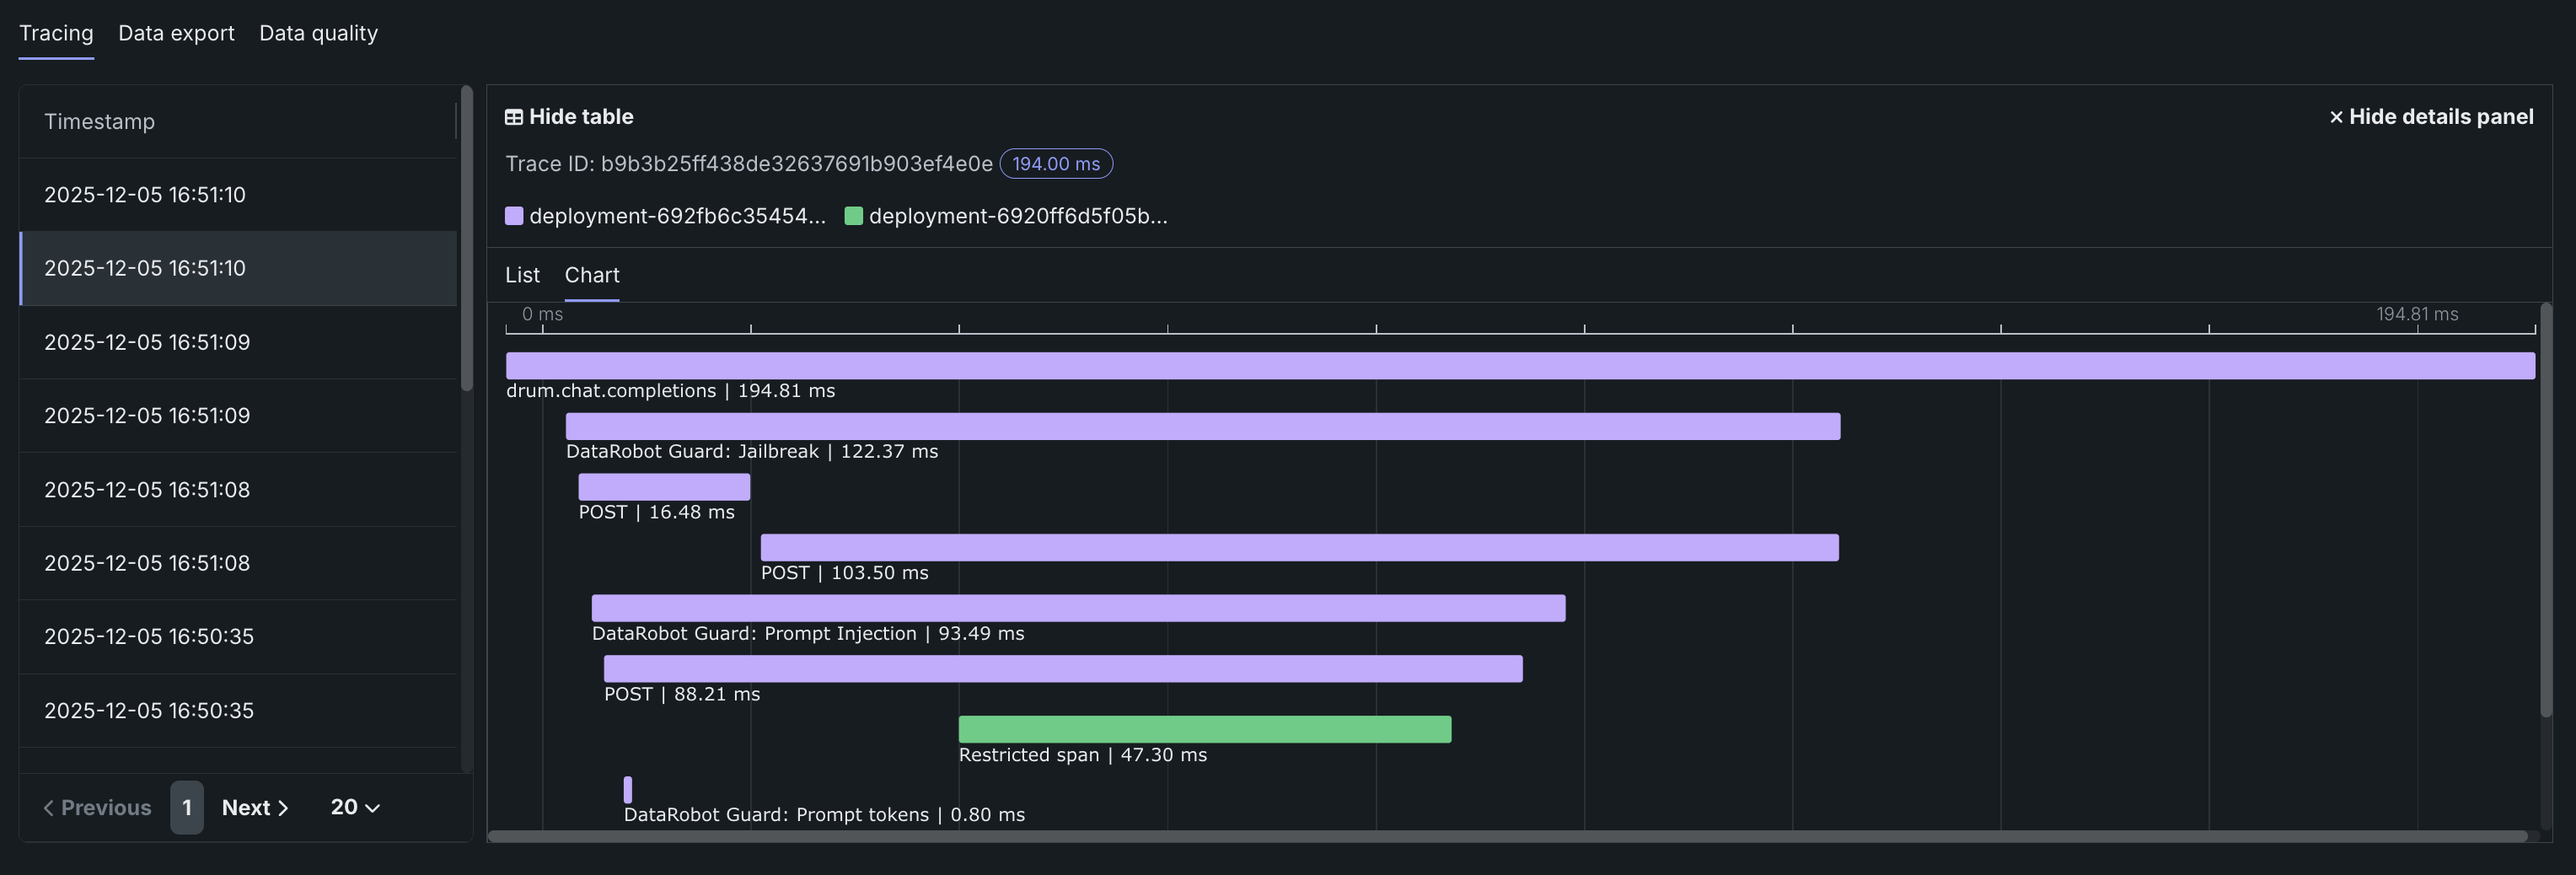
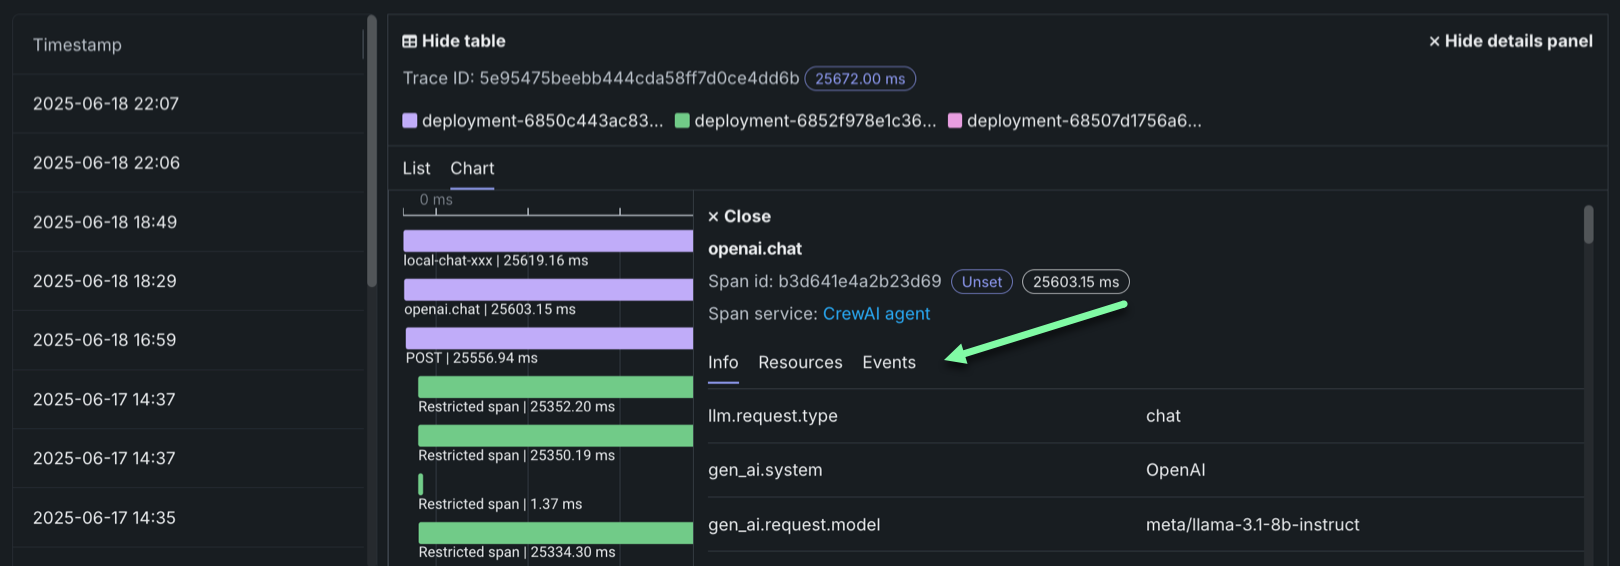
トレースに含まれるスパンとトレースの詳細を確認するには、トレーステーブルのトレース行をクリックします。 スパンの色は、スパンサービス(通常はデプロイ)に対応します。 スパンに関連付けられたデプロイまたはサービスへのアクセス権がない場合、制限されたスパンが表示されます。 スパンはチャート形式またはリスト形式で表示できます。
スパンの詳細をコントロール
どちらのビューからでも、 テーブルを表示しないをクリックしてタイムスタンプテーブルを折りたたんだり、 詳細パネルを表示しないをクリックして展開されたトレーステーブルビューに戻ったりすることができます。
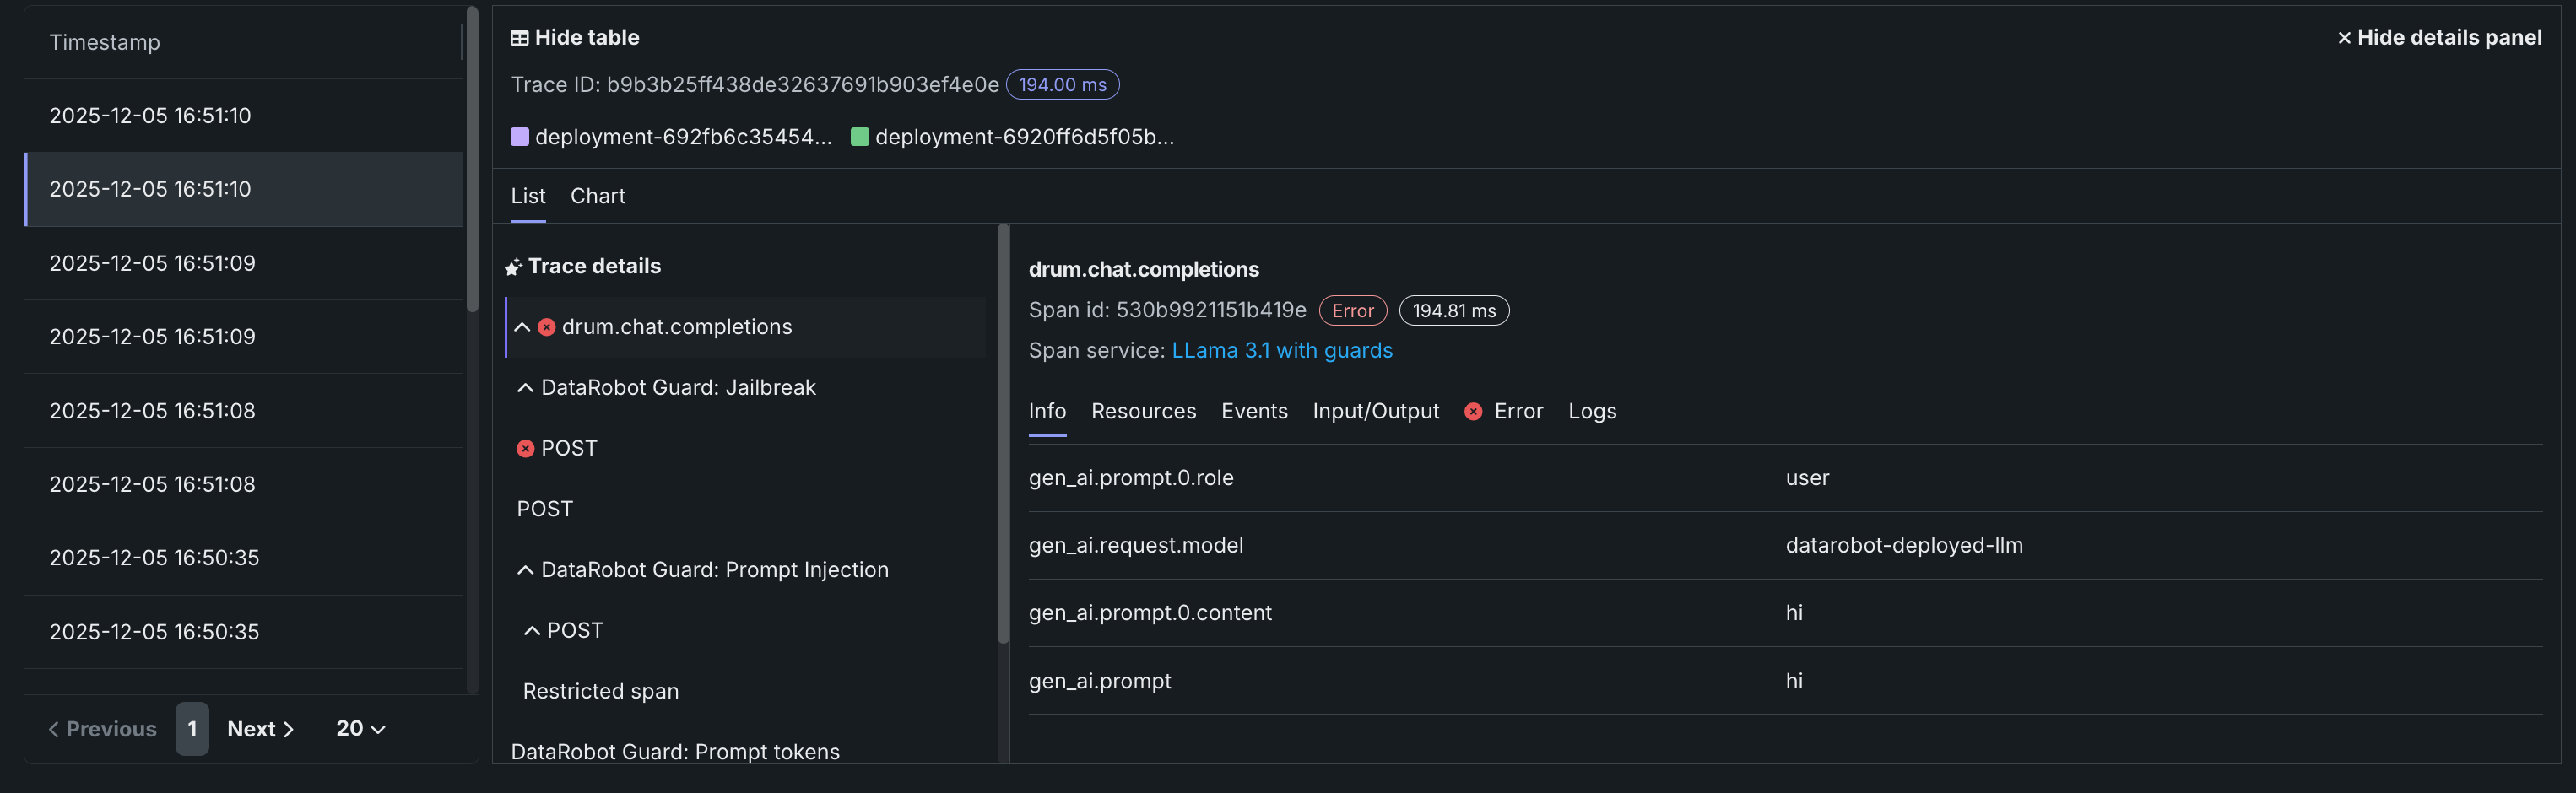
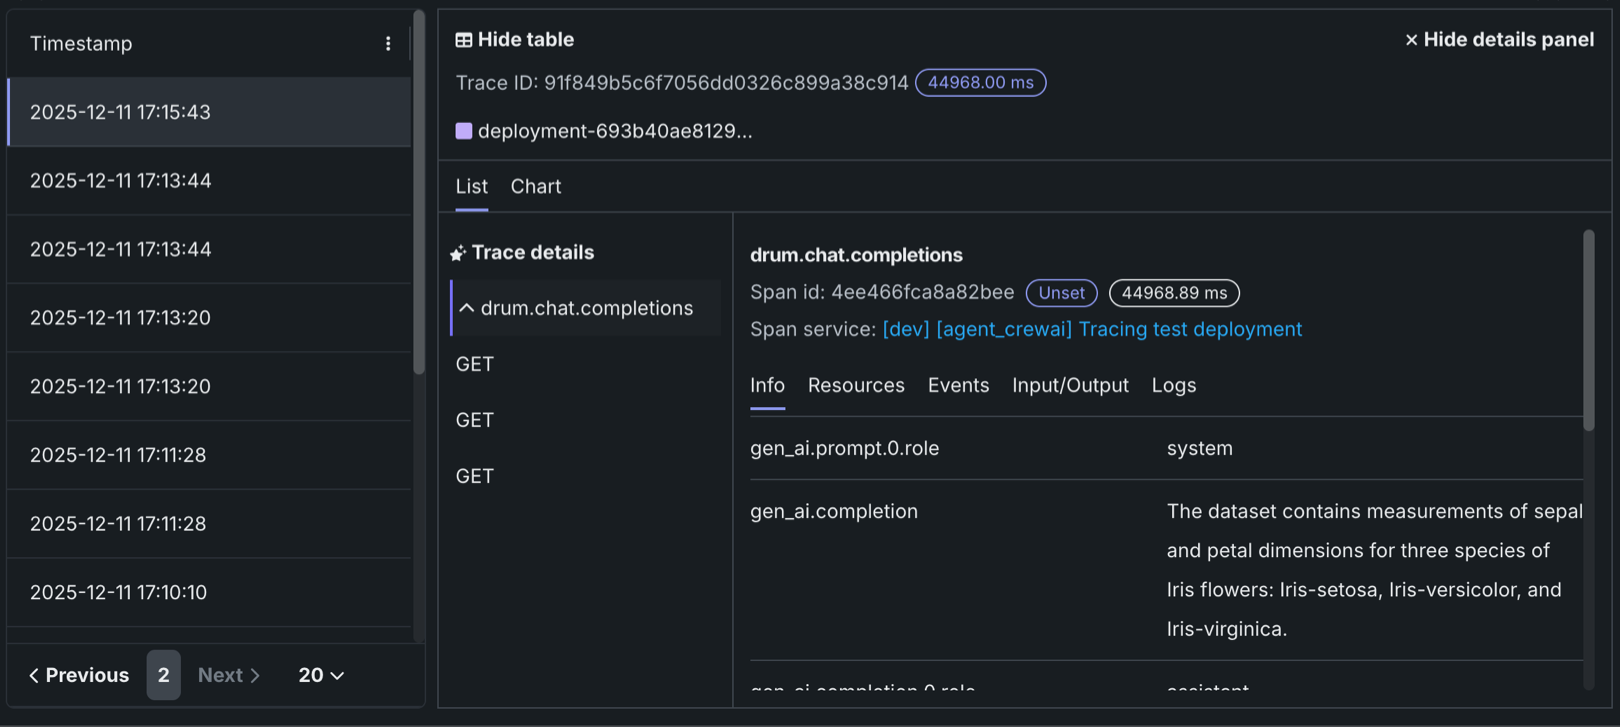
トレースの詳細
リストビューでトレースの詳細をクリックすると、現在のスパンに関連付けられているトレースに関する入力/出力(プロンプトと補完)および評価の詳細を表示できます。
どちらのビューでも、スパンサービス名をクリックして、デプロイまたはリソースにアクセスします(アクセス権がある場合)。 生成AIモデルまたはエージェントワークフローの設定に応じた追加情報を、情報、リソース、イベント、入力/出力、エラー、ログの各タブで入手できます。 エラータブは、トレースでエラーが発生した場合にのみ表示されます。
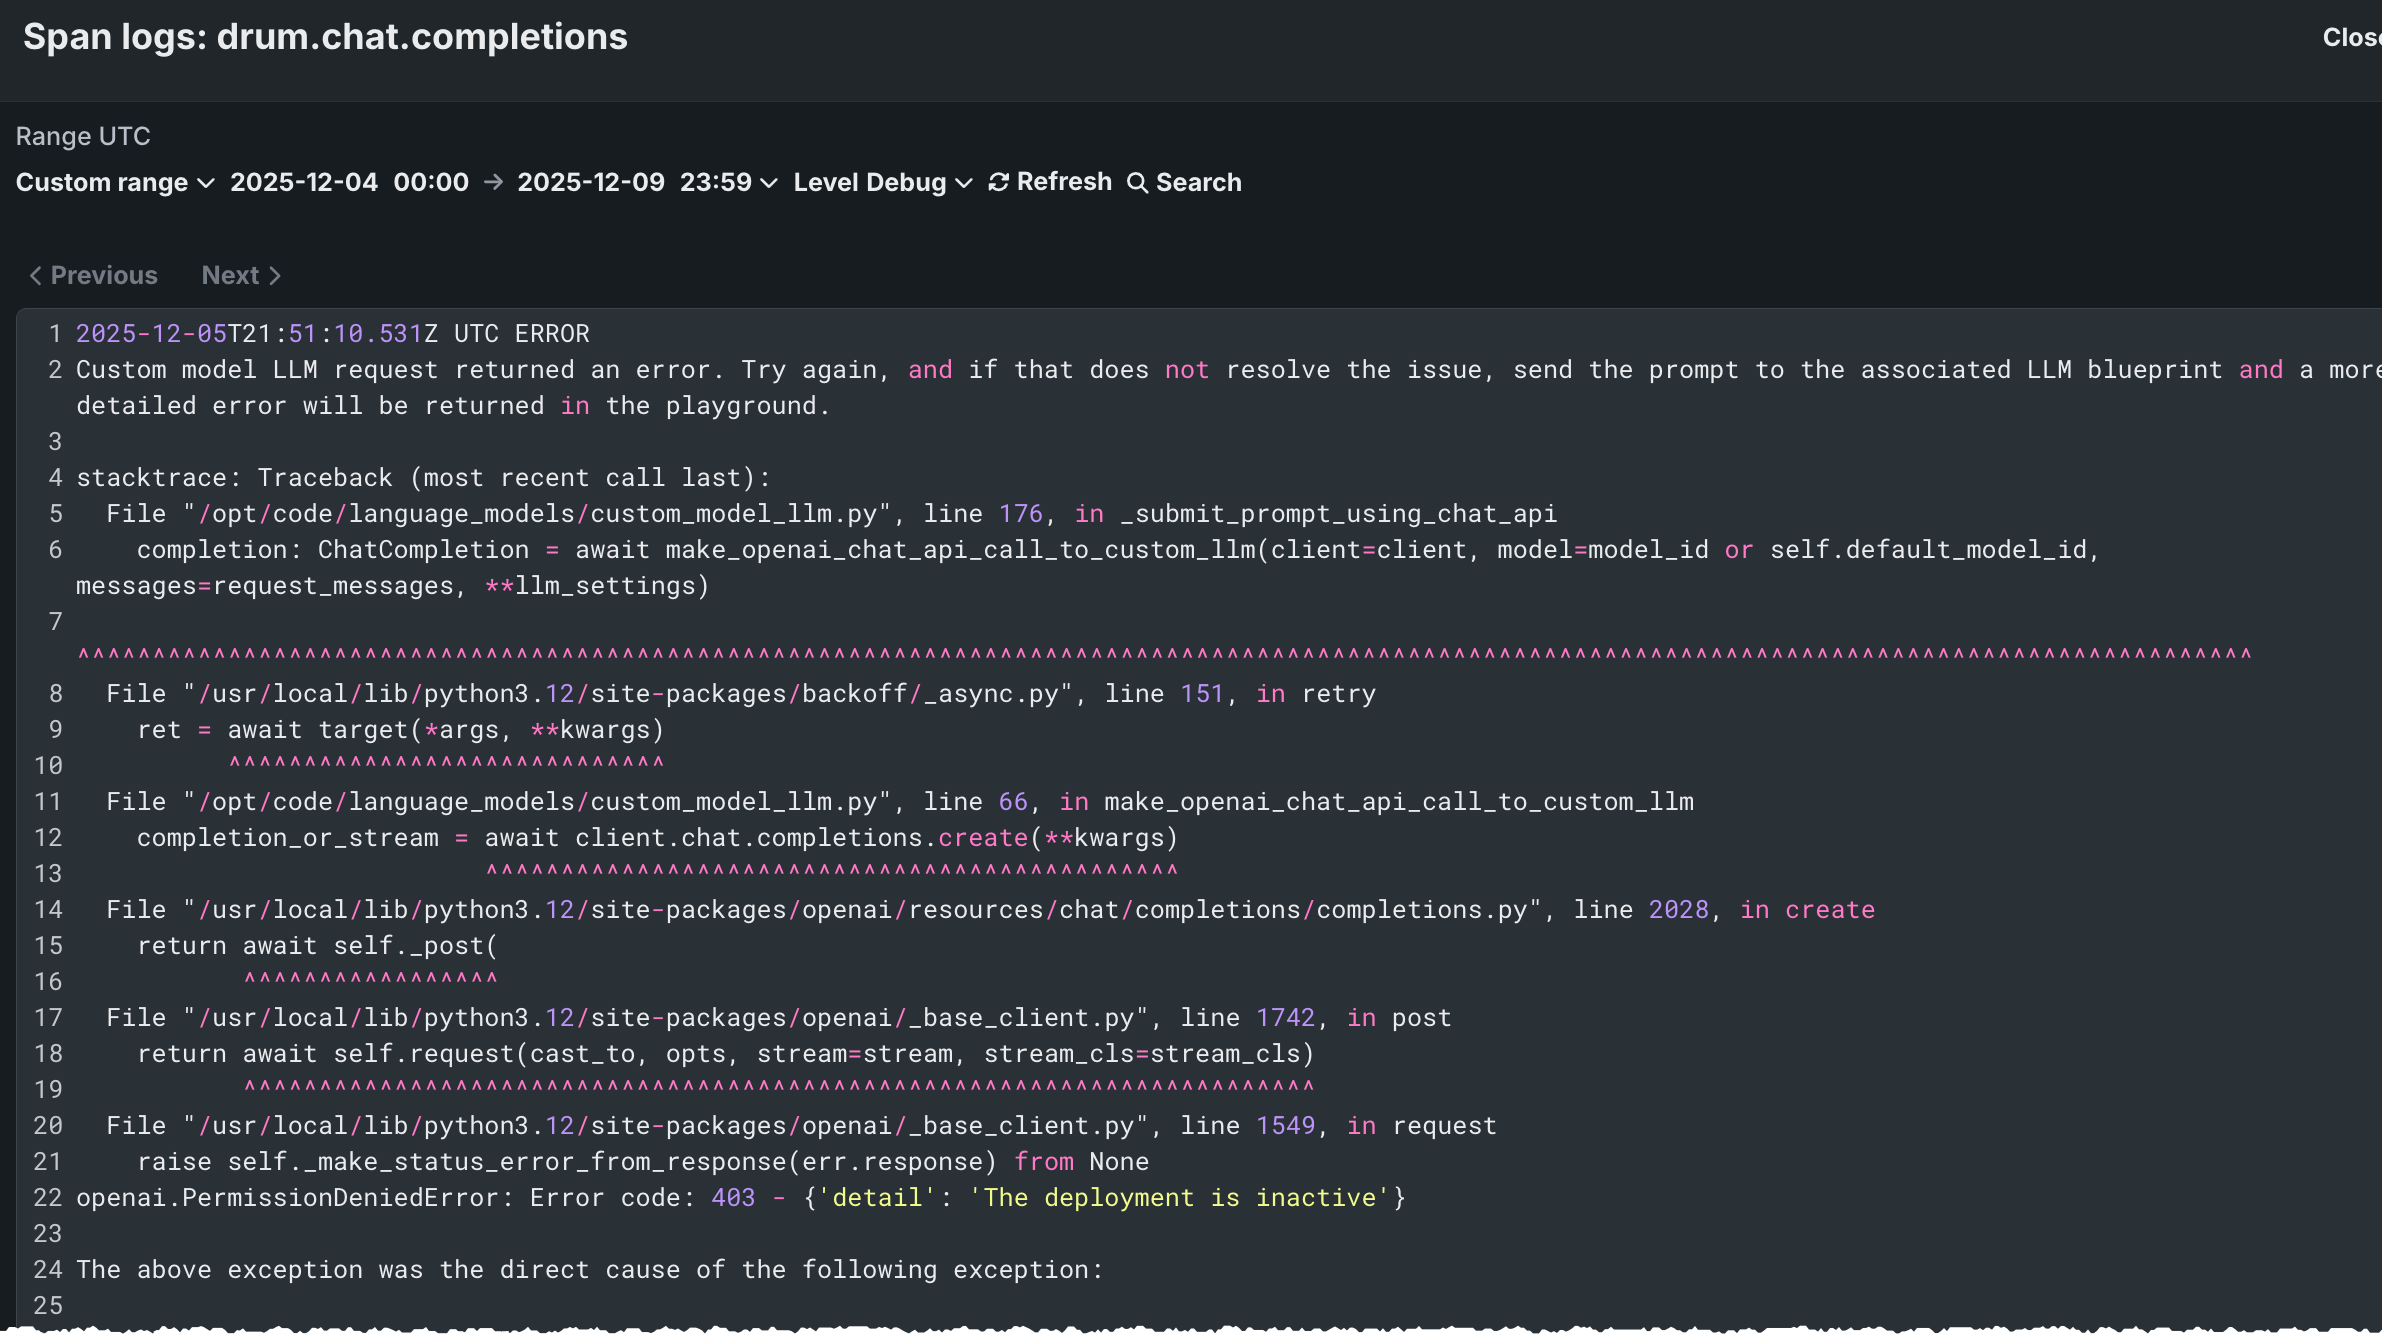
トレースログをフィルター
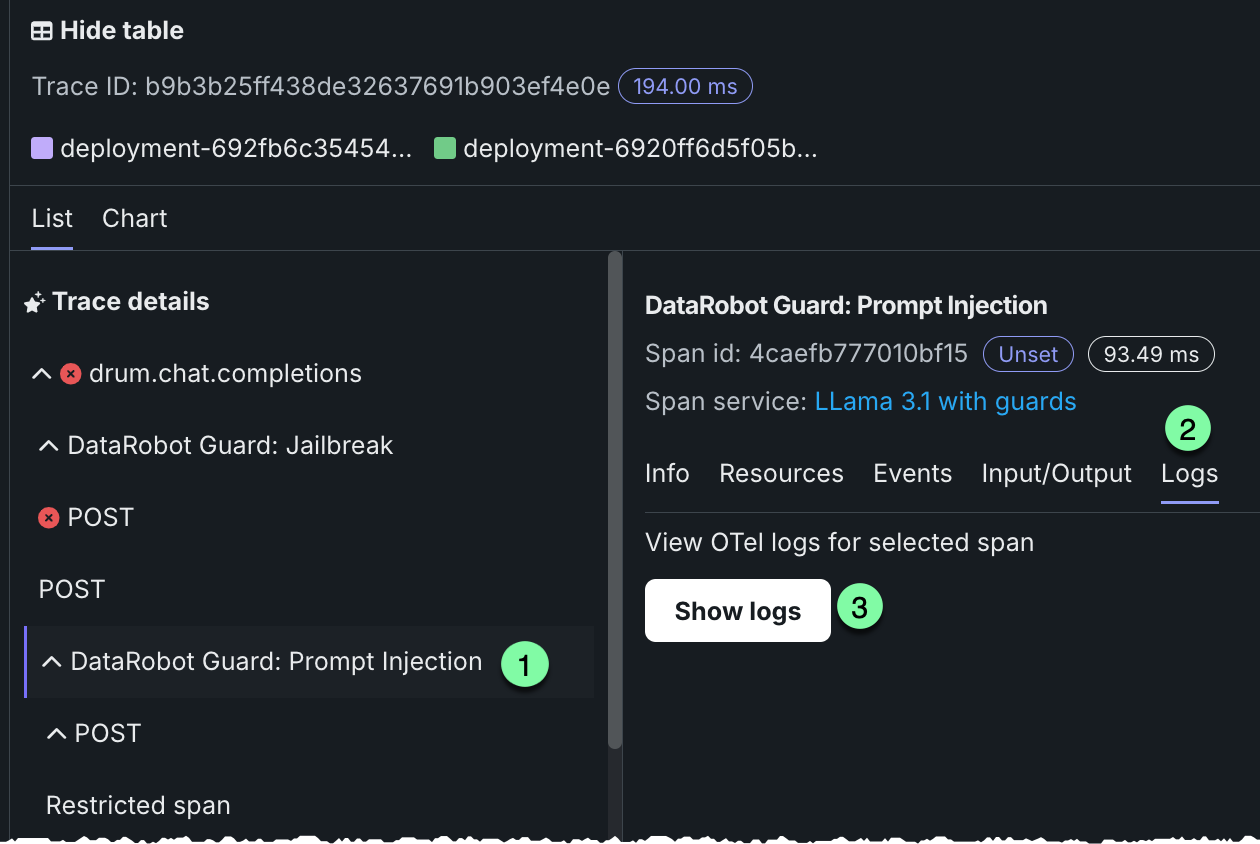
リストビューから、スパンのOTelログを表示できます。 表示される結果は完全なデプロイログのサブセットであり、以下のようにアクセスされます。
-
リストビューを開き、トレースの詳細でスパンを選択します。
-
ログタブをクリックします。
-
ログを表示をクリックします。
トレーステーブルのOTel属性
コスト、プロンプト、補完、およびツールについては、DataRobotはトレースに属するすべてのスパンにわたる特定のスパン属性を読み取ります。 その他の列(タイムスタンプや期間など)は、これらの属性ではなく、トレースおよびスパンのメタデータから取得されます。
| 列 | OpenTelemetryのマッピング |
|---|---|
| コスト | トレース内のスパンにある datarobot.moderation.cost属性の数値を合計します(その属性が存在する場合)。 |
| プロンプト | gen_ai.prompt属性を使用します。 複数のスパンにgen_ai.promptが含まれている場合、トレース順で最初に検出された値が表示されます。 |
| 補完 | gen_ai.completion属性を使用します。 複数のスパンにgen_ai.completionが含まれている場合、トレース順で最後に検出された値が表示されます。 |
| ツール | トレース内のスパンで検出されたtool_name属性の一意の値をすべて収集し、それらのツール名を列に一覧表示します。 |
属性キーは完全に一致する必要があります(gen_ai内のアンダースコアも含みます)。 genai.promptやGenAI.promptといった名前は、プロンプトおよび補完列では読み込まれません。
自動計装(DataRobotのエージェントテンプレートを含む)では、多くの場合、gen_ai.prompt、gen_ai.completion、そして場合によってはtool_nameが設定されます。 カスタムモデルや外部モデルの場合、フレームワークが異なります。ツールが実行されても(たとえば、一部のLangGraphコールバックフロー)、実行時にtool_nameが出力されない場合があります。 その場合、プロンプトと補完には値を設定できますが、ツールについては、ツール内で実行されるスパンにtool_nameが設定されるまでは空のままになります。トレースの実装を参照してください。