Debugging agents in PyCharm
Debugging agent code is essential for understanding execution flow, inspecting variables, and troubleshooting issues during development. After you clone the repository, PyCharm will automatically have a Run Agent run/debug configuration that points to the dev.py script in your agent directory. This script starts the agent development server and gives you an immediate way to run or debug your agent without wiring up a remote debug server.
This guide walks you through configuring PyCharm to use your agent's virtual environment, running the autogenerated Run Agent configuration, and attaching the debugger while you execute prompts with the CLI.
Prerequisites
Before setting up PyCharm debugging, ensure you have:
- PyCharm Professional: Required for full debugging support
- Agent application setup: Completed the installation and run
dr startto prepare your local environment - Environment configured: Your
.envfile is properly configured withDATAROBOT_API_TOKENandDATAROBOT_ENDPOINT
Configure Python interpreter
Before you can debug your agent, you need to configure PyCharm to use the correct Python interpreter for your agent environment.
Run dr start first
You must run dr start before configuring the Python interpreter. This command initializes your workspace and sets up your local virtual environment.
Set up the Python interpreter
- Open your agent templates repository in PyCharm.
- Navigate to PyCharm > Settings.
- Go to Python > Interpreter.
-
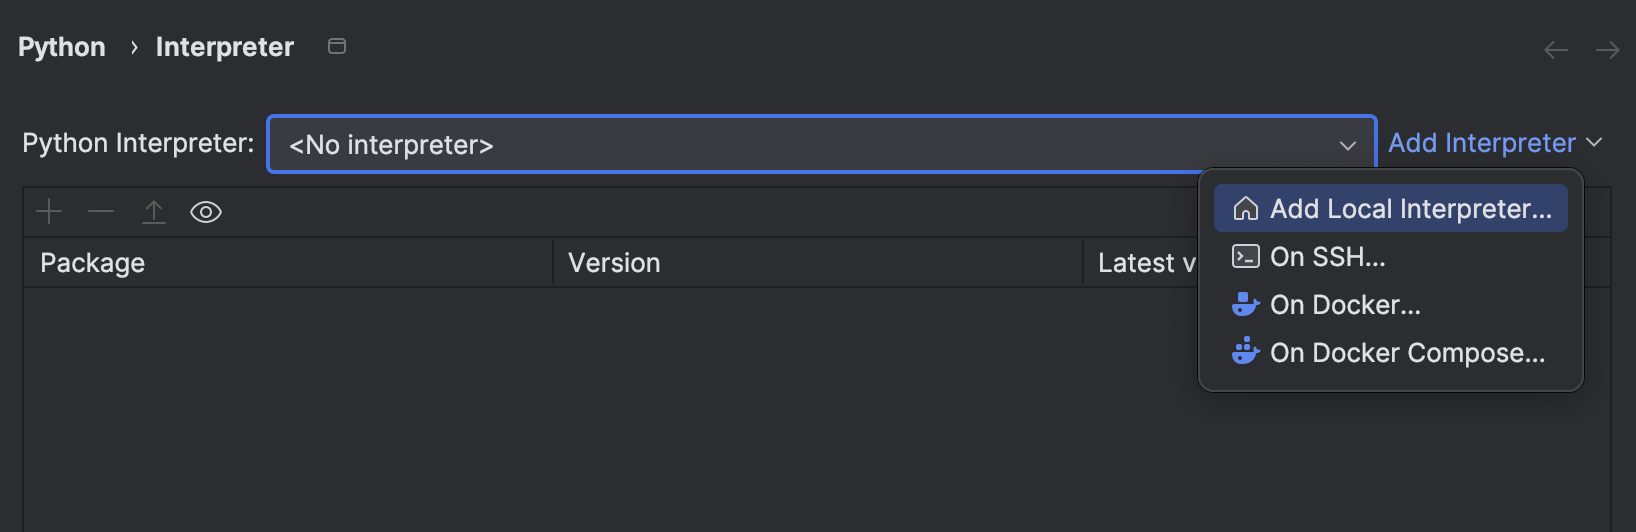
Click the Python Interpreter dropdown (it may show No interpreter) and select Add Interpreter > Add Local Interpreter.
-
In the Add Python Interpreter dialog, select Select existing and choose Python as the type. Select your agent's virtual environment Python executable in the
.venvpath of your agent framework. (The virtual environment is created byuvwhen you rundr startortask install). The example workflow in the DataRobot Agentic Starter repository creates two agents: Planner Agent (content planning) and Writer Agent (content writing). For example, the interpreter path for your agent directory should look like:$workspace/agent/.venv/bin/python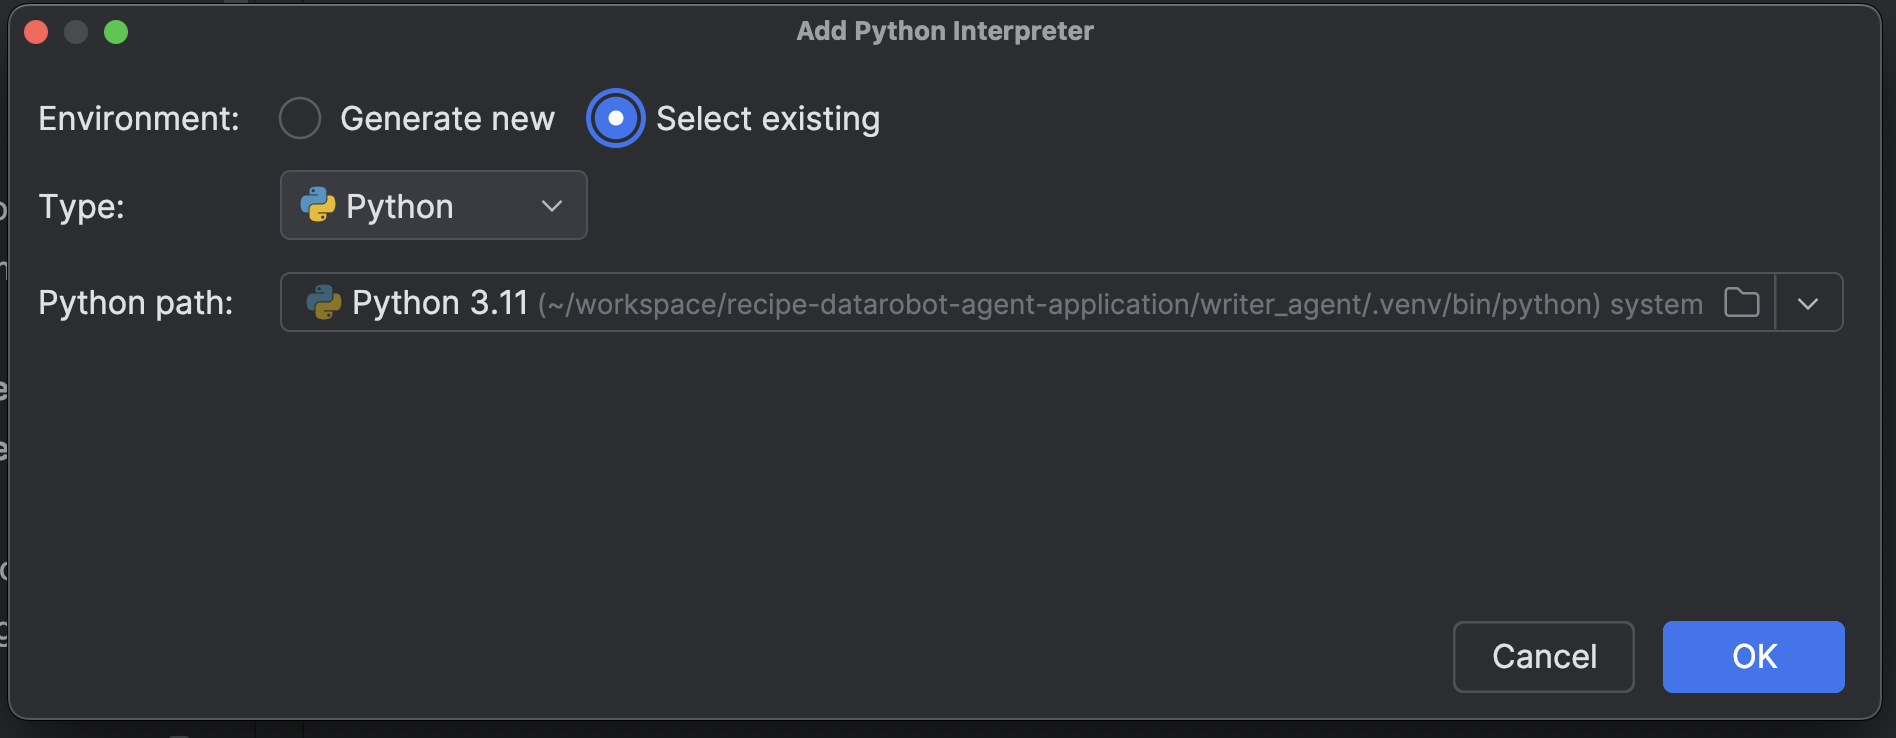
PyCharm will use this interpreter for running and debugging your agent code, ensuring all dependencies are correctly resolved.
Use the Run Agent configuration
The Run Agent configuration launches the agent development server with your environment variables and interpreter already wired up.
- Open Run > Edit Configurations to review the configurations for Run Agent.
- Ensure the configuration points to your agent's
dev.pyscript, sets the working directory to the agent folder, and references your.envfile. No additional parameters are required. -
Select Run Agent from the configuration dropdown and click Run. PyCharm starts the development server and shows its console output (for example,
Running development server on http://127.0.0.1:8842).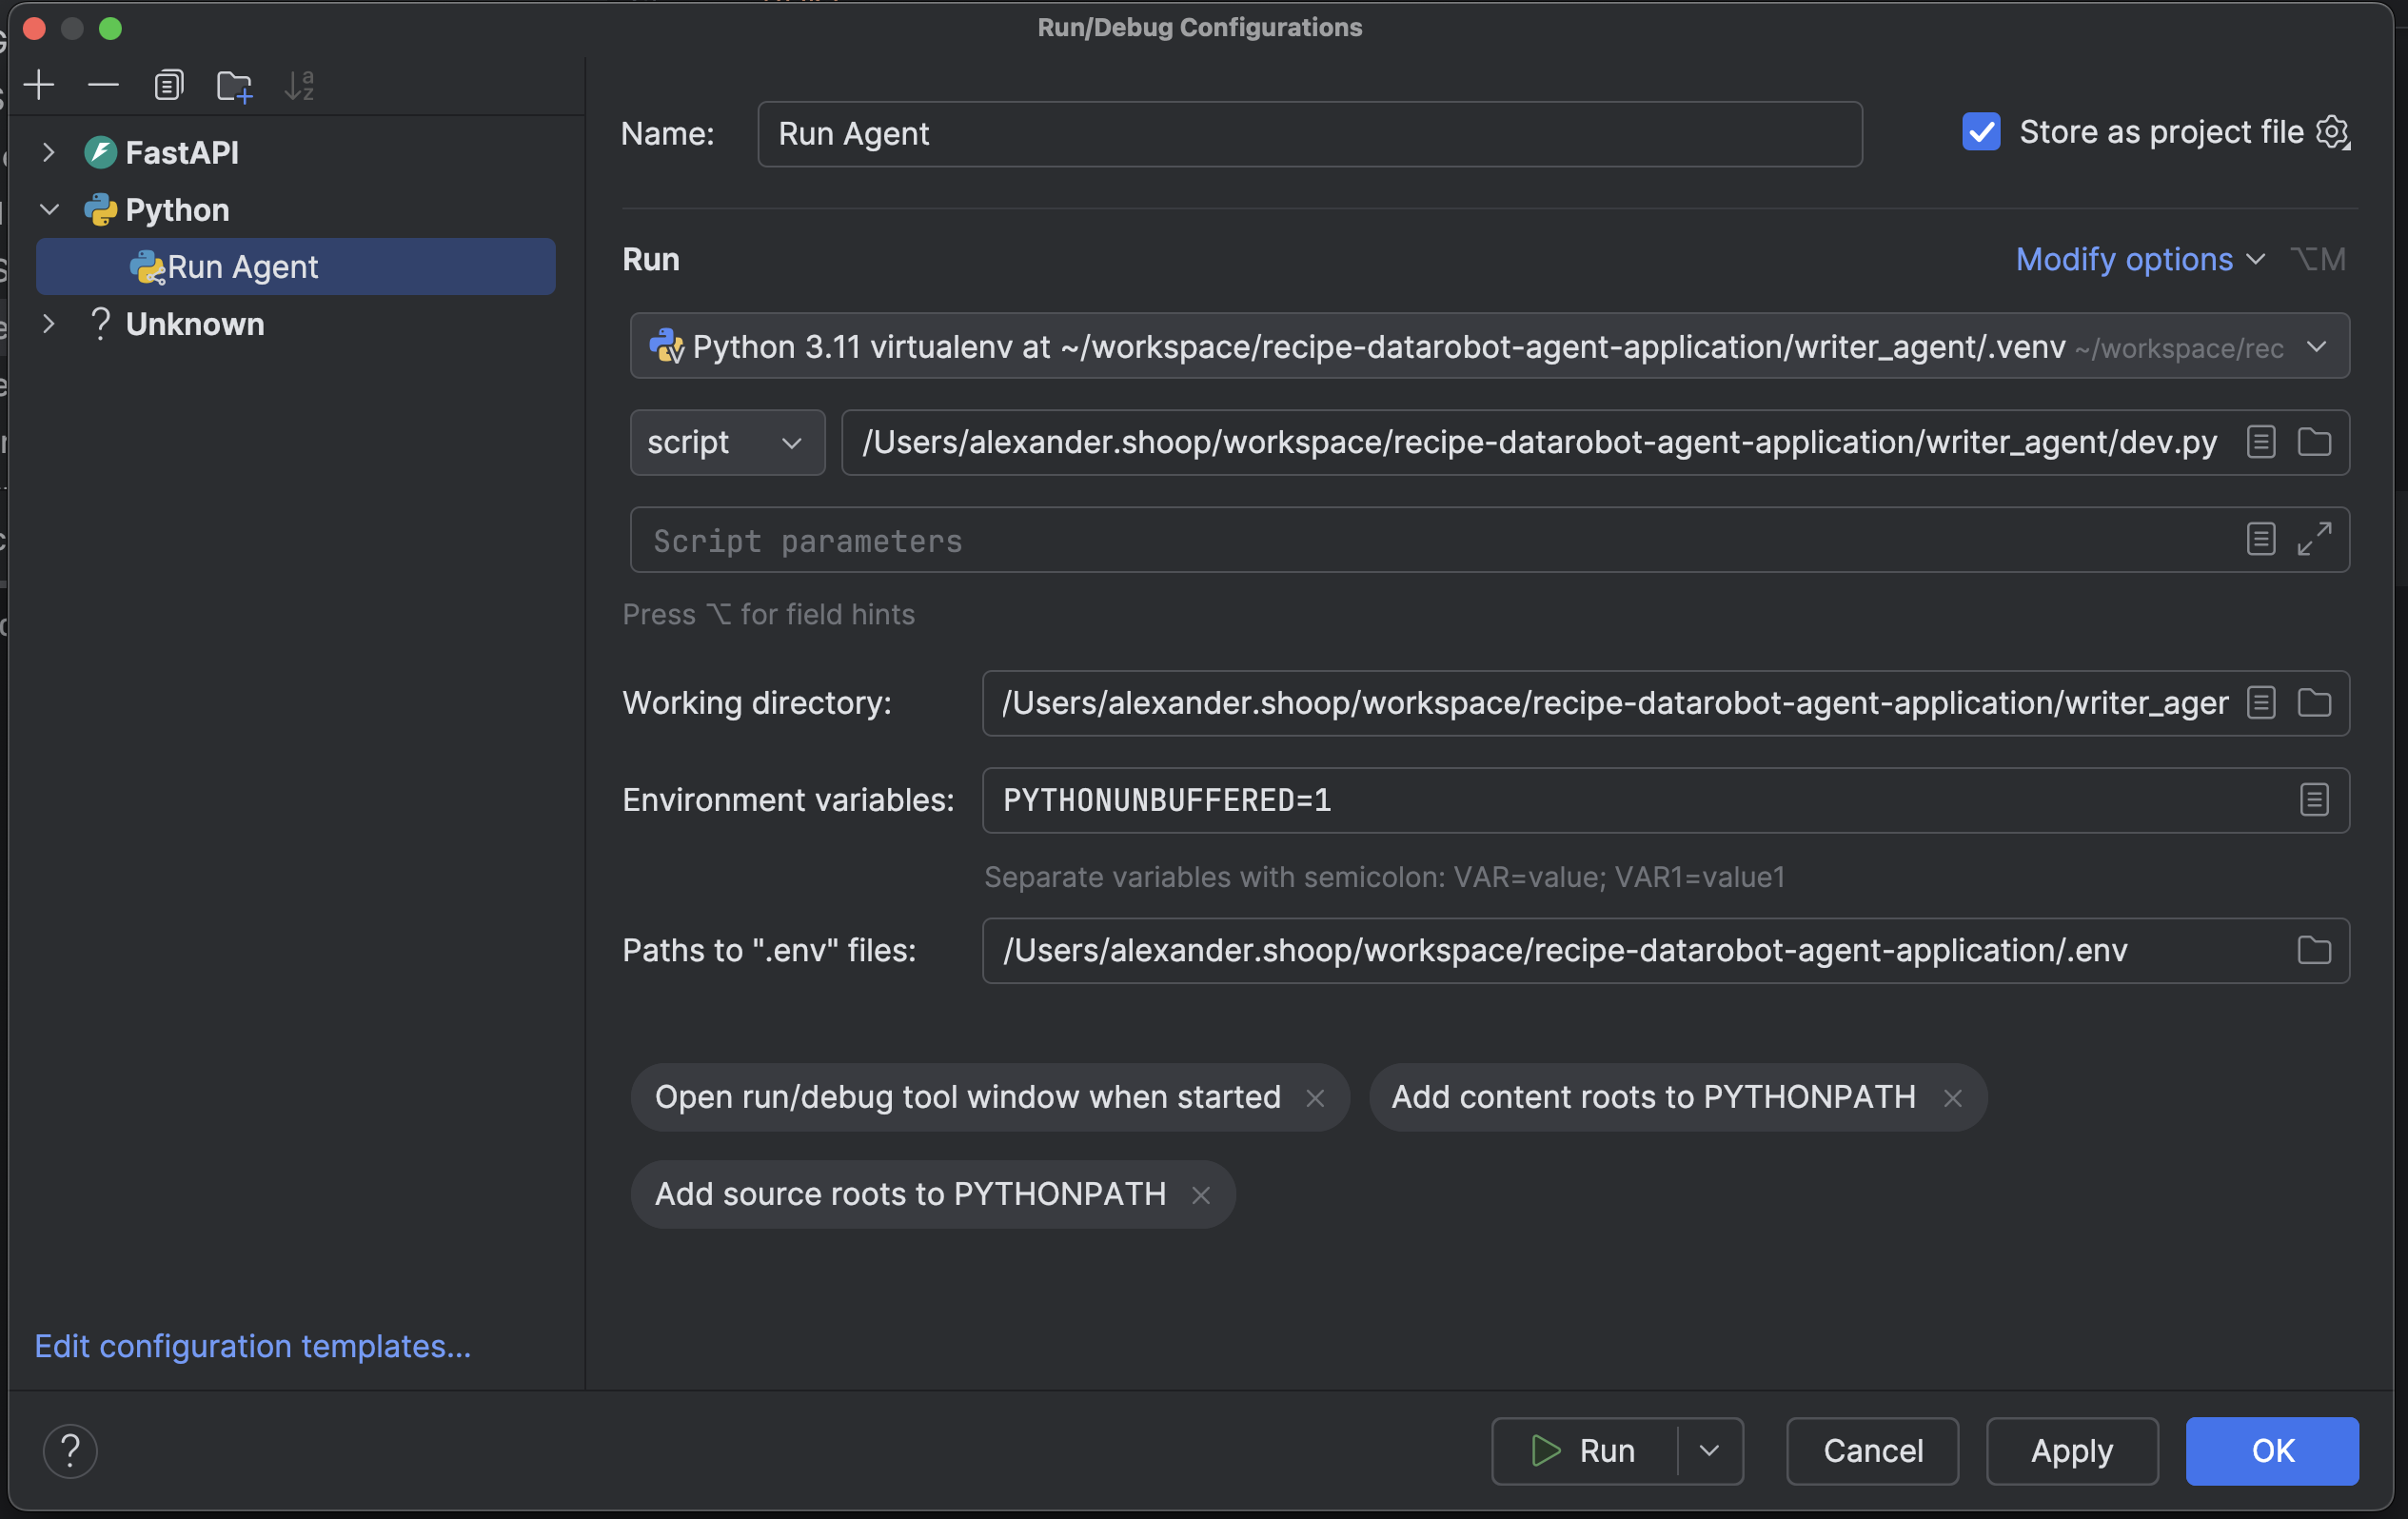
Need to recreate the configuration?
If the configuration is missing or out-of-date, create a new Python run configuration with the settings seen in the screenshot.
Trigger agent execution from the CLI
With the development server running in PyCharm, you can execute agent prompts from a terminal window.
- Open a terminal in your agent application repository root.
-
Run the CLI command for your agent:
task agent:cli -- execute --user_prompt "Artificial Intelligence" -
Watch the PyCharm console for log output as the agent processes the request. Adjust the prompt text or CLI arguments to match your scenario.
Debug with breakpoints
The same Run Agent configuration supports PyCharm's debugger.
- Set breakpoints in the files you want to inspect (for example,
agent/agent/myagent.py). -
In PyCharm, choose the Run Agent configuration and click the Debug icon (or press Shift+F9). PyCharm launches
dev.pyin debug mode and waits for incoming work.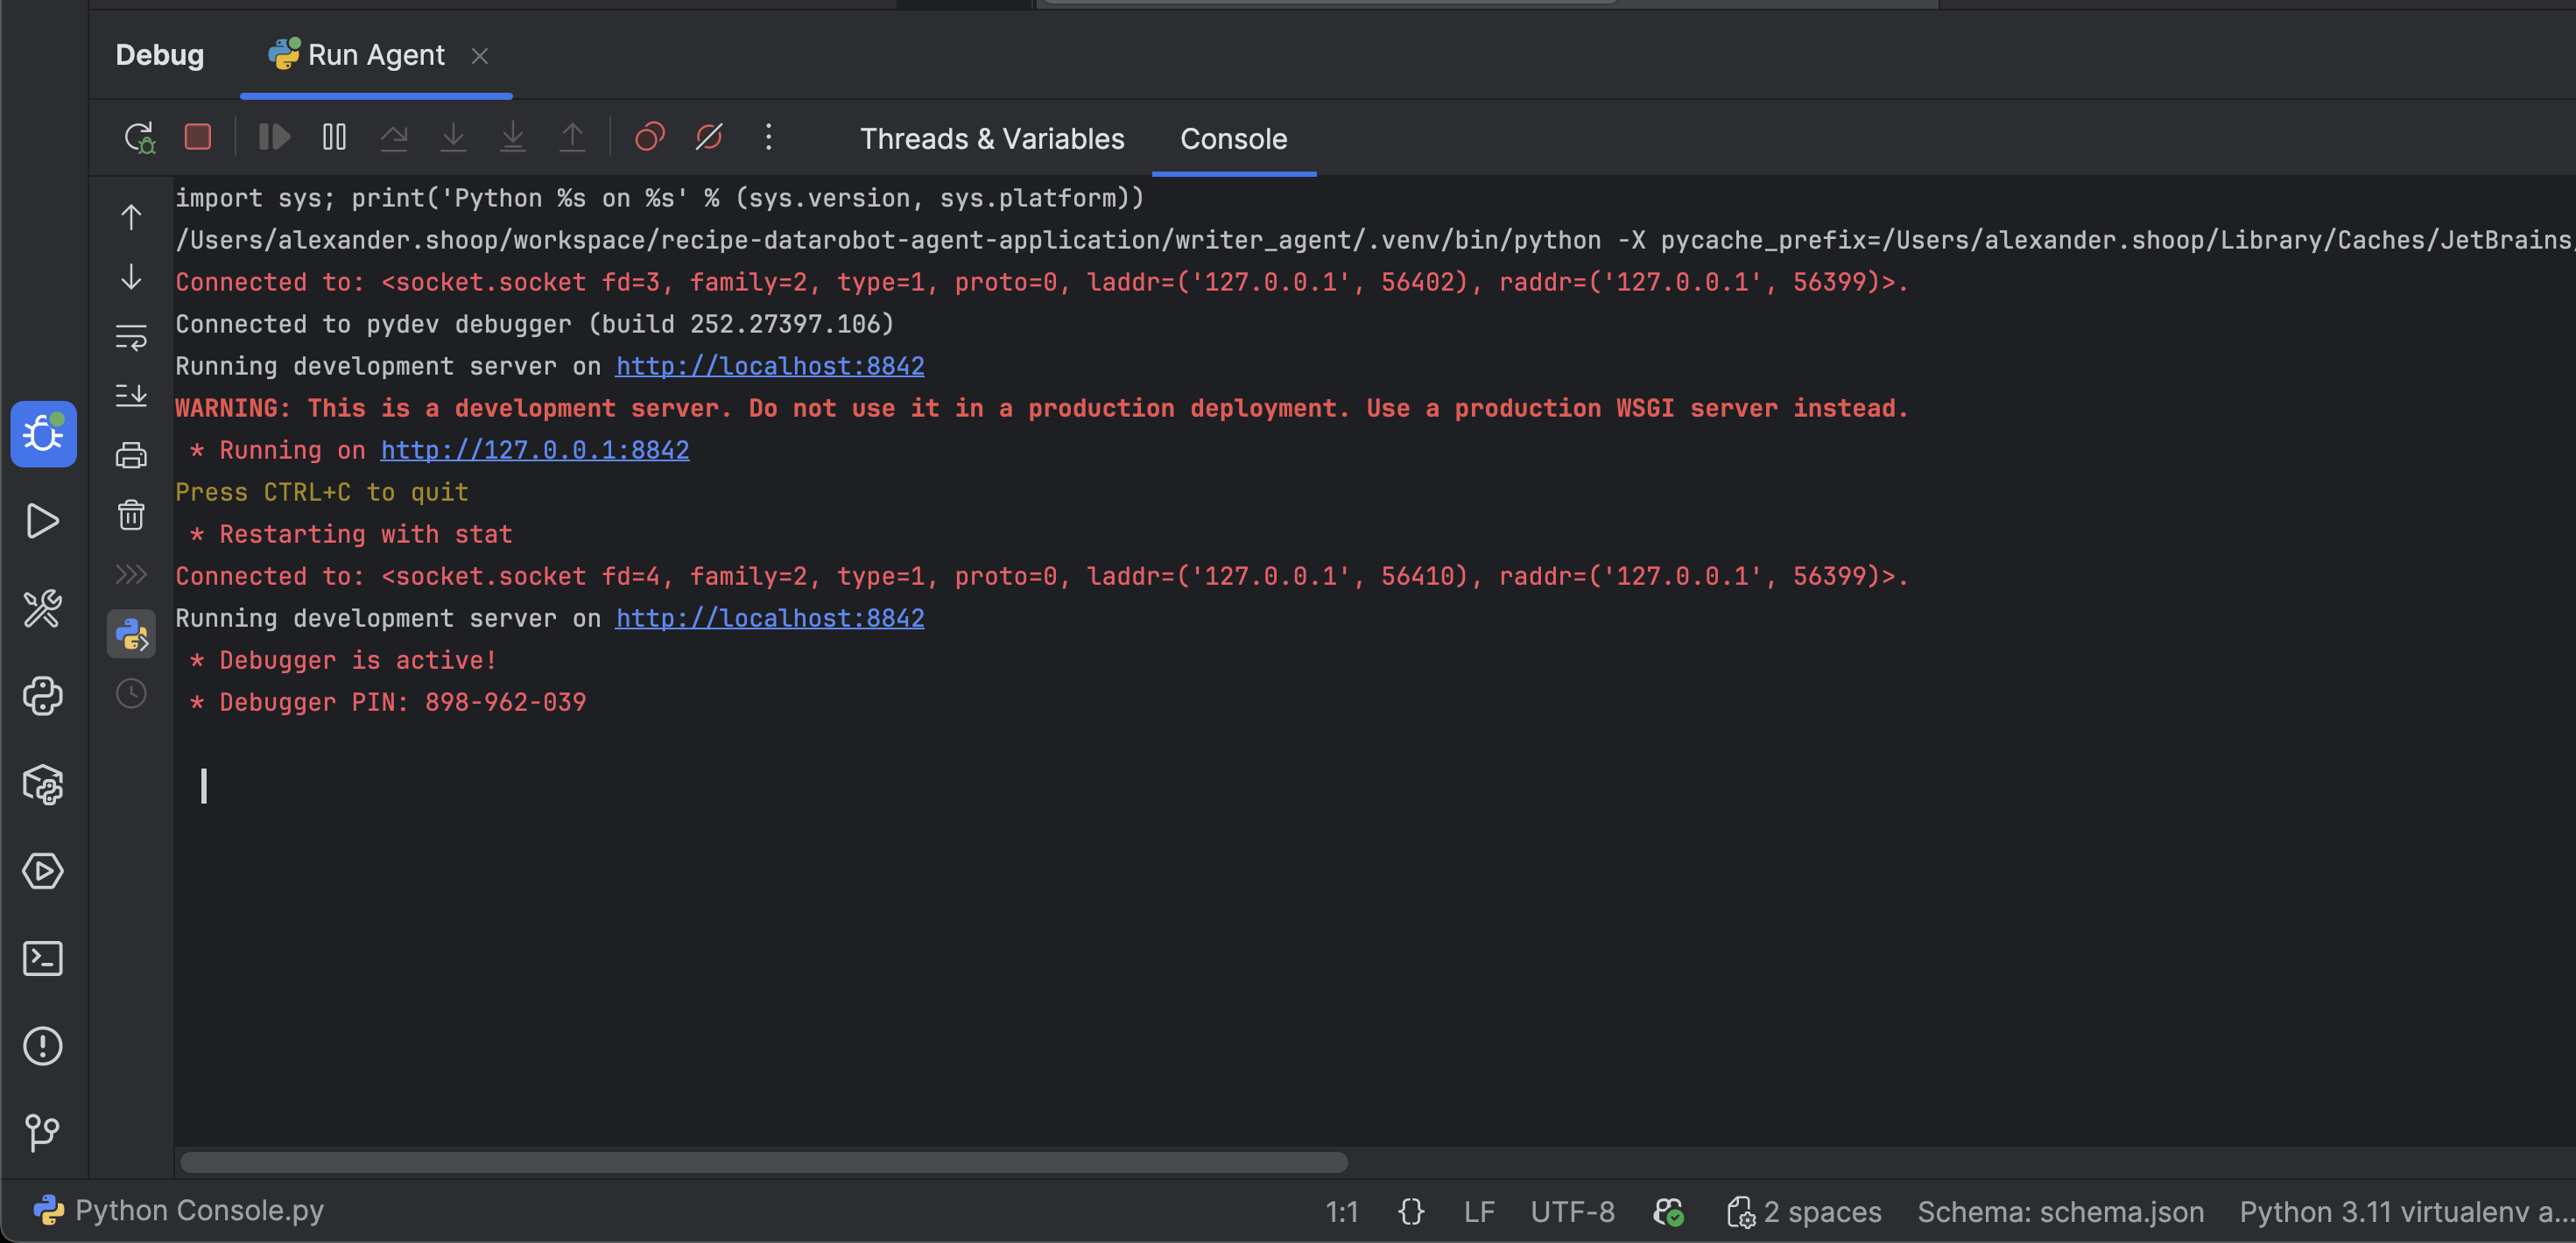
-
Re-run your CLI command. When execution reaches your breakpoint, PyCharm pauses and opens the Debug tool window so you can inspect state, step through code, and evaluate expressions.
Use debug features
Once execution stops on a breakpoint, you can use PyCharm's debugging capabilities:
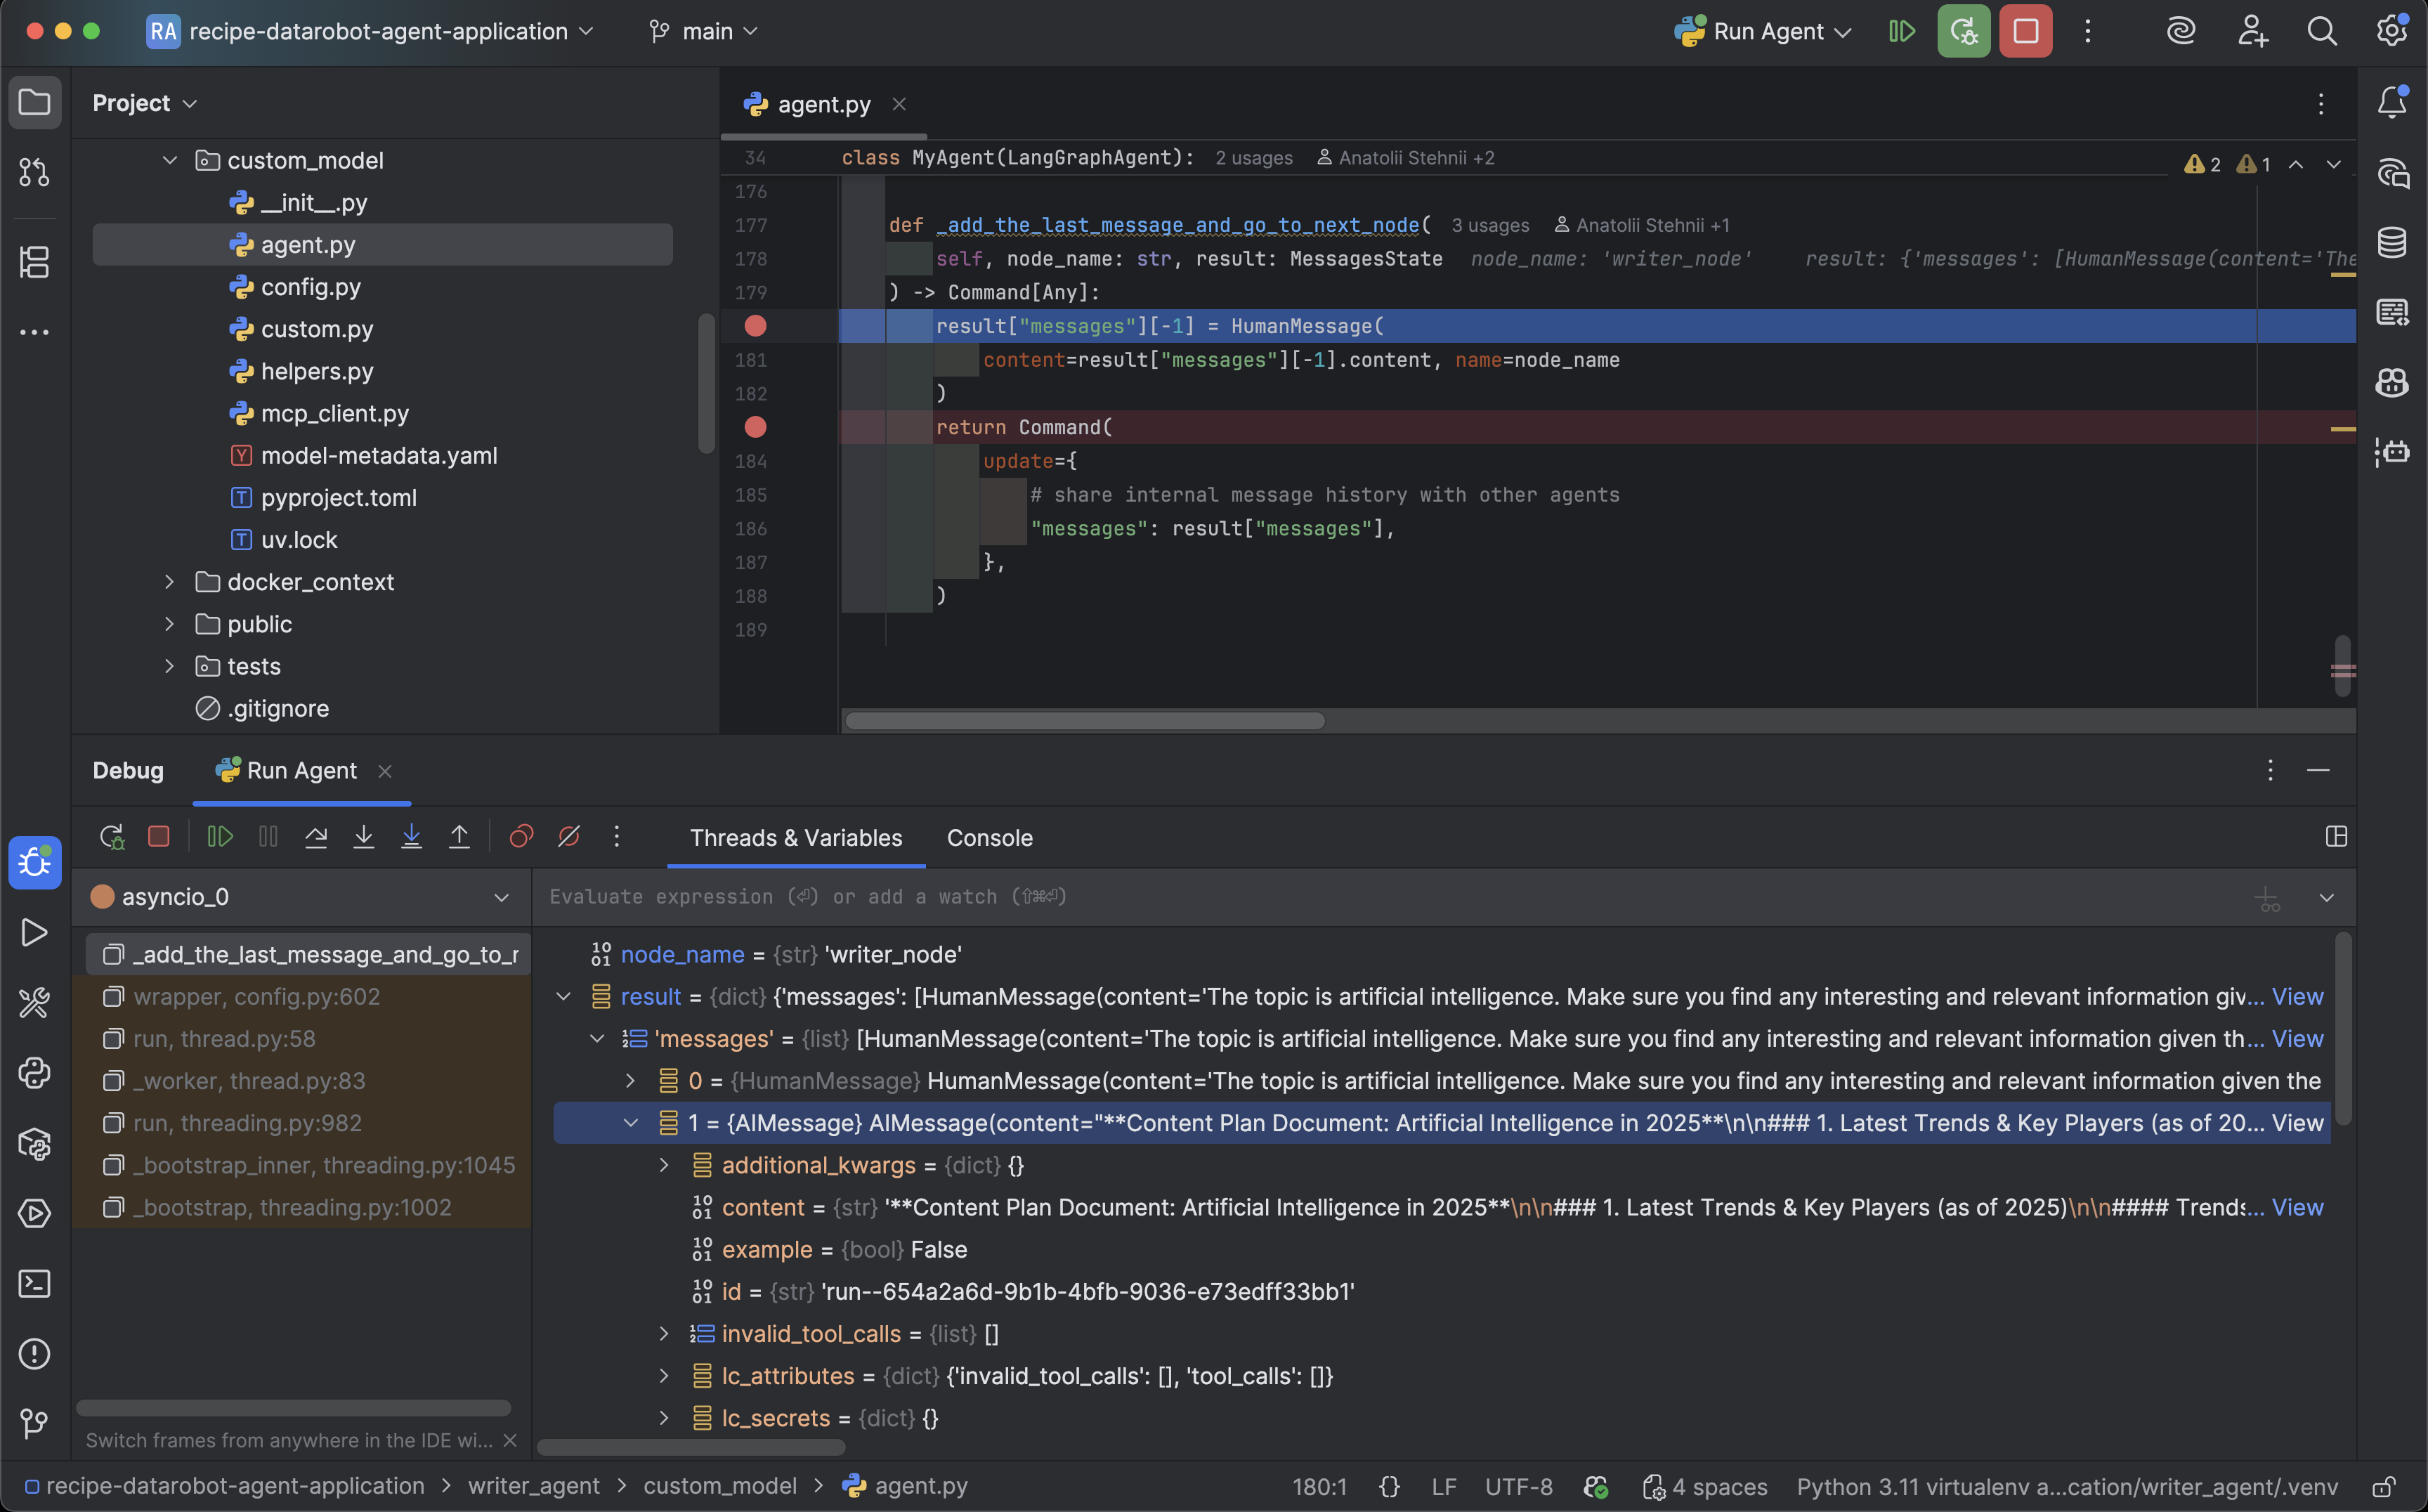
Inspect variables
- The Threads & Variables pane shows all variables in the current scope.
- Expand objects to see their properties and values.
- Right-click variables to add them to Watches for persistent monitoring.
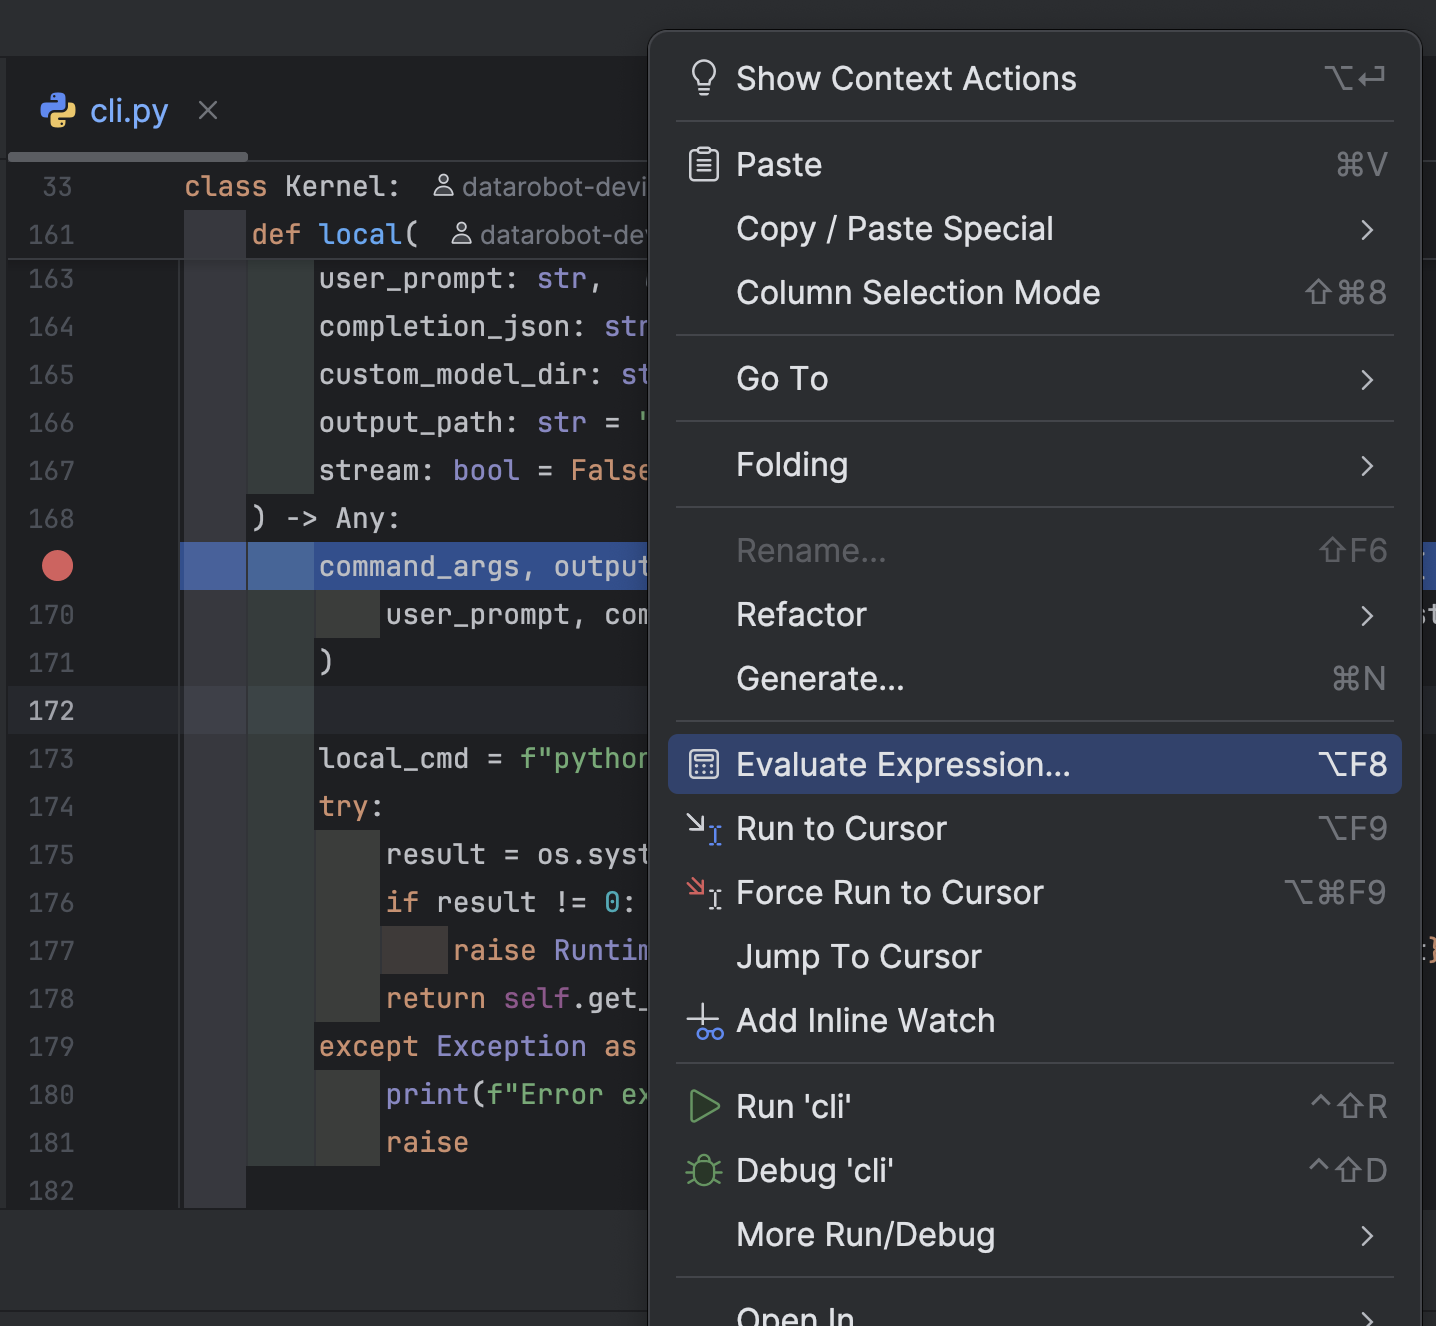
Evaluate expressions
- Click the Evaluate Expression button in the debug toolbar (calculator icon) or right-click in the current context and select Evaluate Expression.
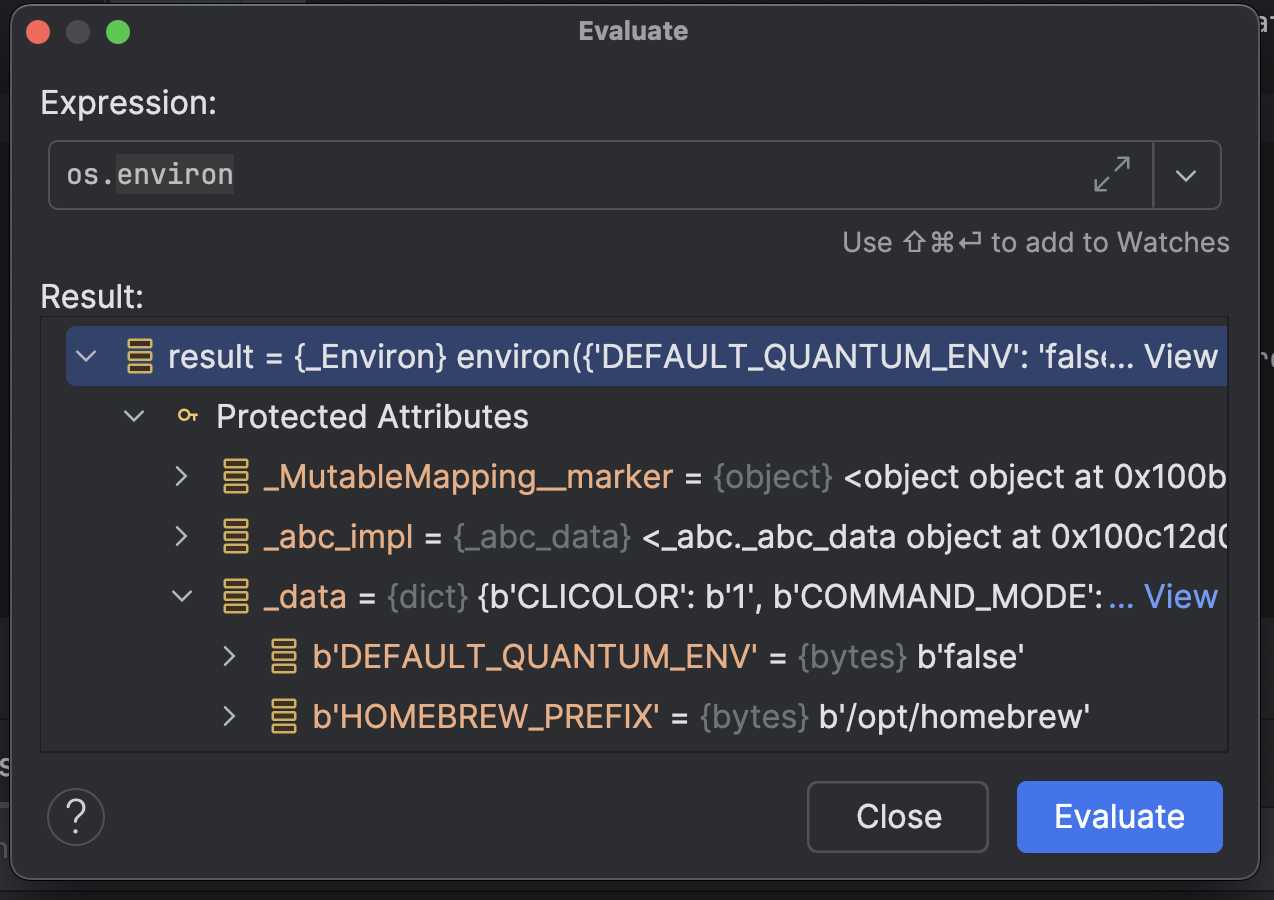
- Enter any Python expression to evaluate it in the current context (for example,
os.environ). - Useful for testing conditions, examining complex objects, or calling methods.
View call stack
- The Frames pane shows the call stack, displaying how execution reached the current point.
- Click different frames to see variables and code at each level.
Common issues
Run Agent configuration is missing
Issue: PyCharm does not show the Run Agent configuration.
Solution:
- Check that your project files (such as
.idea/runConfigurations/Run Agent.run.xml) are not excluded from your VCS or workspace. - Restart PyCharm to force it to reload project metadata.
- Re-clone the repository.
CLI command finishes without hitting breakpoints
Issue: The agent finishes processing and never pauses where you expect.
Solution:
- Make sure you launched the Run Agent configuration in Debug mode, not regular Run.
- Verify your breakpoint is active (solid red) and located in code that executes for the selected prompt.
- Re-run the CLI command after PyCharm shows that the debugger is listening.
Environment variables missing
Issue: The agent fails due to missing credentials or configuration.
Solution:
- Confirm your
.envfile exists at the repository root and includesDATAROBOT_API_TOKENandDATAROBOT_ENDPOINT. - In the Run Agent configuration, ensure the Paths to ".env" files field points to the correct file.
Wrong Python version
Issue: PyCharm shows "Python version mismatch" errors or modules are missing.
Solution:
- Confirm you've configured the correct Python interpreter (the one in your agent's virtual environment).
- If you recently recreated the environment, click the interpreter dropdown and re-select the
.venvPython executable.
Breakpoints not working
Issue: Execution doesn't stop at breakpoints even in Debug mode.
Solution:
- Confirm the debugger console shows the development server restarted after you clicked Debug. If not, stop and start the configuration again.
- Check that you reran the CLI command after entering debug mode—the development server handles one request at a time.
- Ensure PyCharm mapped your project correctly. If you're using multiple agent templates, verify you're editing the same copy of the file that the development server runs.