Review tracing
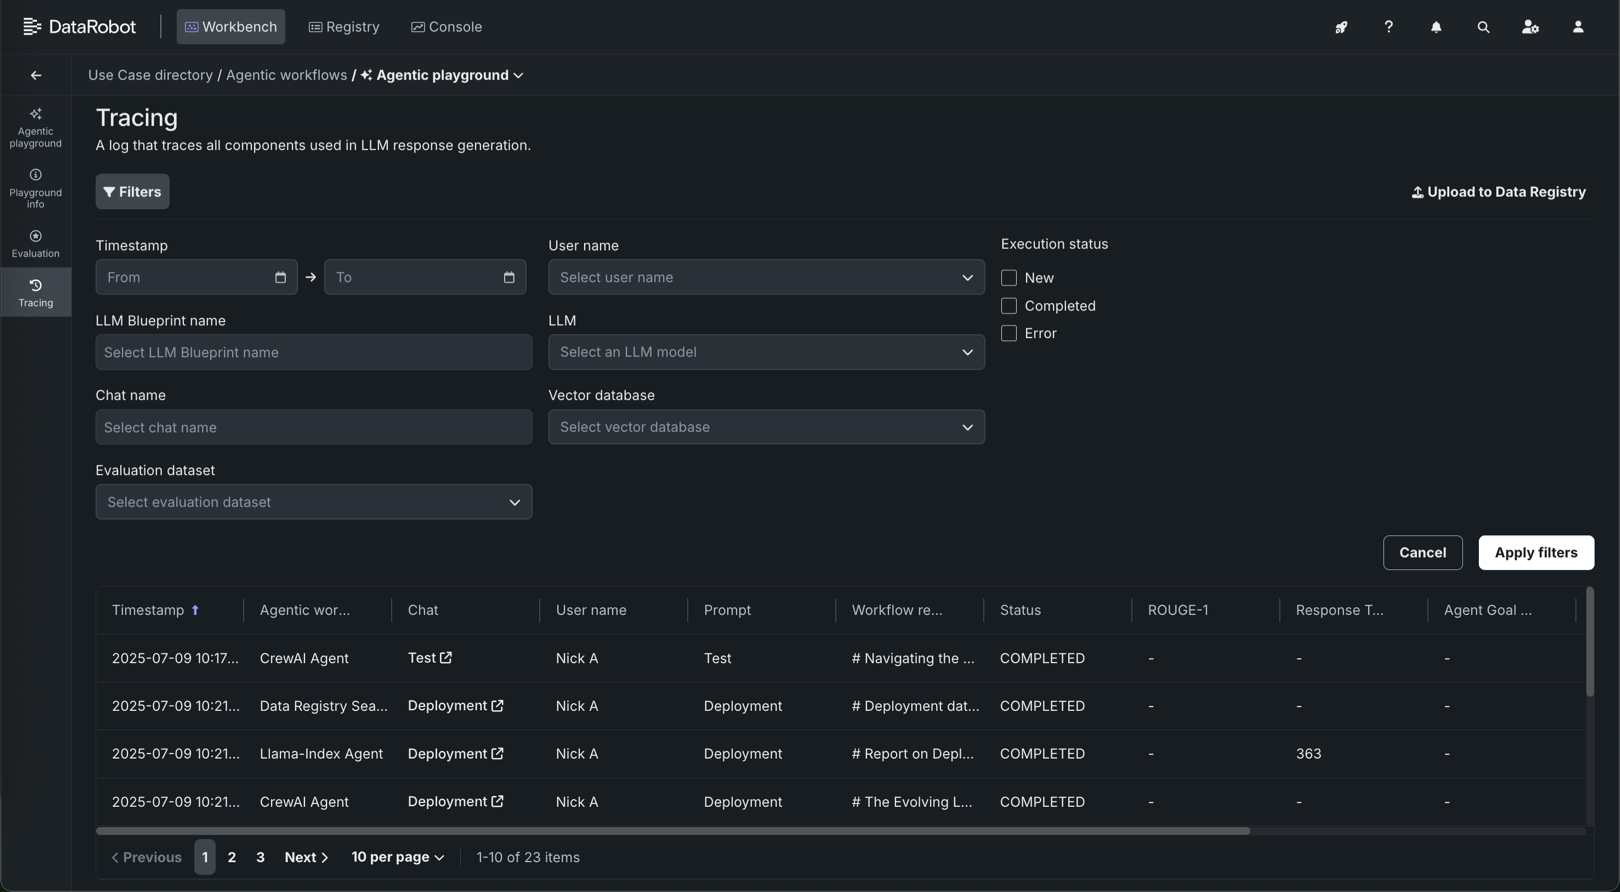
Tracing the execution of agentic workflows is a powerful tool for understanding how most parts of the GenAI stack work. The Tracing tile provides a log of all components and prompting activity used in generating agent responses in the playground. Insights from tracing provide full context of everything the agent evaluated, including prompts, vector database chunks, and past interactions within the context window. For example:
- DataRobot metadata: Reports the timestamp, status, Use Case, playground, agentic workflow, and the creator name. These help pinpoint the sources of trace records if you need to surface additional information from DataRobot objects interacting with the agentic workflow.
- Prompts and responses: Provides a history of user prompts, agentic workflow responses, and user feedback.
- Evaluations (if configured): Illustrates how evaluation metrics are scoring prompts or responses.
To locate specific information in the Tracing table, click Filters and filter by any combination of Timestamp, User name, LLM Blueprint name, LLM, Vector database, Chat name, and Evaluation dataset.
Send tracing data to the Data Registry
Click Upload to Data Registry to export data from the tracing table to the Data Registry. A warning appears on the tracing table when it includes results from running the toxicity test and the toxicity test results are excluded from the Data Registry upload.
Individual chat request tracing
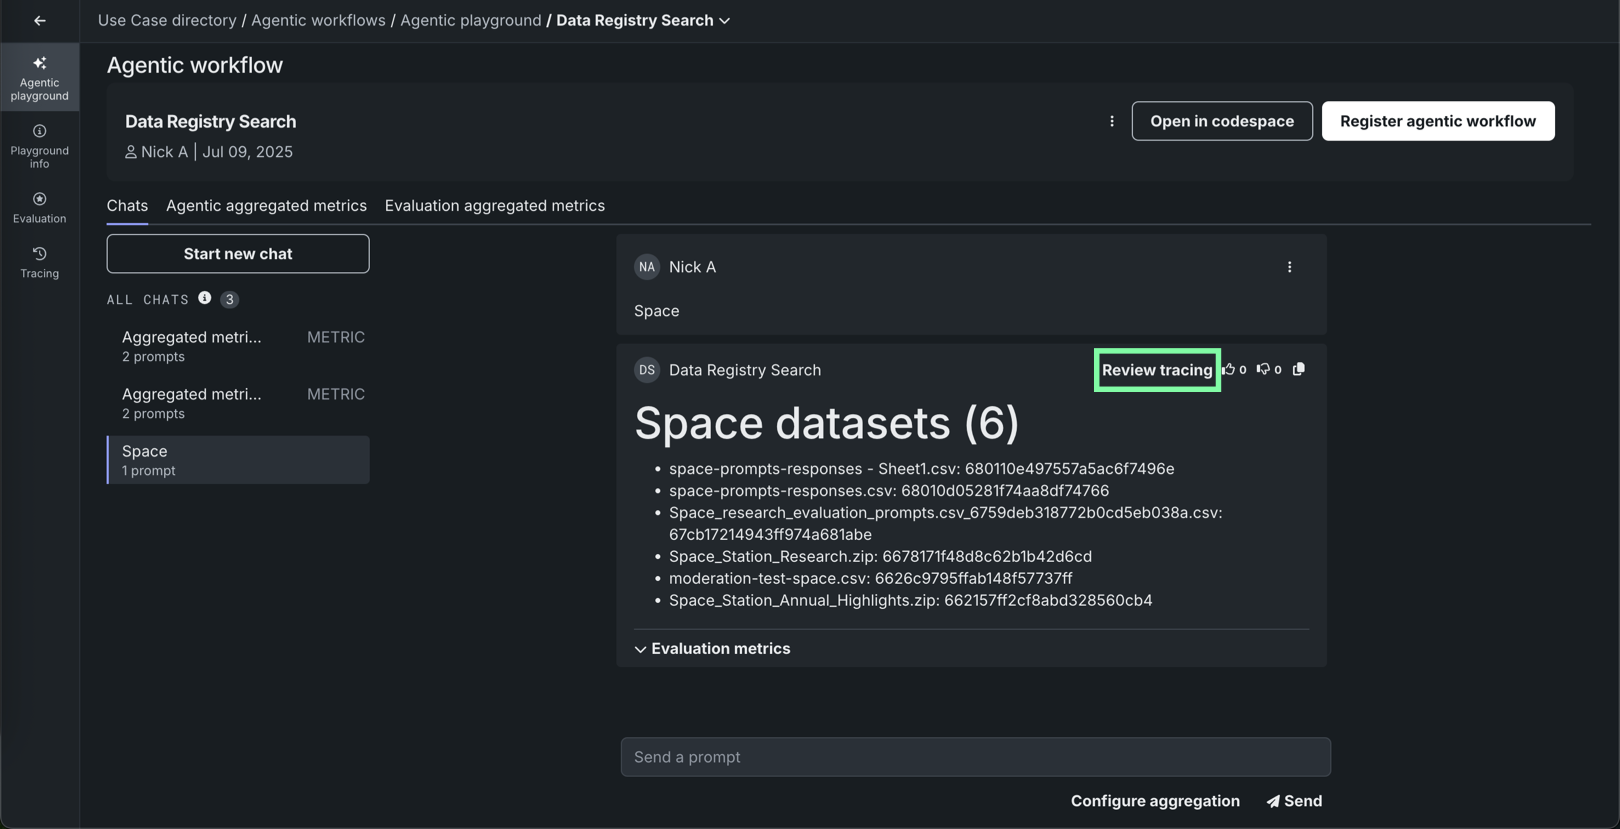
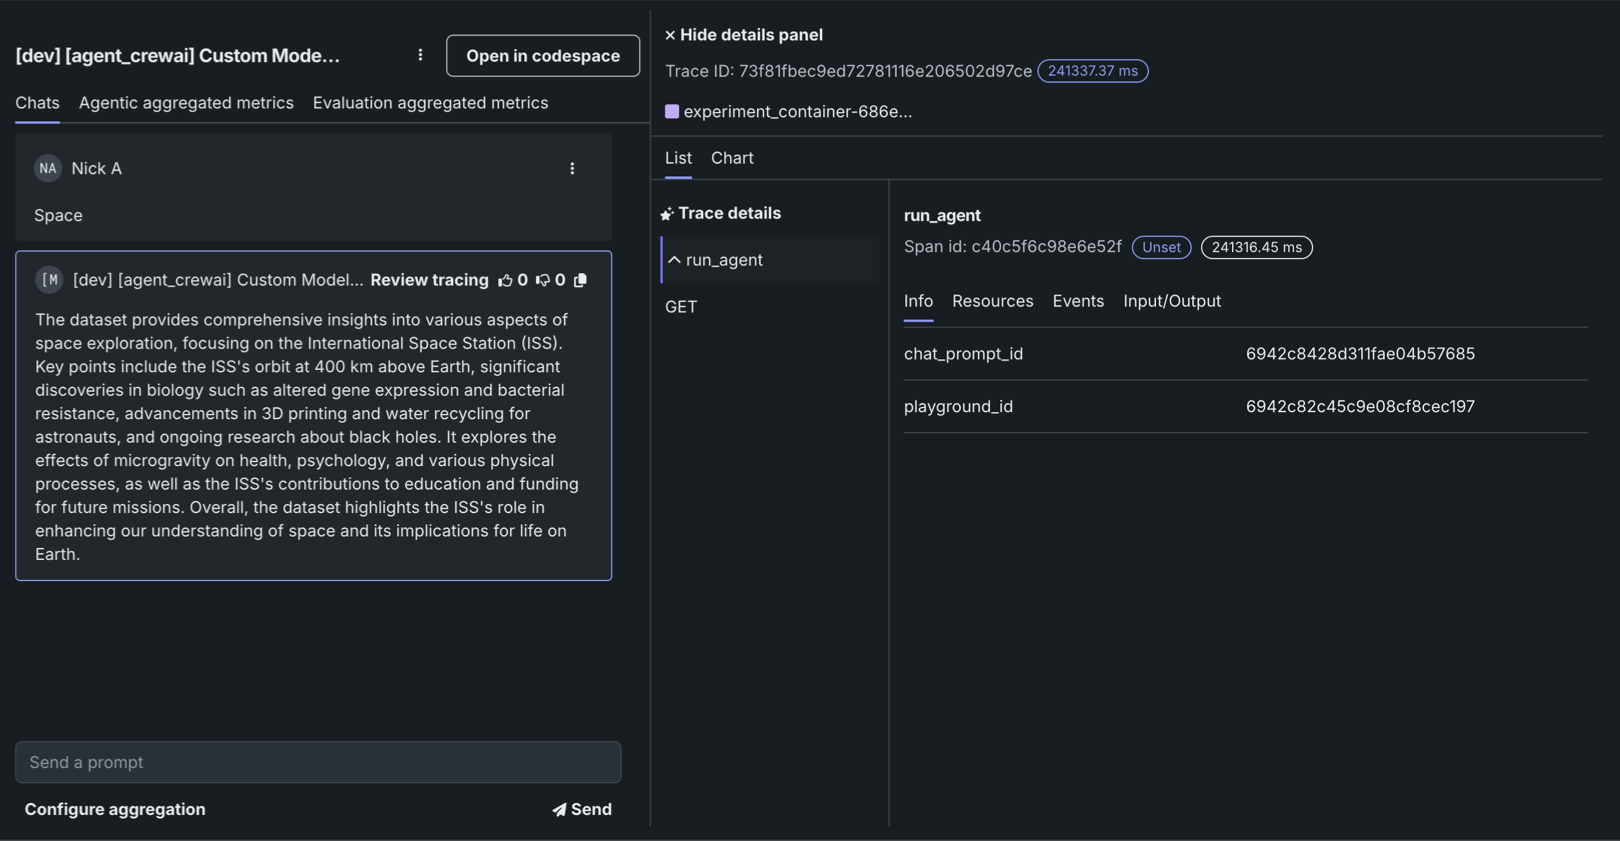
In addition to the logged information about all prompts and responses on the Tracing tile, you can also access tracing details on the path a single chat request takes through the agentic workflow. Do this from the Chats tab for a single agentic workflow. In a single-agent chat, click Review tracing next to the agent's name.
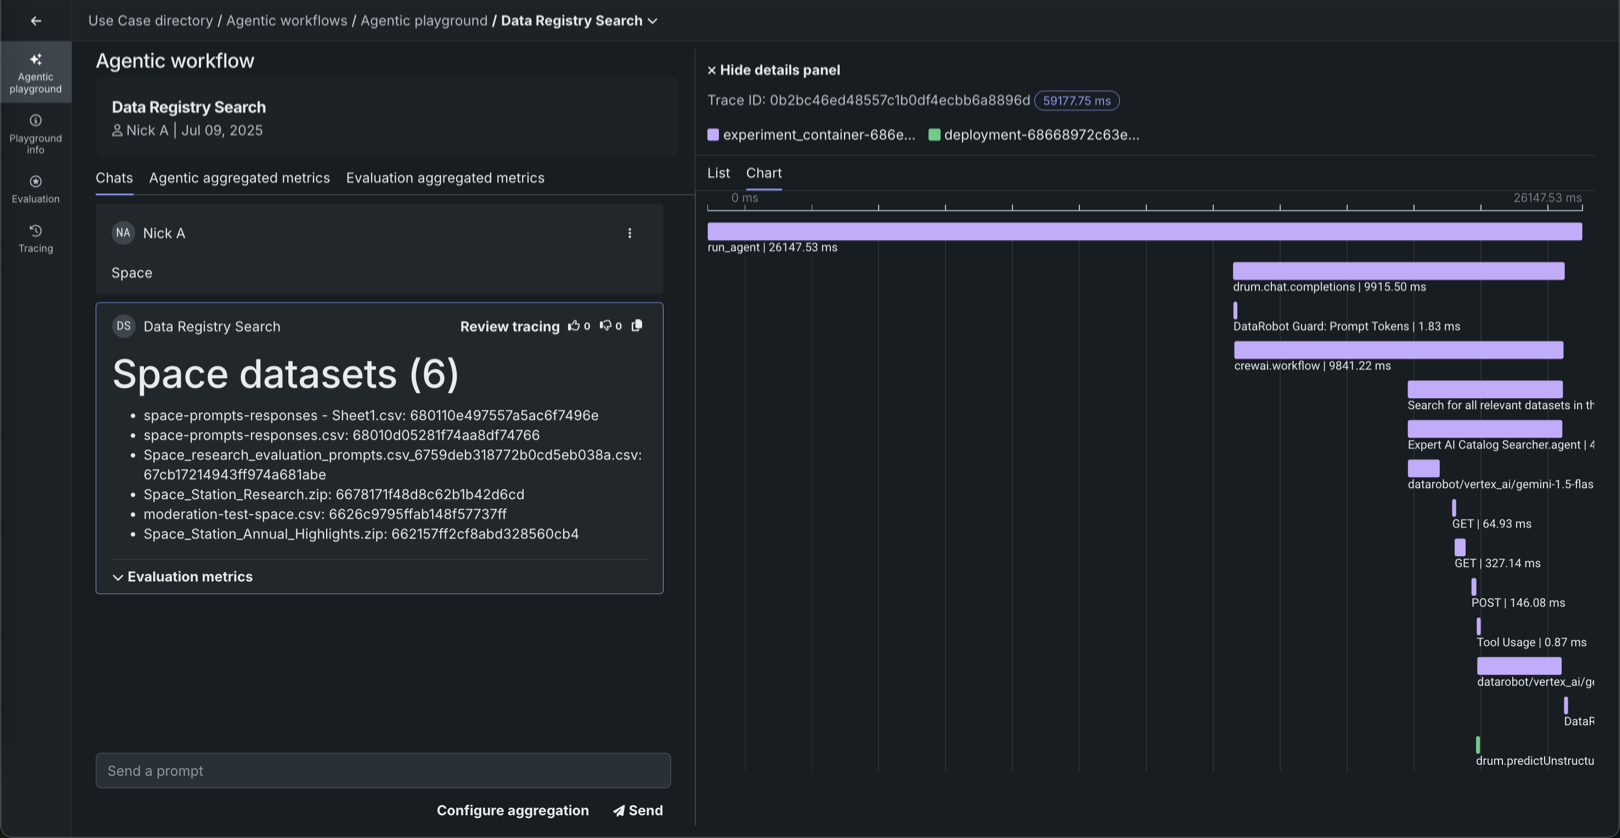
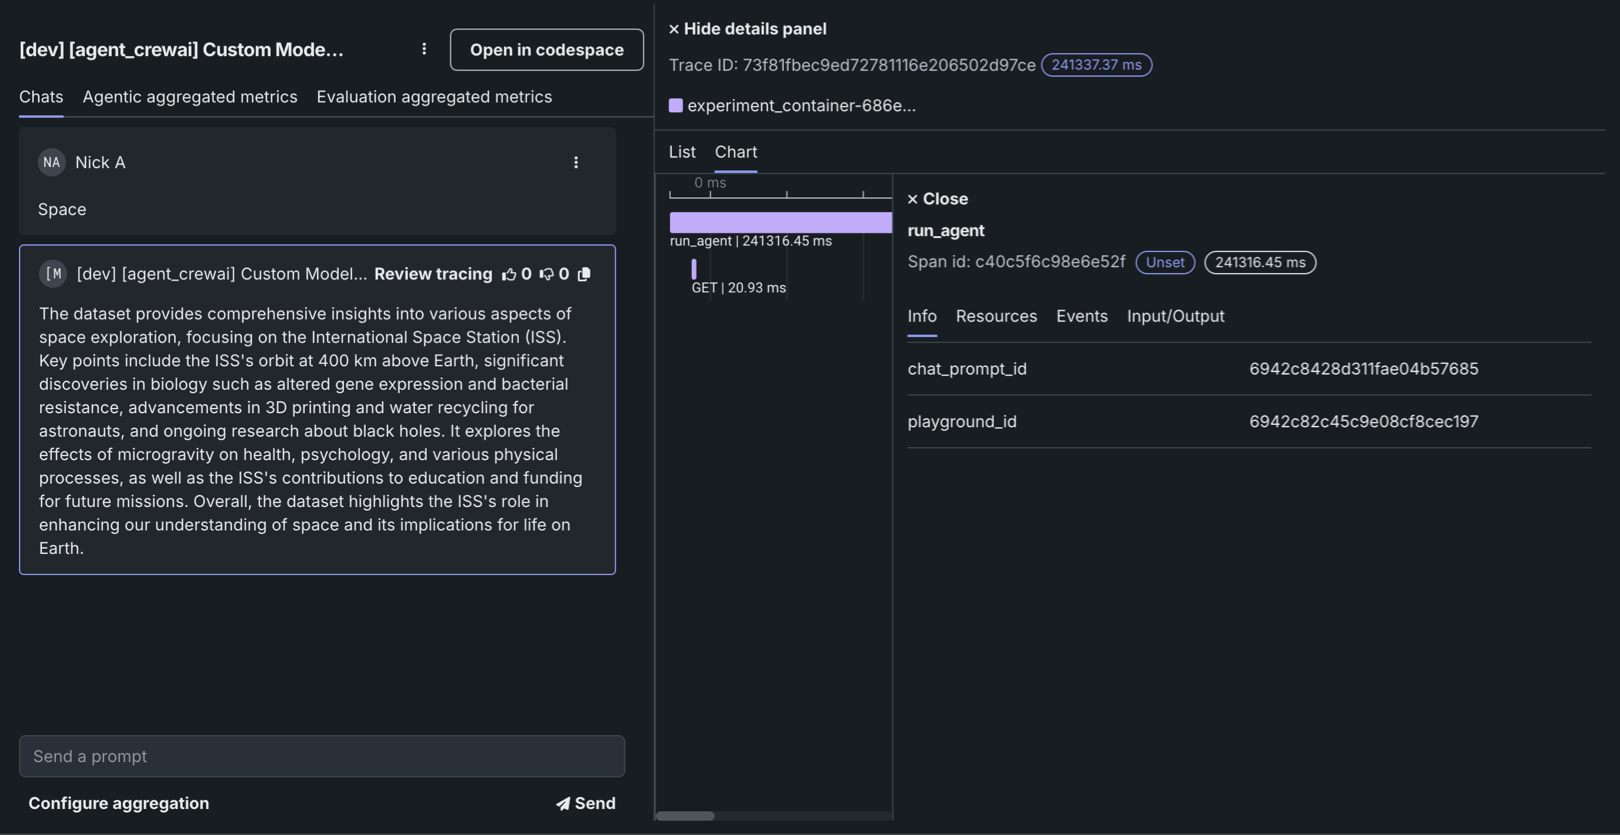
Traces represent the path taken by a request to a model or agentic workflow. DataRobot uses the OpenTelemetry framework for tracing. A trace follows the entire end-to-end path of a request, from origin to resolution. Each trace contains one or more spans, starting with the root span. The root span represents the entire path of the request and contains a child span for each individual step in the process. The root (or parent) span and each child span share the same Trace ID.
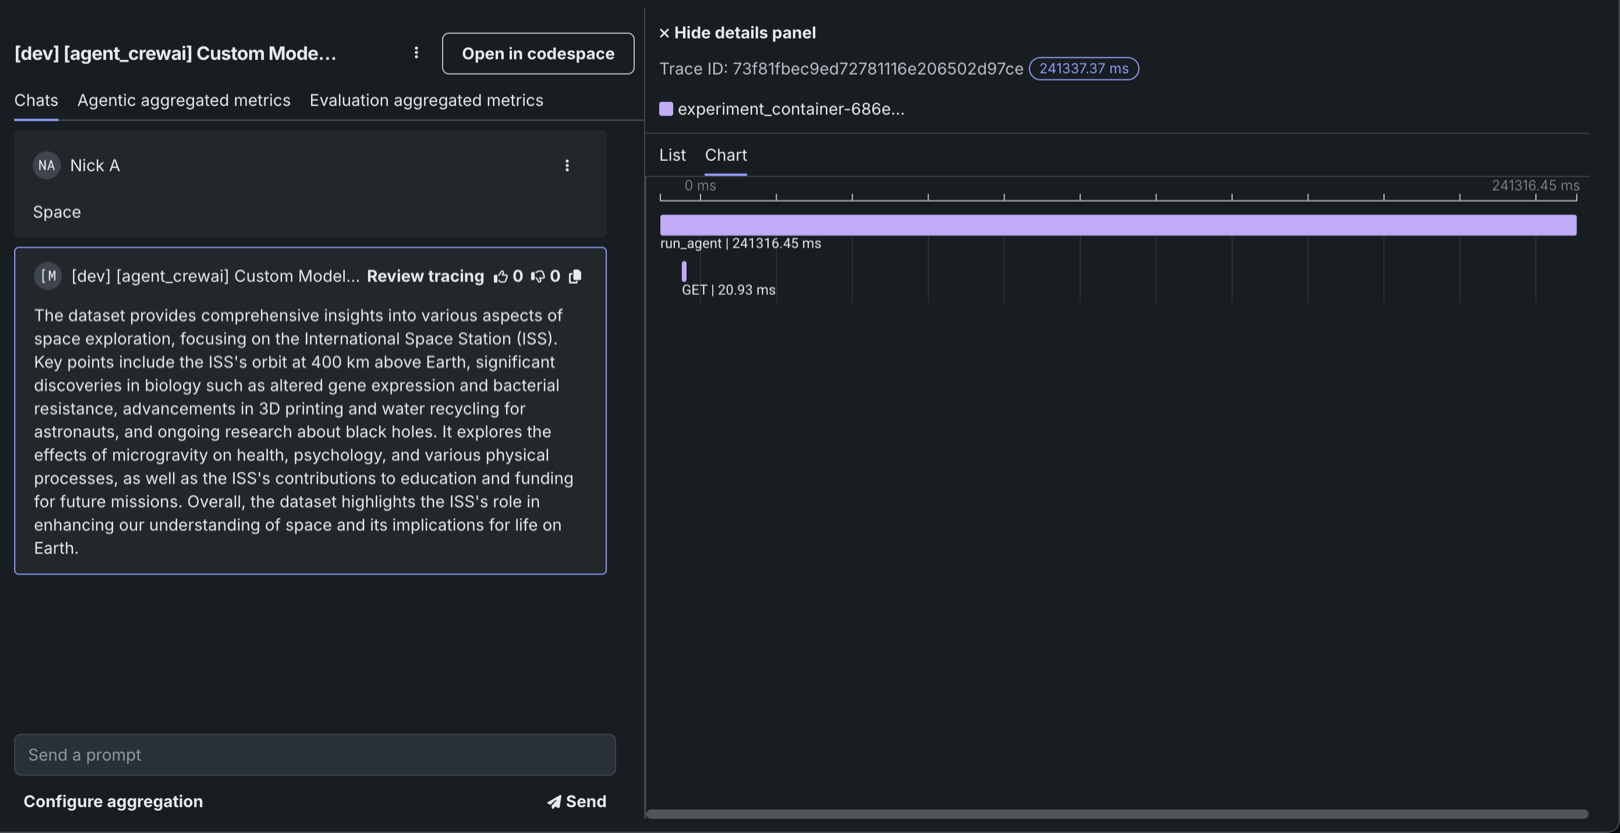
In the tracing details panel header, review the Trace ID for the request, the execution time (in ms), and the span services involved. On the List and Chart tabs, review the spans contained in the trace, along with trace details. The span colors correspond to a Span service. The first span service is the experiment container, sometimes followed by one or more deployments. Restricted span appears when you don’t have access to the deployment or service associated with the span. You can view spans in Chart format or List format.
Span detail controls
From either view, you can click Hide details panel to return to the single-agent-chat.
For either view, click the Span service name to access the deployment or resource (if you have access). Additional information, dependent on the configuration of the generative AI model or agentic workflow, is available on the Info, Resources, Events, Input/Output, and Error tabs. The Error tab only appears when an error occurs in a trace.
