Debugging agents in VS Code
VS Code can run the same dev.py script that powers the agent development server, so you can step through requests, inspect variables, and replay prompts without wiring up a remote debugger. After cloning the repository, you only need to point VS Code at your agent's virtual environment, create a launch configuration that targets dev.py, and execute prompts from the CLI while the debugger listens.
This guide mirrors the PyCharm workflow and walks you through preparing VS Code, launching the debugger, and troubleshooting common issues.
Prerequisites
Before configuring VS Code debugging, ensure you have:
- VS Code + Python extension: Install the official Microsoft Python extension for debugging support, and see the documentation if you need setup guidance.
- Agent application setup: Complete the installation and run
dr startto create the agent virtual environment. - Environment variables: Configure
.envwithDATAROBOT_API_TOKEN,DATAROBOT_ENDPOINT, and any tools-specific variables. - CLI access: You can run
task <agent>:clicommands from a terminal to trigger executions while the debugger runs.
Configure Python interpreter
Run dr start first
dr start provisions dependencies and the .venv interpreter. Run it before selecting the interpreter in VS Code.
- Open your agent application folder (for example,
datarobot-agent-application) in VS Code. - Press Command+Shift+P (macOS) or Ctrl+Shift+P (Windows/Linux) to open the Command Palette.
- Run Python: Select Interpreter.
-
Choose the interpreter that lives inside your agent's
.venvpath. For theagentdirectory, the entry typically looks like:$workspace/agent/.venv/bin/python
VS Code uses this interpreter for linting, the integrated terminal, and the debugger so that the environment matches what task created.
Configure the Run Agent launch configuration
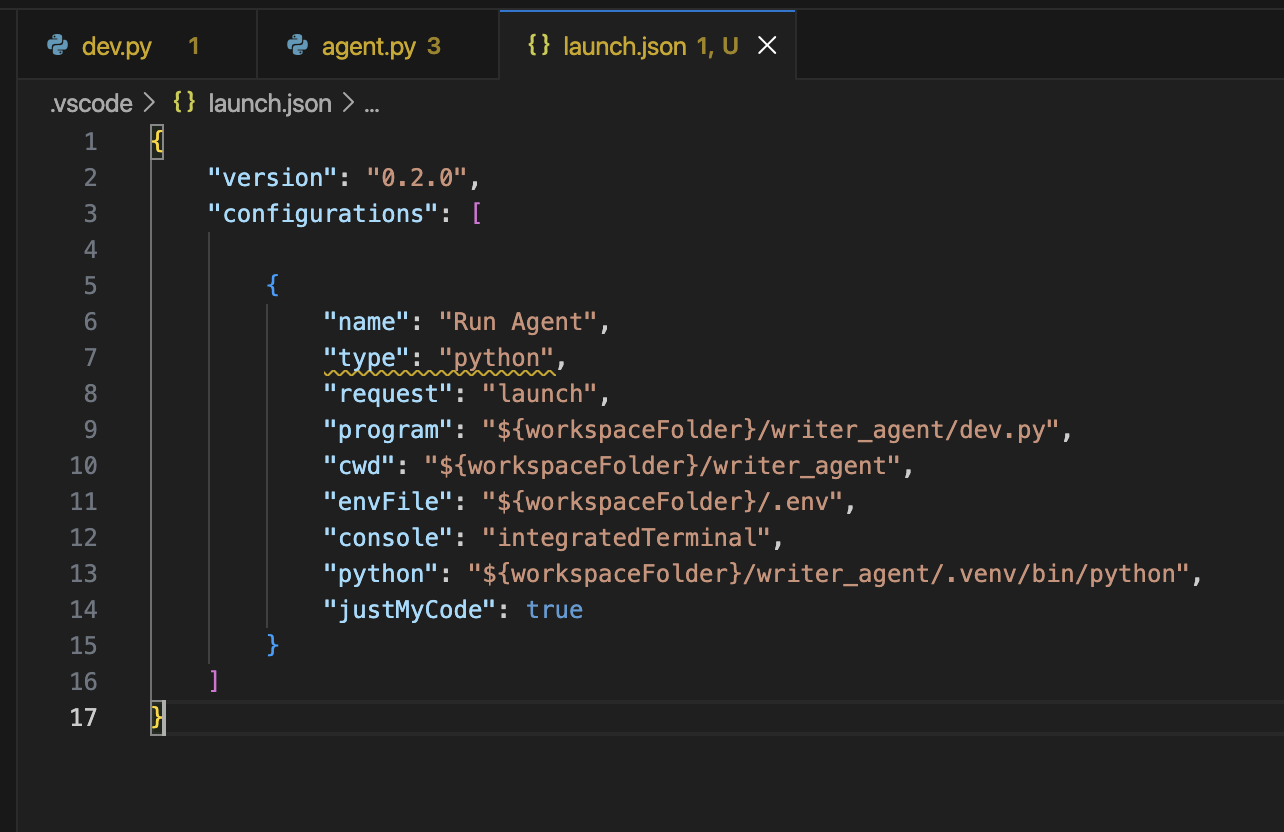
The VS Code debugger uses .vscode/launch.json. You can reuse the same layout as the PyCharm guide by creating a Run Agent configuration that points to dev.py.
- Open the Run and Debug view (sidebar play icon) and click create a launch.json file.
- Select Python Debugger as the debugger.
- Select Python File as the debug configuration.
- Replace the autogenerated
.vscode/launch.jsonconfiguration with something similar to the snippet below, adjusting the paths to your agent:
{
    "version": "0.2.0",
    "configurations": [
        {
            "name": "Run Agent",
            "type": "python",
            "request": "launch",
            "program": "${workspaceFolder}/agent/dev.py",
            "cwd": "${workspaceFolder}/agent",
            "envFile": "${workspaceFolder}/.env",
            "console": "integratedTerminal",
            "python": "${workspaceFolder}/agent/.venv/bin/python",
            "justMyCode": true
        }
    ]
}
program: Points to your agent'sdev.py.cwd: Ensures relative imports and file paths resolve from the agent directory.envFile: Loads the same.envsettings the CLI uses.python: Forces the debugger to use the.venvinterpreter you selected earlier.
If your workspace contains multiple agents, duplicate the configuration—with different names and paths—for each agent you debug regularly.
Run the development server
To start up your development server:
1. Open the Run Agent configuration in the Run and Debug view.
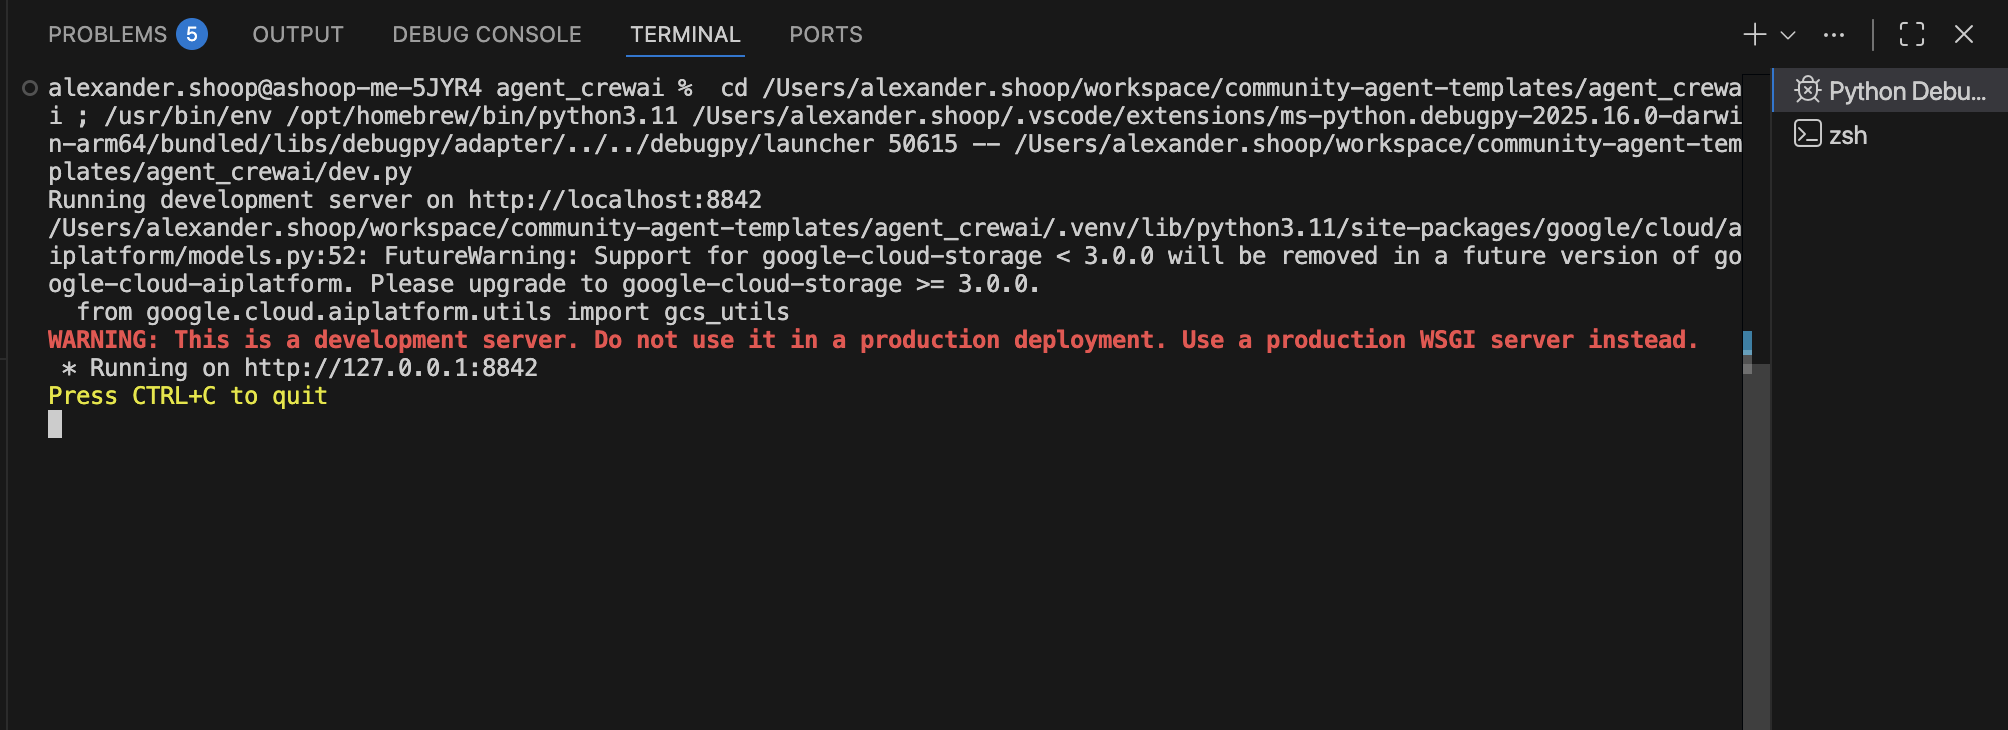
2. Click Run (or press F5) to start the development server under the debugger.
3. Watch the Debug Console or Terminal for the startup message (for example, Running development server on http://localhost:8842).
VS Code now listens for requests and will pause if you set breakpoints.
Trigger agent execution from the CLI
With the development server listening, you can send prompts from any terminal session. For an example CLI call:
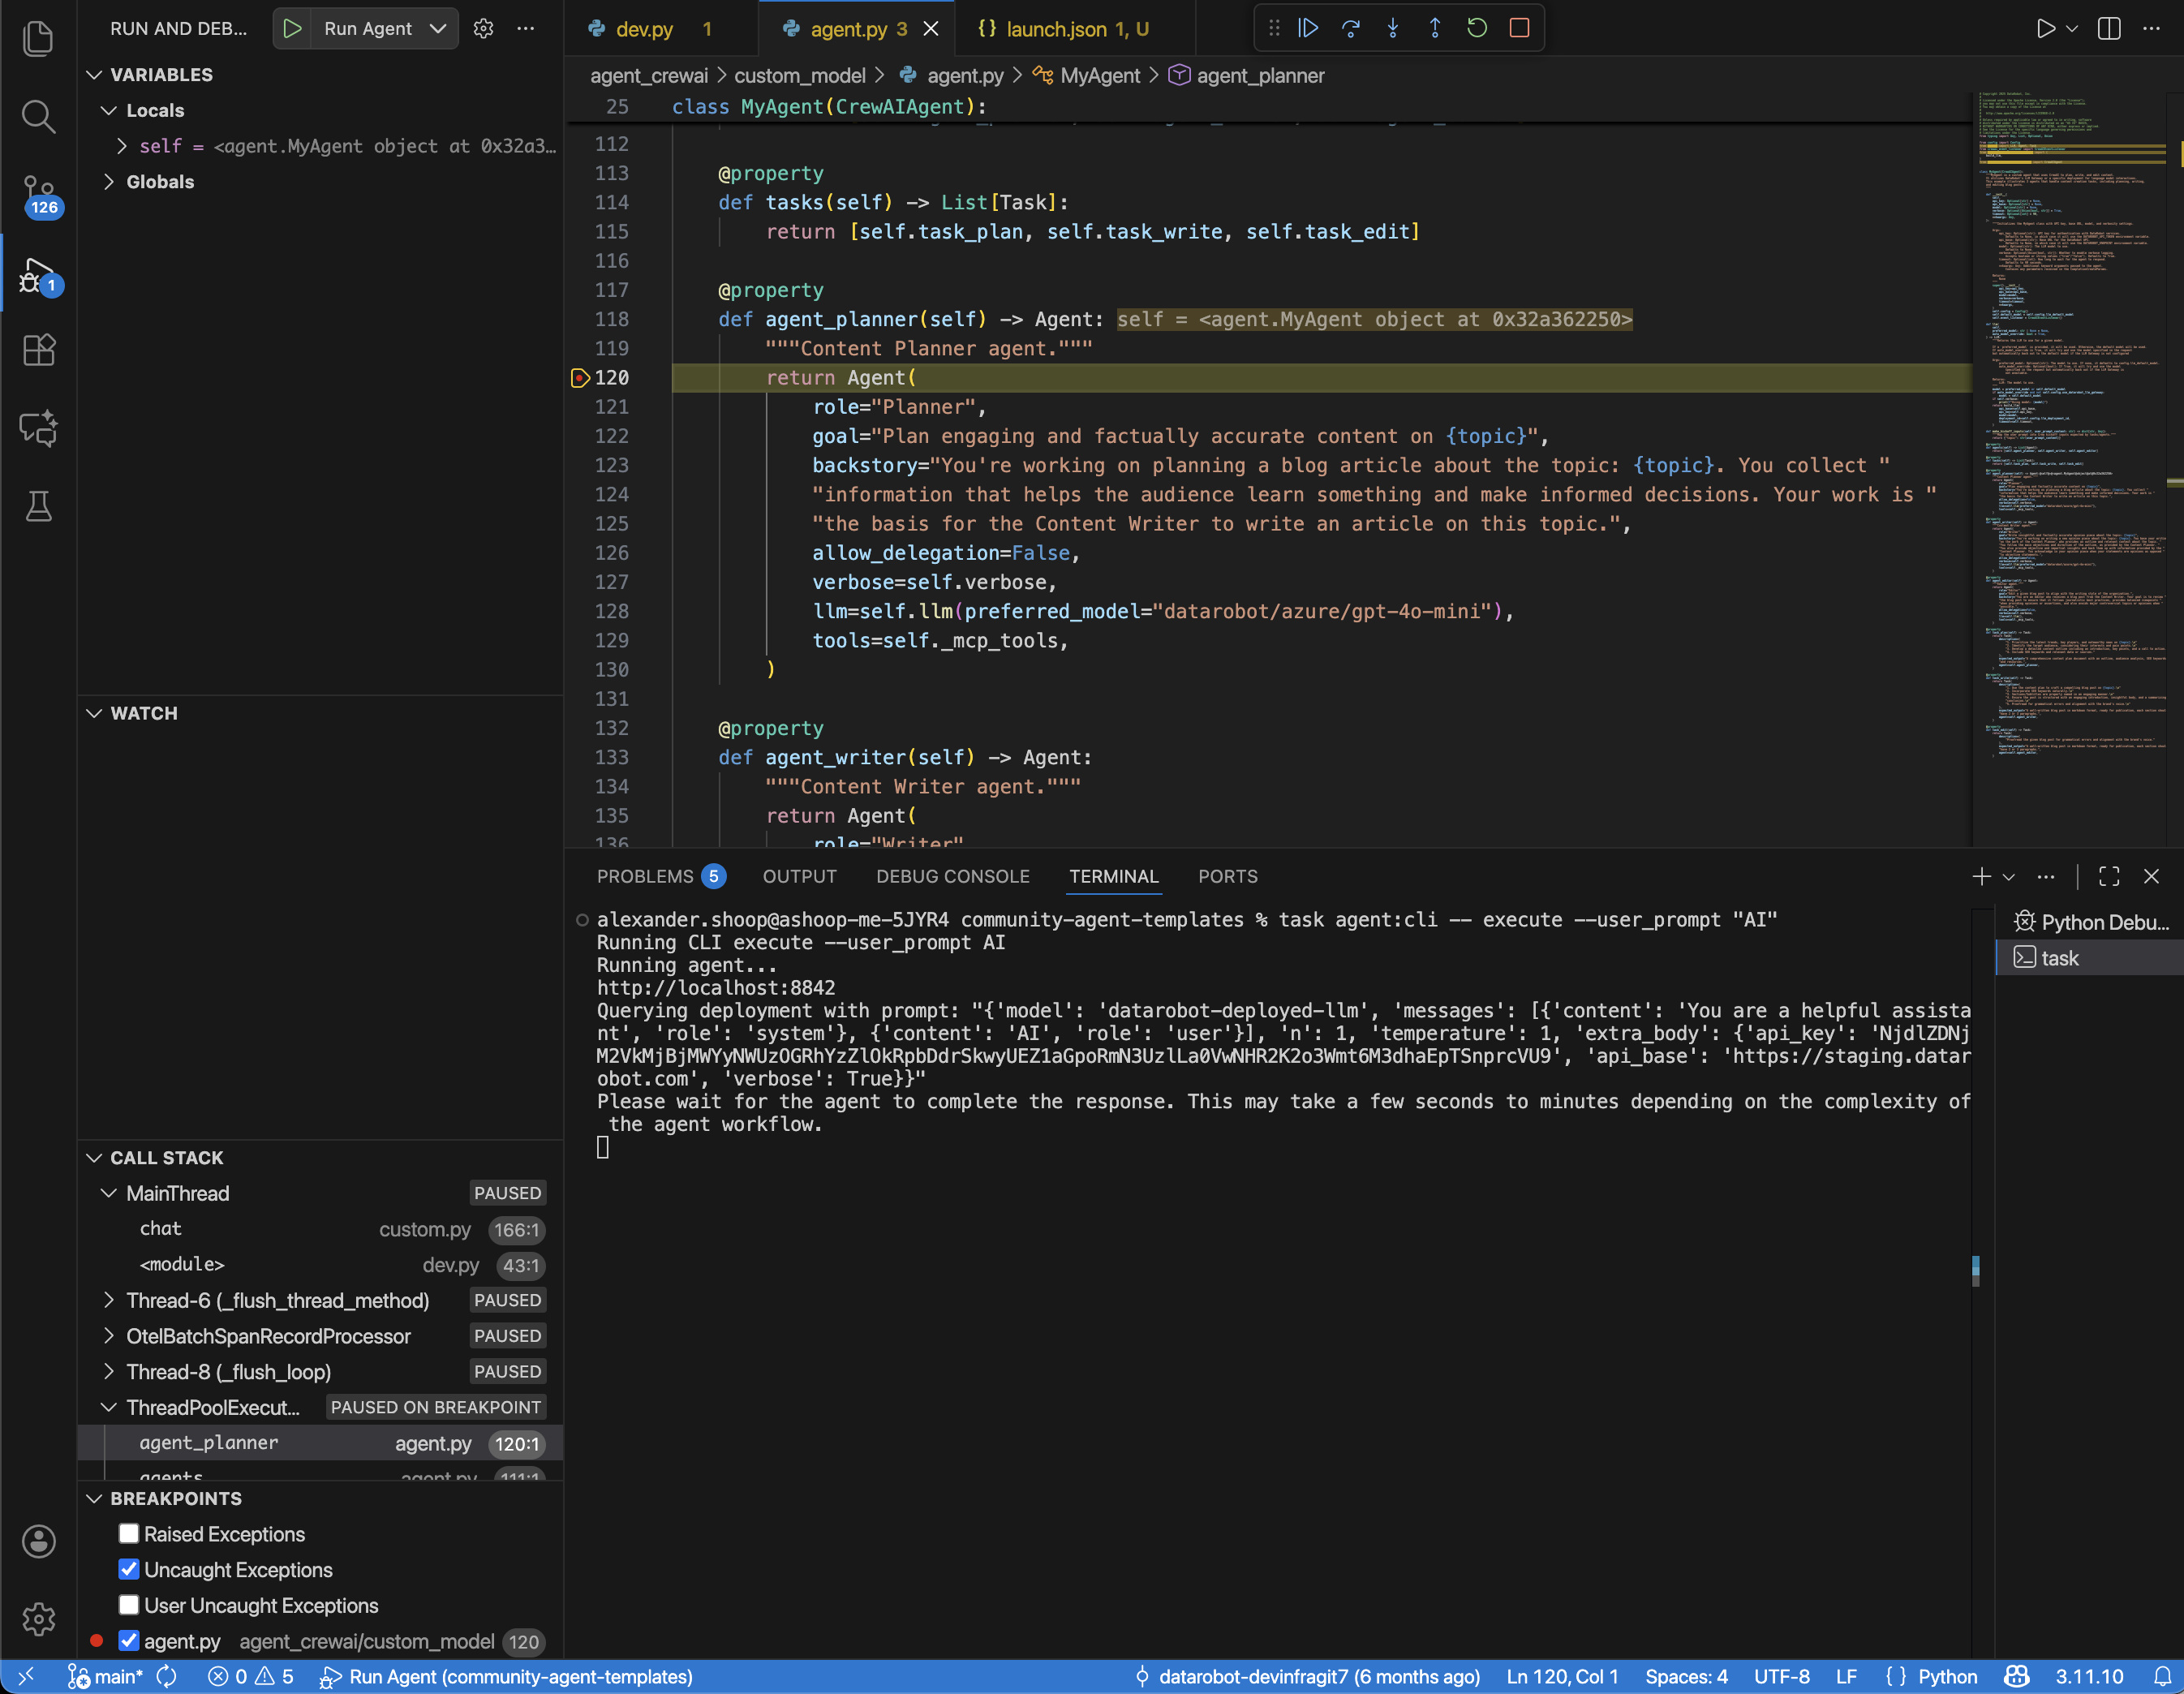
task agent:cli -- execute --user_prompt "Artificial Intelligence"
Every CLI request flows through the VS Code debugger session, so you can repeat the same prompt or adjust arguments until you isolate the issue.
Debug with breakpoints
To set up debugging with breakpoints:
1. Set breakpoints in files such as agent/agent/myagent.py.
2. Click Run > Start Debugging (or press F5) to make sure the debugger is active.
3. Re-run your CLI command. When execution hits a breakpoint, VS Code pauses and highlights the line.
4. Use the debug toolbar to step over, step into, or continue execution.
Use VS Code debug tools
The following sections describe the various tools supported for VS Code debugging.
Inspect variables
- The Variables pane shows locals, globals, and environment data for the paused frame.
- Right-click variables to Add to Watch for persistent tracking across frames.
Evaluate expressions
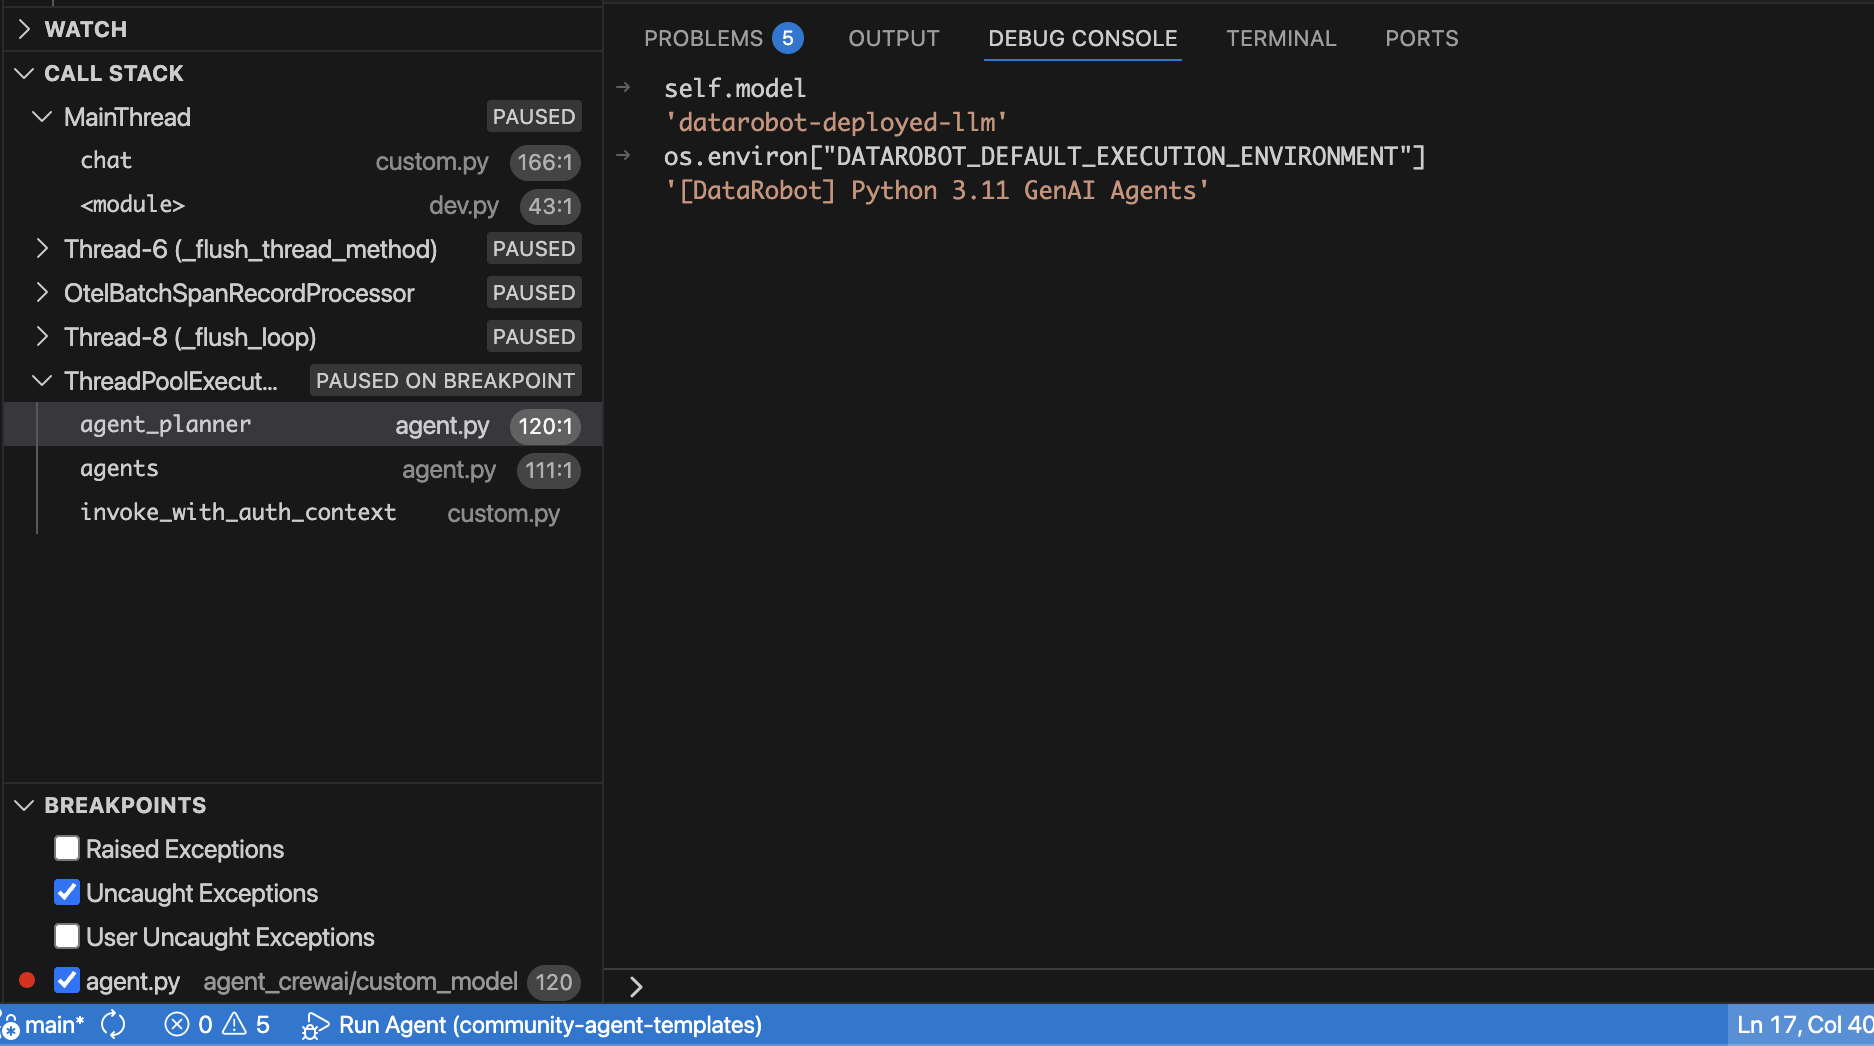
- Use the Debug Console to run Python expressions in the paused context (for example,
import osthenos.environ["DATAROBOT_ENDPOINT"]). - Add expressions to Watch when you need to monitor them while stepping through code.
Review the call stack
- The Call Stack view shows every frame leading to the breakpoint.
- Selecting a frame updates the editor, Variables pane, and Debug Console context so you can inspect earlier calls.
Common issues
Launch configuration missing
Issue: The Run Agent option does not appear.
Solution:
- Confirm
.vscode/launch.jsonexists inside your workspace and contains the configuration. - Use the Command Palette option Python Debugger: Debug using launch.json to regenerate the file if it was deleted.
Wrong interpreter
Issue: VS Code cannot import packages or shows Python version errors.
Solution:
- Run Python: Select Interpreter and choose the
.venvinterpreter created bydr start. - If you rebuilt the environment, reload the window (
Developer: Reload Window) and reselect the interpreter. - Confirm the
pythonentry in.vscode/launch.jsonpoints to the same.venv/bin/pythonpath you selected so the debugger starts with the correct runtime.
Environment variables not loading
Issue: The agent fails because credentials are missing during debugging.
Solution:
- Confirm the
.envfile exists at the repository root and containsDATAROBOT_API_TOKENandDATAROBOT_ENDPOINT. - Verify the
envFileentry inlaunch.jsonmatches the.envpath.
CLI finishes without hitting breakpoints
Issue: The CLI command completes but the debugger never pauses where expected.
Solution:
- Make sure the debugger is running (green bar in VS Code) before firing the CLI command.
- Verify the breakpoint is solid red (not hollow) and located in code that executes for the chosen prompt.
- Rerun the CLI command after restarting the debugger; the dev server handles one request at a time.
Debugger not attaching
Issue: VS Code launches but never shows the server banner or stops at breakpoints.
Solution:
- Stop the session and start it again to ensure
dev.pyrestarted cleanly. - Check that
programandcwdreference the same agent directory; mismatched paths cause VS Code to debug the wrong copy of the code. - Inspect the Debug Console for stack traces indicating missing dependencies—rerun
dr startif needed.