View Workload logs
A Workload's Logs tab receives container output in real time. Container stdout and stderr are captured automatically at every lifecycle stage—startup, running, and errored—including plain print() output, subprocess output, and logs from containers that haven't been instrumented with the OpenTelemetry (OTel) SDK. Startup failures and crash-loop diagnostics flow into the same log stream as runtime output, so you can inspect crash causes alongside healthy-state output in one place. Logs persist after a Workload is stopped or deleted, and are segmented per replica and per container. Additionally, you can filter and view span-specific logs on the Monitoring > OTel tracing tab.
Explicit OTel instrumentation is optional
Automatic stdout/stderr capture means you don't need the OTel SDK to view stdout/stderr logs in this tab. Add explicit instrumentation only when you want structured, attribute-rich log records alongside automatic capture—see Instrument a Workload with OpenTelemetry.
The collected logs provide time-period filtering capabilities, and the OTel logs API is available to programmatically export logs with similar filtering capabilities. OTel-instrumented logs are standardized for export to third-party observability tools like Datadog. Plain stdout capture appears in this tab but is not OTLP-exported unless you add the logging handler described in Instrument a Workload with OpenTelemetry.
Retention
Log retention depends on the artifact lifecycle status: 24 hours for Workloads backed by draft artifacts and 30 days for Workloads backed by locked artifacts. After retention elapses, log data is automatically deleted.
To access the logs for a Workload, on the Deployed Workloads tab, locate and click the Workload, click the Activity log tab, and then click Logs. The logging levels available are INFO, DEBUG, WARN, CRITICAL, and ERROR.
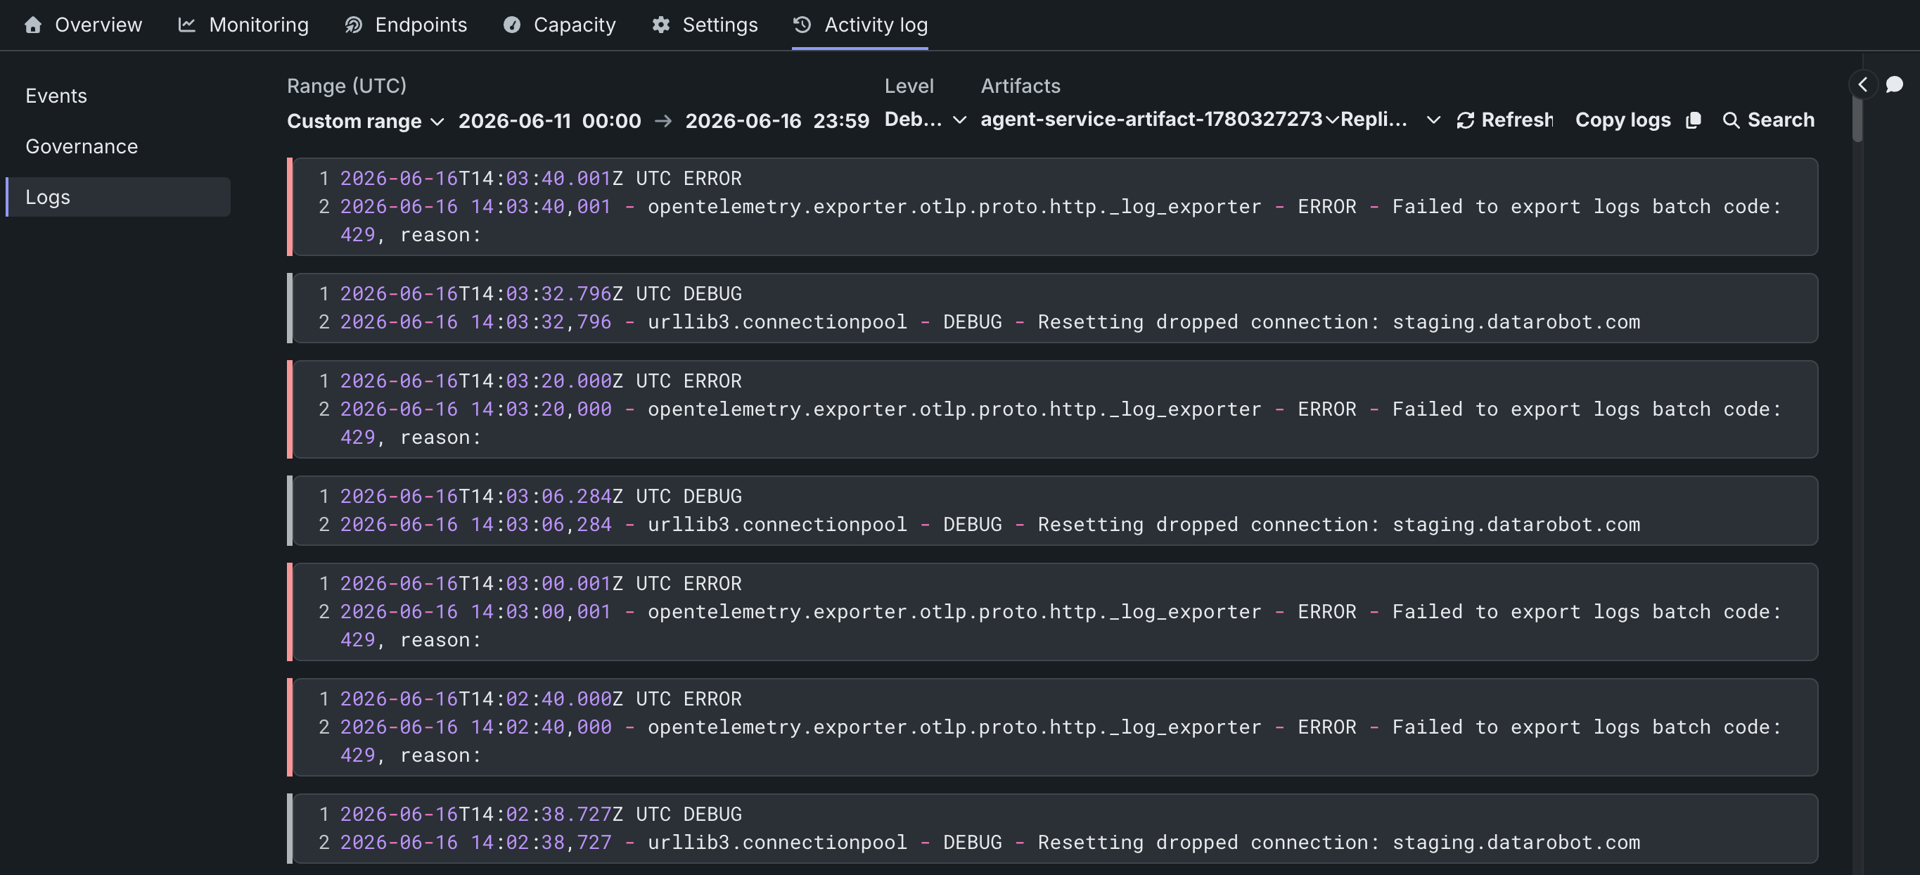
| Control | Description |
|---|---|
| Range UTC | Select the logging date range Last 15 min, Last hour, Last day, or Custom range. |
| Level | Select the logging level to view: Debug, Info, Warning, Error, or Critical. |
| Artifacts | Filter logs by artifact version. Select a specific artifact to narrow log output to that deployment. |
| Replicas | Filter logs by replica. Select a specific replica to isolate output from a single pod instance. |
| Refresh | Refresh the contents of the Logs tab to load new logs. |
| Copy logs | Copy the contents of the current Logs tab view. |
| Search | Filter to log lines that contain the specified text. Add multiple terms to require all of them to appear. |
| Exclude | Filter out log lines that contain the specified text. Add multiple terms to suppress any line matching any of them. |
For the Workload API monitoring surfaces (statistics, events, history), see REST: Monitor Workloads.