Review Workload events
On the Activity log > Events tab, you can view important Workload events. These events can help diagnose issues with a Workload or provide a record of the actions leading to the current state of the Workload. Each event has a type and a status. You can filter the event log by event type, event status, or time of occurrence, and you can view details for each event.
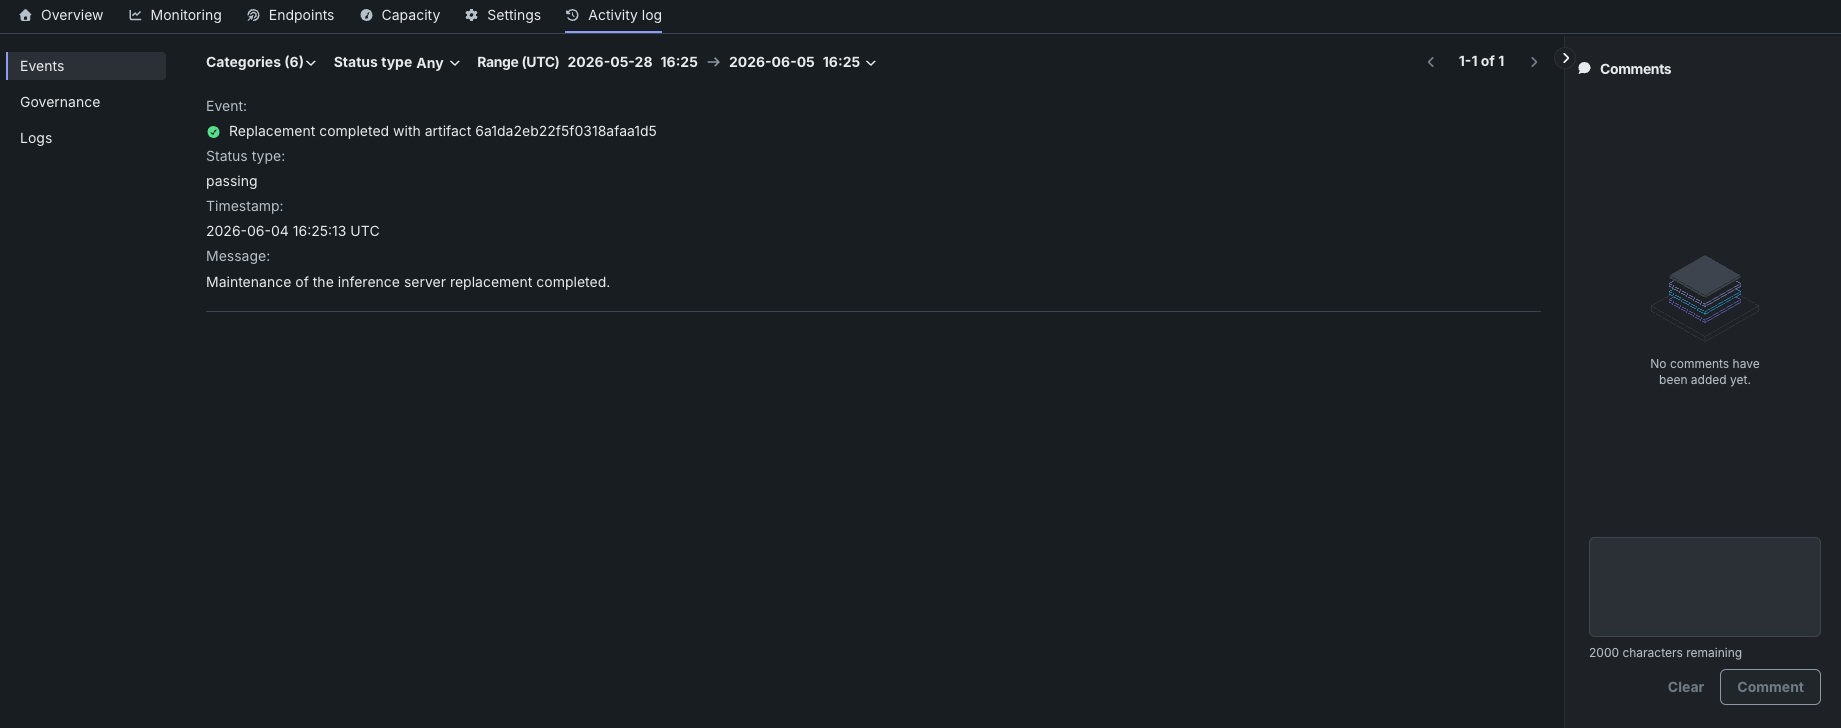
To view the event log, on the deployed Workload, click the Activity log > Events tab. The most recent events appear at the top of the list. The Events list displays Workload events with any selected filters applied. For each event, you can view the event name and status icon, the timestamp, an event message, and event details.
| Status icon | Description |
|---|---|
| Green / Passing | No action needed. |
| Yellow / At risk | Concerns found, but no immediate action needed; continue monitoring. |
| Red / Failing | Immediate action needed. |
| Gray / Informational | Details a deployment action (e.g., deployment launch has started). |
| Gray / Unknown | Unknown. |
To interact with the Events log, configure any of the following filters or perform the following actions:
| Filter | Description |
|---|---|
| Categories | Display log events by category. The default displays all event categories. |
| Status Type | Display events by status: Success, Warning, Failure, or Info. The default displays Any status type. |
| Range (UTC) | Display events logged within the specified range (UTC). The default displays the last seven days up to the current date and time. |
Copy ID fields
For ID fields without a link, you can copy the ID by clicking the copy icon .