Instrument a Workload with OpenTelemetry
The Endpoints > Instrumentation sub-tab provides copy-ready OpenTelemetry (OTel) snippets for emitting traces, logs, and metrics from inside your Workload's container. The platform sets OTEL_EXPORTER_OTLP_ENDPOINT (and any required auth env vars) at container start time, so the snippets work as-is—you don't need to configure the destination.
Optional for basic logs
Container stdout and stderr are captured automatically at every lifecycle stage and surface on the Workload's Activity log > Logs tab without any OTel SDK setup—see View Workload logs. Use these snippets when you want structured, attribute-rich logs, custom spans (traces), or application metrics on top of automatic capture.
To open the Instrumentation sub-tab, on the deployed Workload, click the Endpoints tab, then click Instrumentation in the left navigation bar.
The three snippets shown are independent; copy only the snippets you need. Telemetry emitted by these snippets surfaces in the Console; see Application OpenTelemetry telemetry for the mapping from signal type to Console tab.
Copy the example script
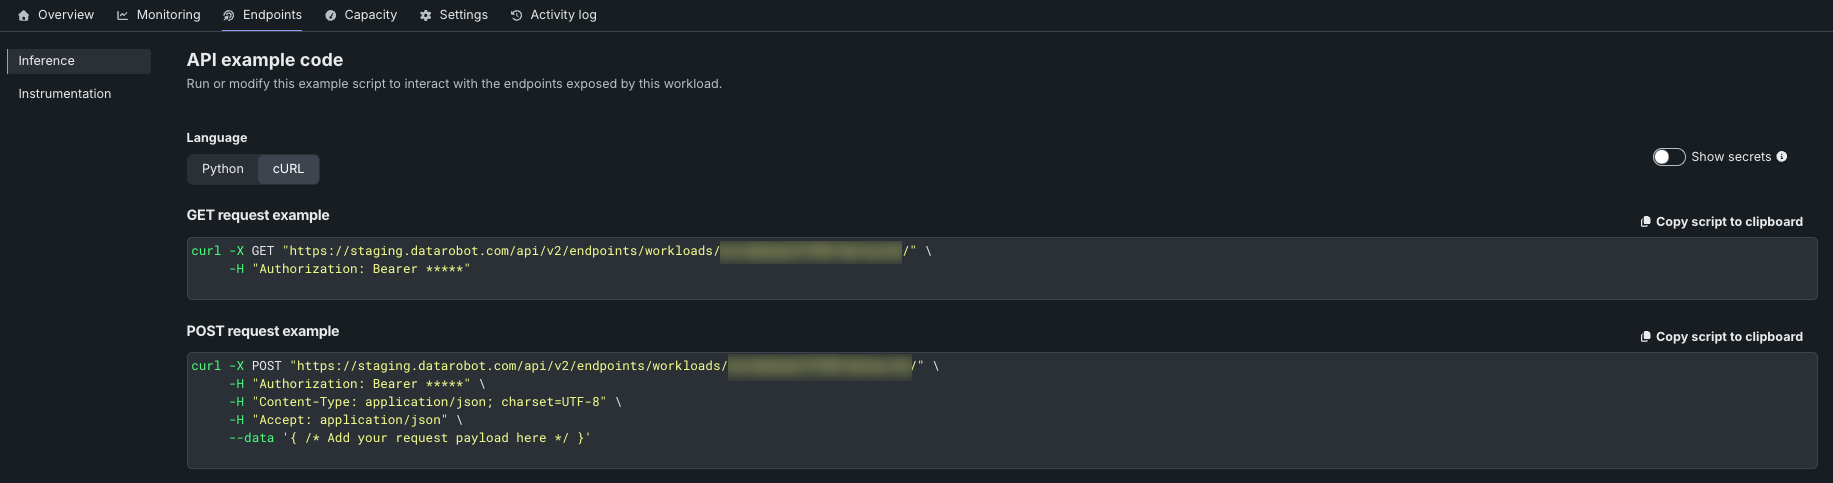
Click the Copy script to clipboard button in the top right corner of the panel to copy the full example.
OTel traces snippet
The traces snippet wires an OTLP HTTP span exporter into a TracerProvider backed by a BatchSpanProcessor, attaches a service.namespace resource attribute, and registers the provider as the global tracer source. It also includes a usage example covering the three common patterns you'll write into application code: setting attributes on a span, attaching events to a span, and nesting an inner span that catches an exception, records it, and sets the span status to ERROR. Once configured, a typical application-side call looks like this:
with tracer.start_as_current_span("Generate Text") as span:
    span.set_attribute("foo", "bar")
OTel logs snippet
The logs snippet configures an OTLP log exporter wrapped in a BatchLogRecordProcessor and a LoggerProvider, then bridges Python's standard logging to OpenTelemetry by attaching an OTLP LoggingHandler to the root logger and setting the root logger level to DEBUG. With that bridge in place, any module that already uses the standard library logger flows through the OTLP exporter alongside your spans—no per-module wiring required. The usage example illustrates emitting at the INFO, WARNING, ERROR, and DEBUG levels with an extra payload for structured context:
logger.info("Logging info.", extra={"extra": "INFO details"})
OTel metrics snippet
The metrics snippet configures an OTLP metric exporter wrapped in a PeriodicExportingMetricReader (default 5-second export interval) and a MeterProvider, then sets the provider as the global meter source. The usage example creates a counter (my.counter) with a name, description, and unit, then increments it with a dimensional attribute payload:
my_counter.add(1, {"environment": "demo"})