Monitor applications
Consistently monitoring applications allows you to proactively detect issues, troubleshoot performance bottlenecks, and quickly respond to service disruptions, minimizing downtime and improving the overall user experience. To access monitoring information, go to the Applications page and click on the app you want to view.
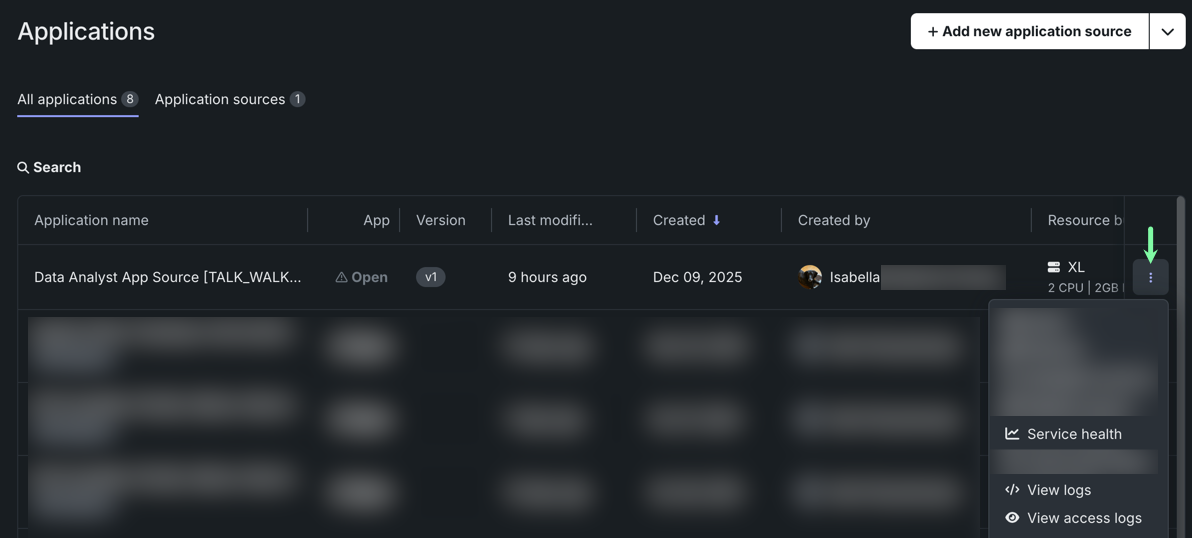
From here, you can access the following monitoring options:
- Service health: Provides a dashboard that displays memory, CPU, and network usage.
- Activity log: Displays access, runtime, build, and version history logs.
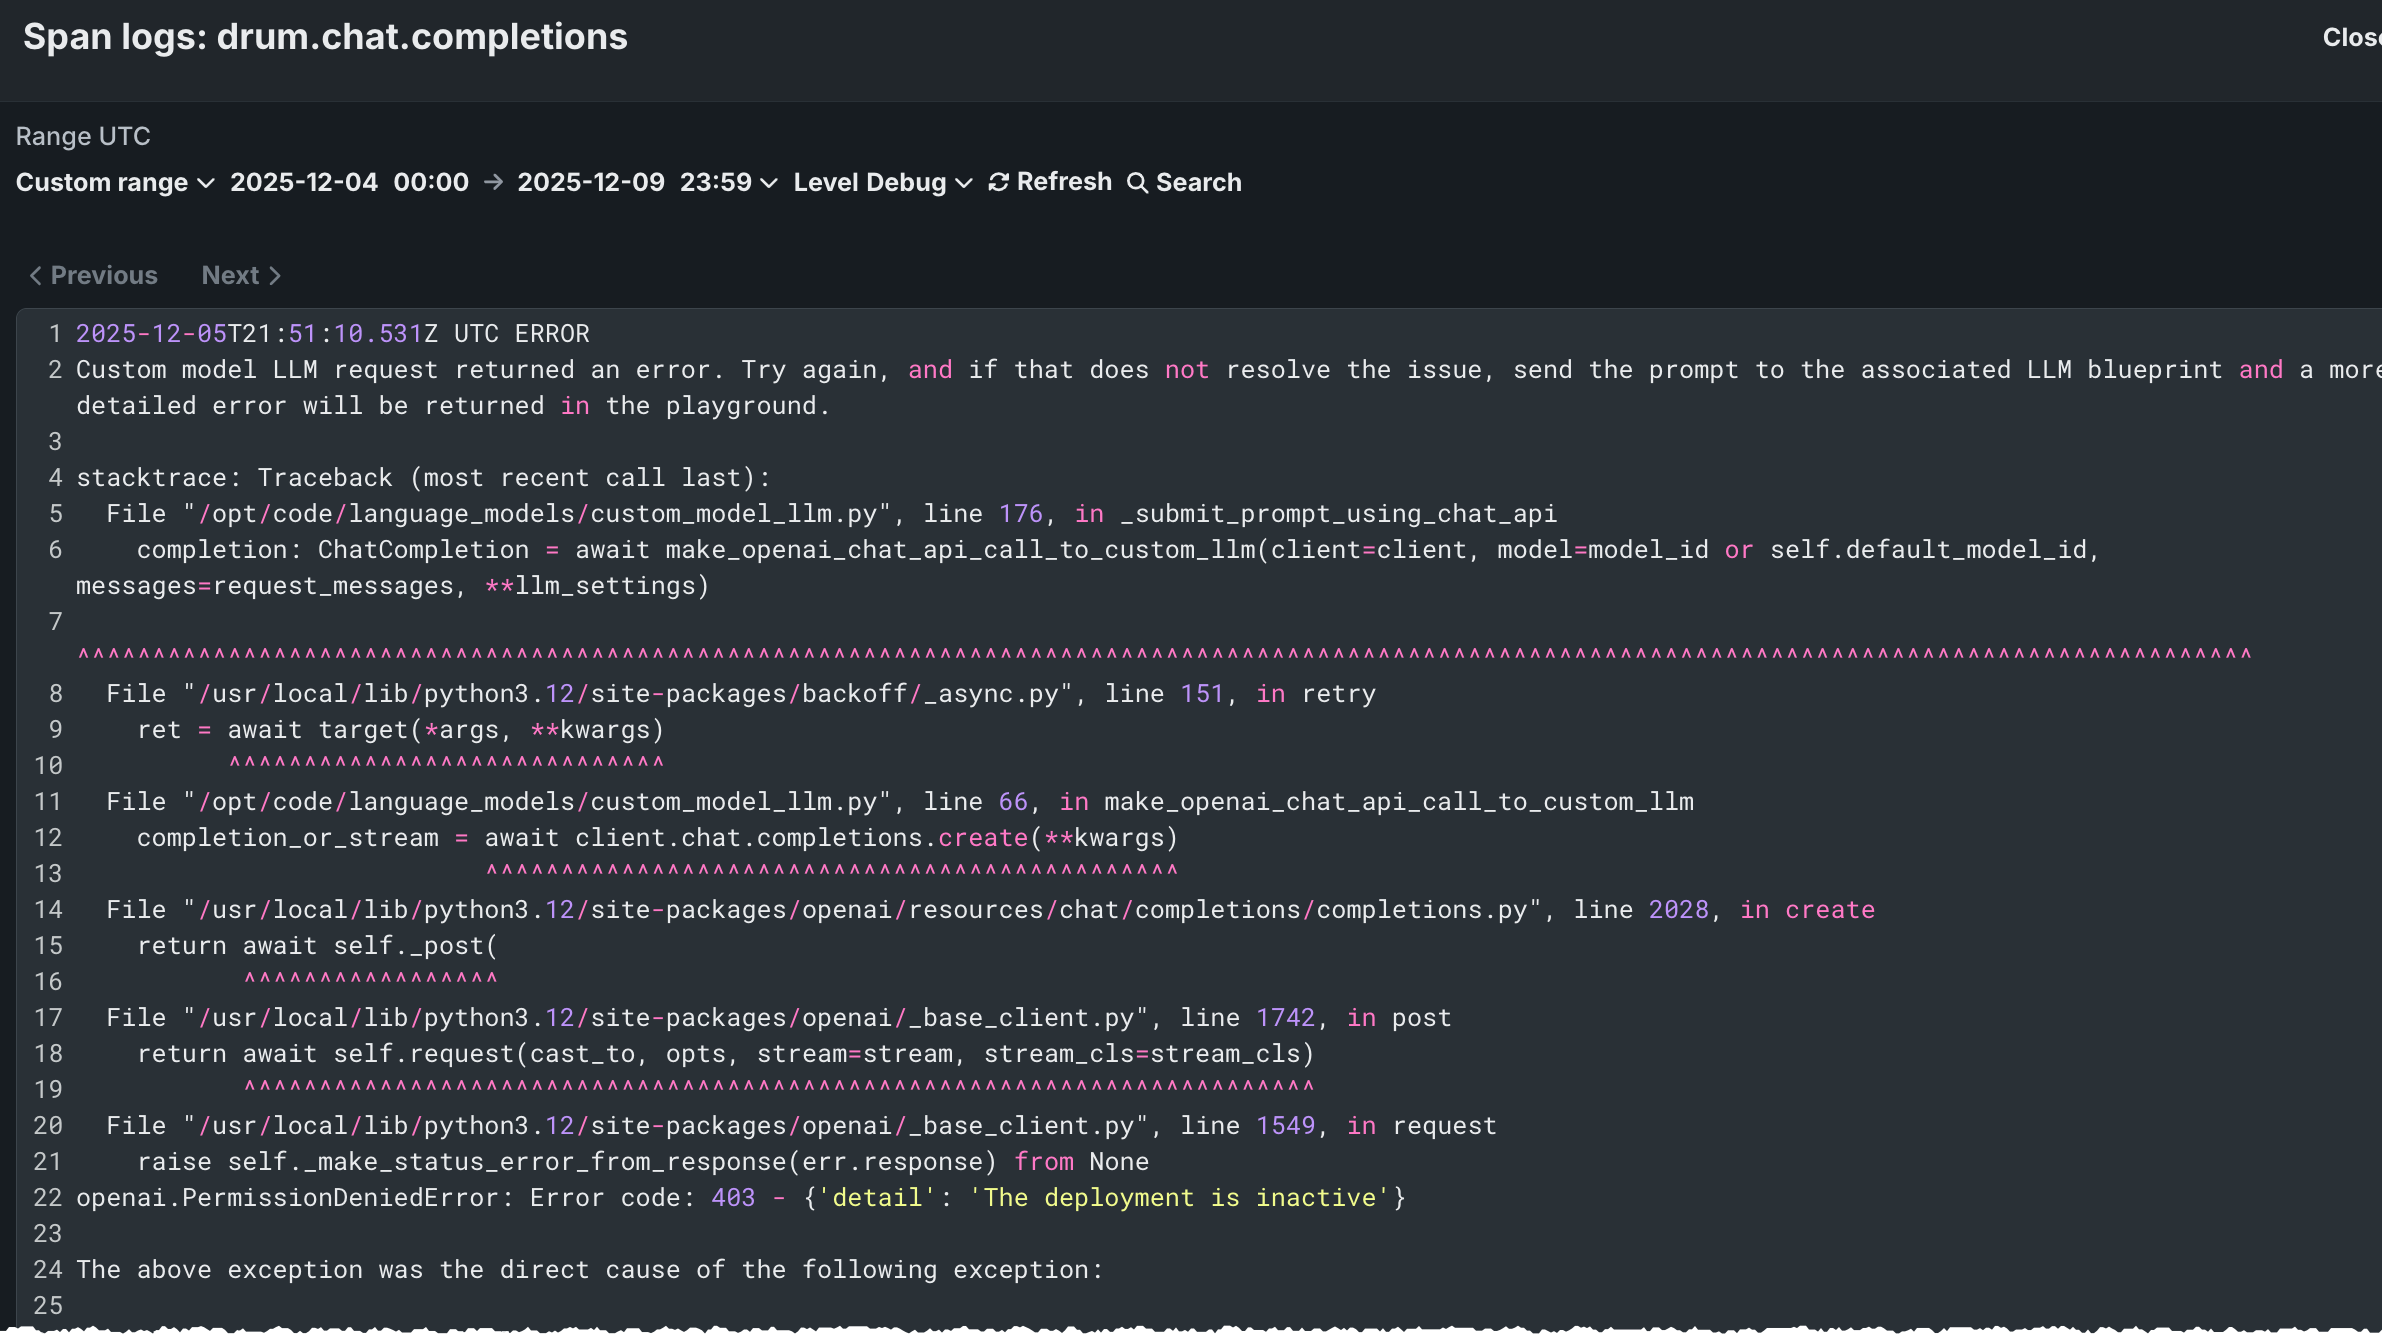
- Tracing: Displays traces from the model or agentic workflow.
Resource usage
Permissions to view service health
Only users with Owner permissions for the application and DataRobot administrators can access service health.
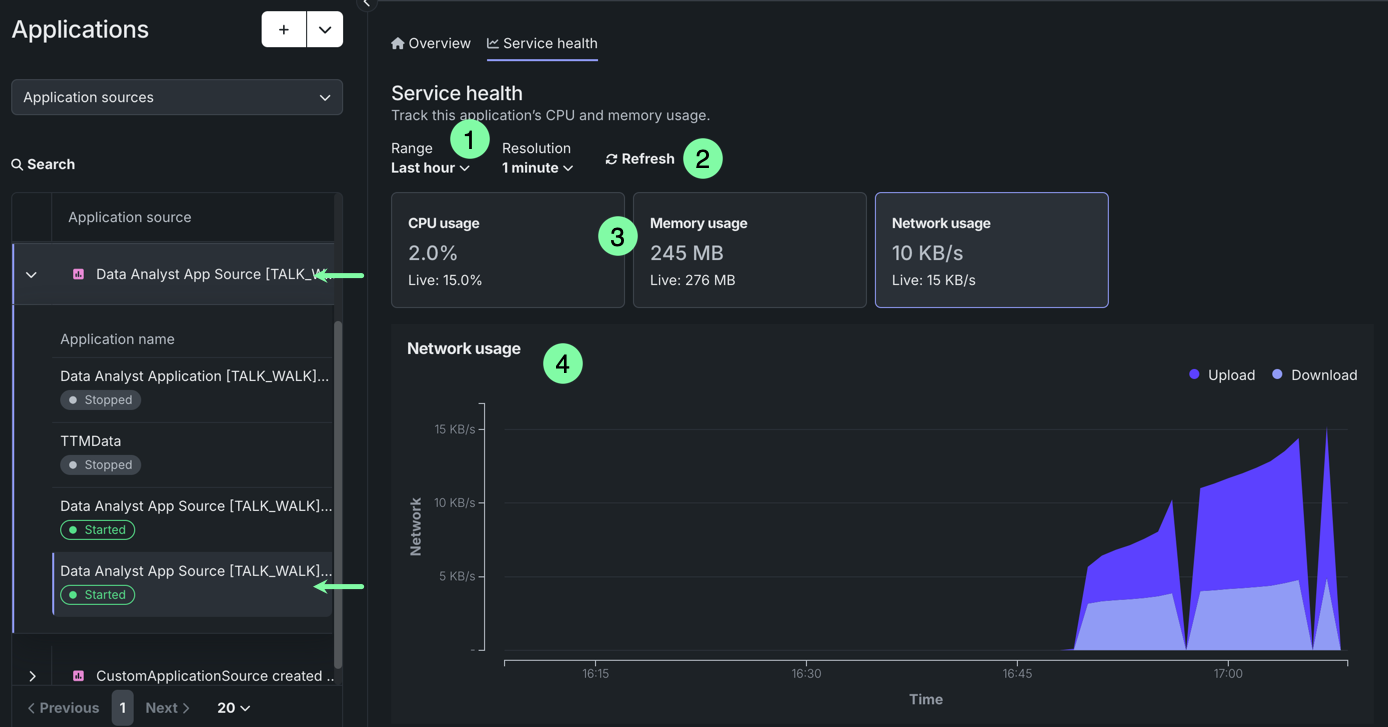
The Service health tab allows you to monitor usage, service health, and resource consumption for individual applications. Monitoring resource consumption is essential for cost management to ensure that resources are used efficiently, helping optimize cost.
To access application monitoring capabilities, on the Applications page, click the app you want to view and select Service health. From here, you can:
| Element | Description | |
|---|---|---|
| 1 | Range/Resolution | Adjusts the range and resolution of the chart. The options in the Resolution dropdown are based on your Range selection. |
| 2 | Refresh | Instantly refreshes usage information—usage information automatically updates every minute. |
| 3 | Resource usage | Displays average CPU, memory, and network usage for the specified range, as well as live usage values. Click on a tile to visualize usage information in the chart below. |
| 4 | Usage chart | Visualizes usage information over time for the selected usage tile and specified range. For CPU usage, you can also display a line representing the average usage. |
Activity logs
Permissions to view logs
Access to activity logs for an application requires Owner or Editor permissions for the application. Sharing the application source does not grant access to activity logs. Owners can view all logs, while Editors can only view build and runtime logs, not access logs.
DataRobot records the following activity logs for custom applications:
| Activity log | Description |
|---|---|
| Access logs | Displays which users have accessed the application and when. |
| Runtime logs | Displays a real-time record of the application's tasks during execution. |
| Build logs | Displays a history of the application's deployment process. |
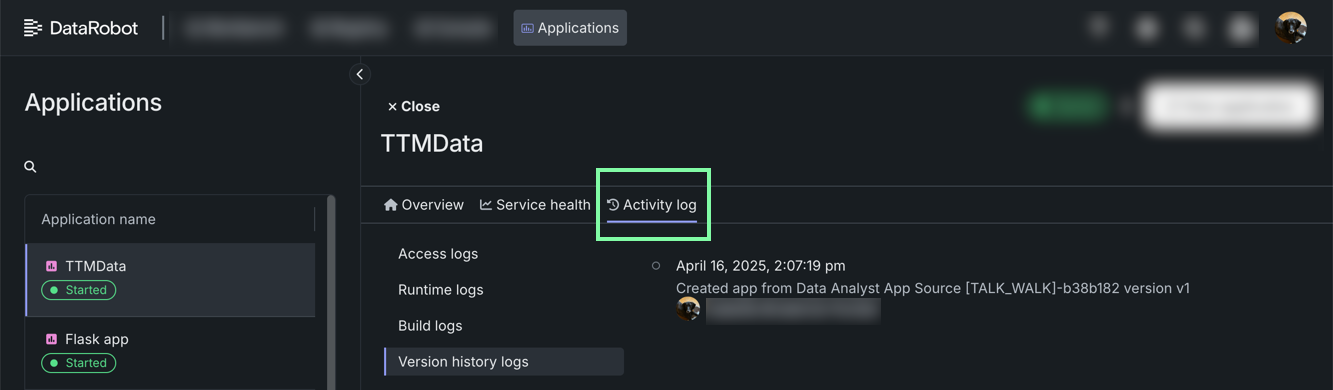
| Version history logs | Displays a time-stamped, chronological record of the application's versions. |
To access these activity logs, from the Applications page, click the app you want to view, and select Activity log.
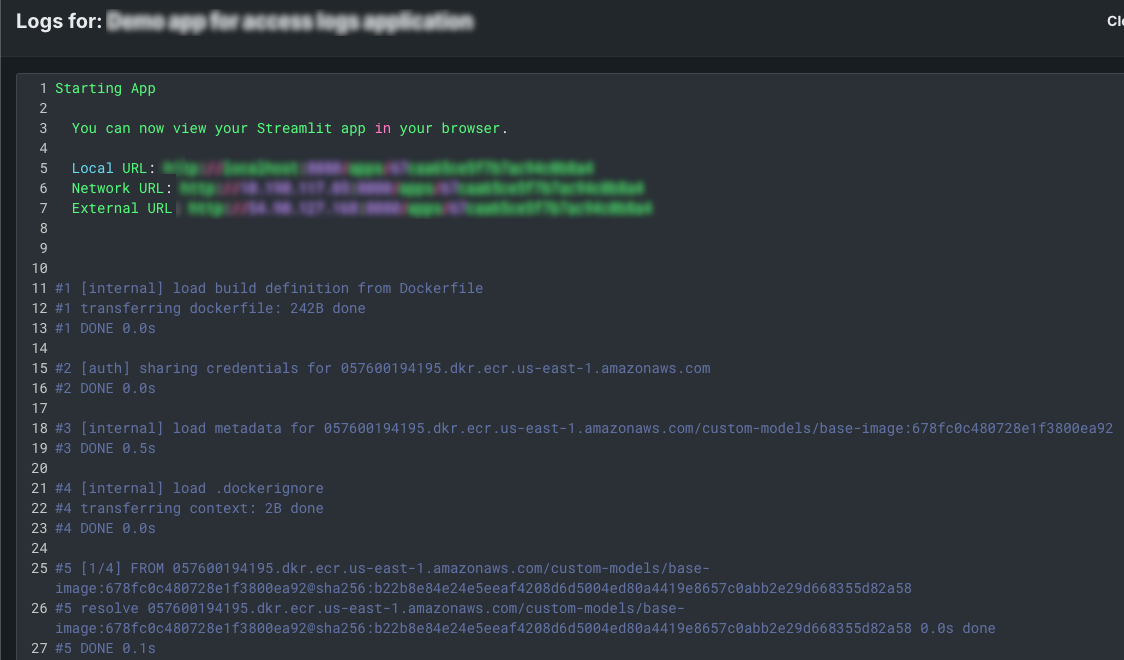
Build and runtime logs
From the Build logs and Runtime logs tabs, you can browse logs that detail the history of compiling, building, and executing the custom application. This includes dependency checks, packaging, and any warnings or errors thrown.
Access logs
From the Access logs tab, you can monitor the history of users who have opened or operated a custom application.
You can also view access logs directly from an application source. Navigate to Registry > Application sources, locate the application source for your custom application, and expand the dropdown to view the applications built from the source. Then, click the custom application you want to view the access logs from to access a detailed view.
On the Overview tab, scroll down to the Access logs section.
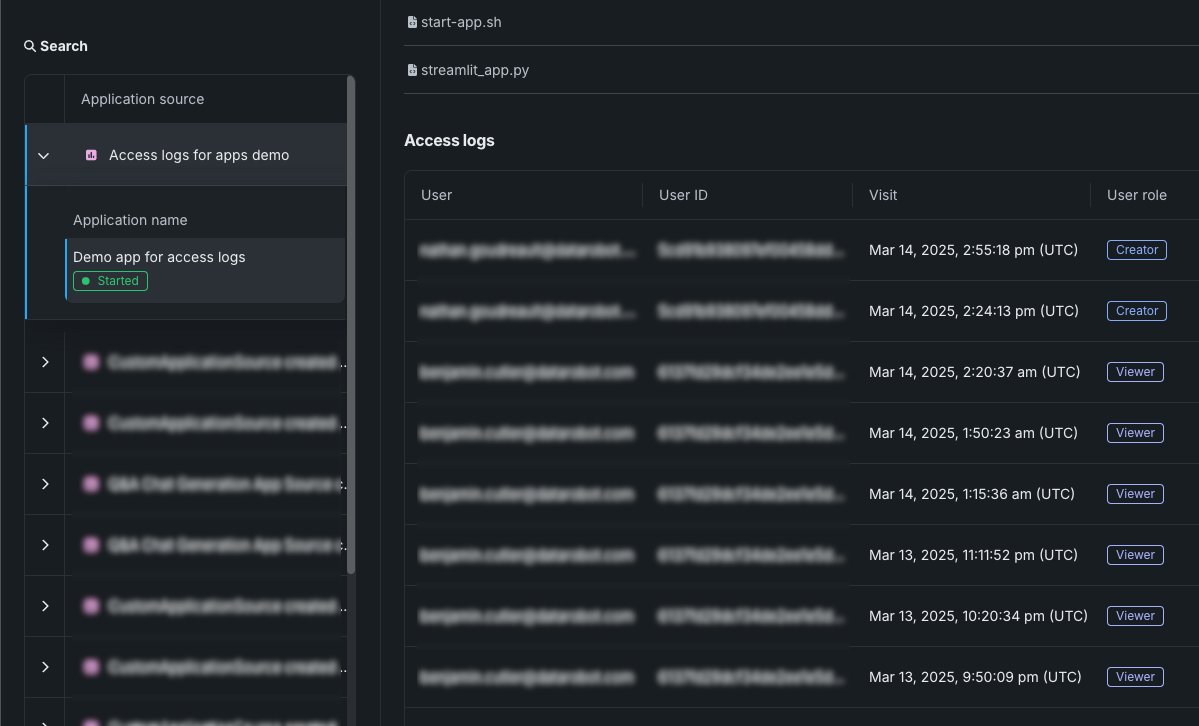
The access logs detail users' visits to the application, including their email, user ID, time of visit, and their role for the application.
Usage logging interval
In addition to the initial access event, every 24 hours of continuous access or use is recorded as an individual visit to the application. For example, when a user opens an application, an access event is logged, then, when that user session exceeds 24 hours of continuous access or use, another access event is logged. This results in two access events logged during a 24-hour and 1-minute custom application visit. In Self-Managed AI Platform environments, this interval is configurable through the CUSTOM_APP_USAGE_METRIC_PUBLISH_MAX_FREQ in the application configuration.
Tracing
Required permissions to view tracing
Access to the Tracing tab requires Owner or Editor permissions for the application. Sharing the application source does not grant access to application traces.
The Tracing tab of an application displays traces from a model or agentic workflow. Each trace contains a visual timeline representing all actions carried out by the model or agent and revealing the order and duration of these actions.
While developing an agent locally, you can add custom OpenTelemetry spans and attributes (for example, runtime configuration values) so they appear in traces after deployment. For setup steps and code examples, see Add custom tracing to agent.
Traces represent the path taken by a request to a model or agentic workflow. DataRobot uses the OpenTelemetry framework for tracing. A trace follows the entire end-to-end path of a request, from origin to resolution. Each trace contains one or more spans, starting with the root span. The root span represents the entire path of the request and contains a child span for each individual step in the process. The root (or parent) span and each child span share the same Trace ID.
Access and retention
The tracing table is available for all custom and external model deployments.
Retention is configured at the organization level by a system administrator and applies to all users in the organization. If a policy isn't set explicitly, trial organizations use a 14-day policy and paying organizations use a 30-day policy. Administrators can set retention per signal type (traces, logs, or metrics) to 14, 30, 60, 90, 180, or 360 days.
To view or change your organization's retention settings, see Configure OTel retention.
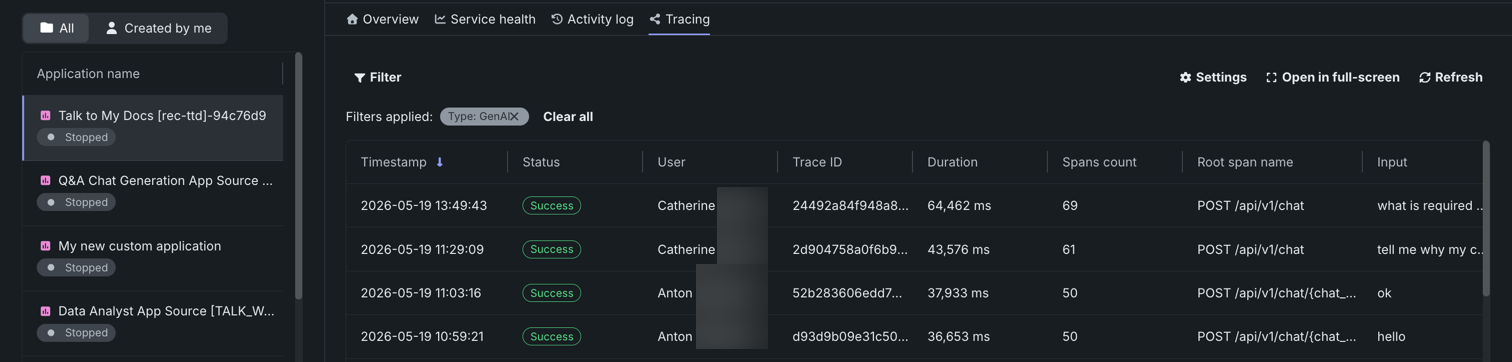
In the Tracing table, you can review the following fields related to each trace:
| Column | Description |
|---|---|
| Timestamp | The date and time of the trace in YYYY-MM-DD HH:MM format. |
| Status | The overall status of the trace, including all spans. The Status will be Error if any dependent task fails. |
| Trace ID | A unique identifier for the trace. |
| Duration | The amount of time, in milliseconds, it took for the trace to complete. This value is equal to the duration of the root span (rounded) and includes all actions represented by child spans. |
| Spans count | The number of completed spans (actions) included in the trace. |
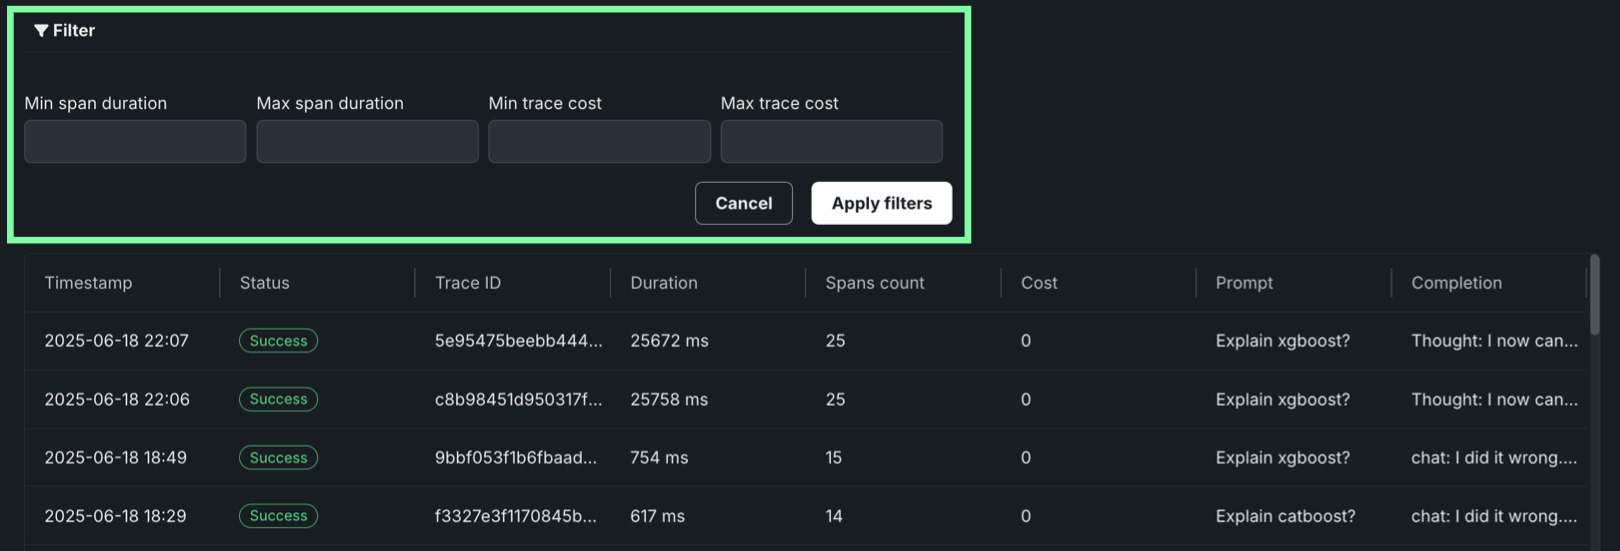
| Cost | If cost data is provided, the total cost of the trace. |
| Prompt | The user prompt related to the trace. |
| Completion | The agent or model response (completion) associated with the prompt for the trace. |
| Tools | The tool or tools called during the request represented by the trace. |
Click Filter to filter by Min span duration, Max span duration, Min trace cost, and Max trace cost. The unit for span filters is nanoseconds (ns), the chart displays spans in milliseconds (ms).
Filter accessibility
The Filter button is hidden when a span is expanded to detail view. To return to the chart view with the filter, click Hide details panel.
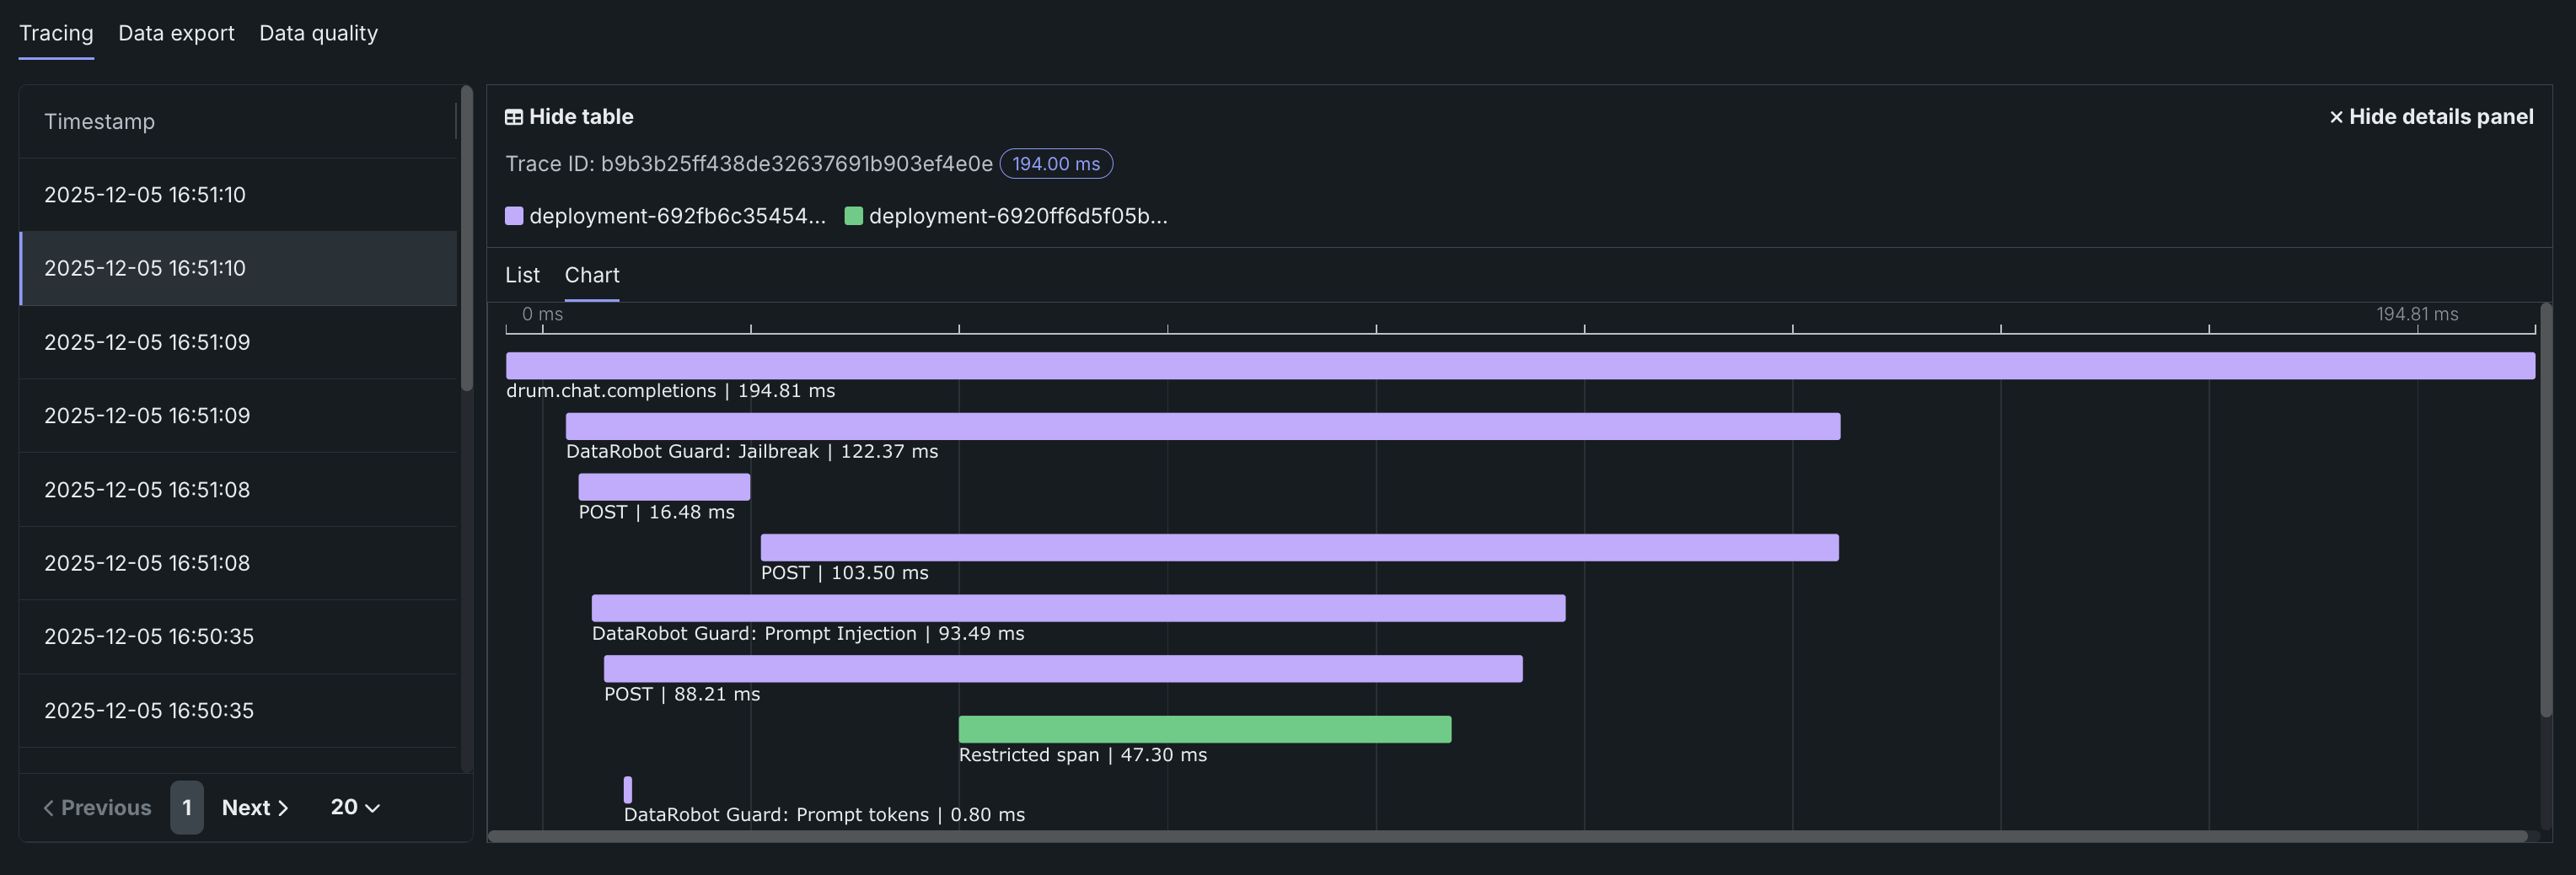
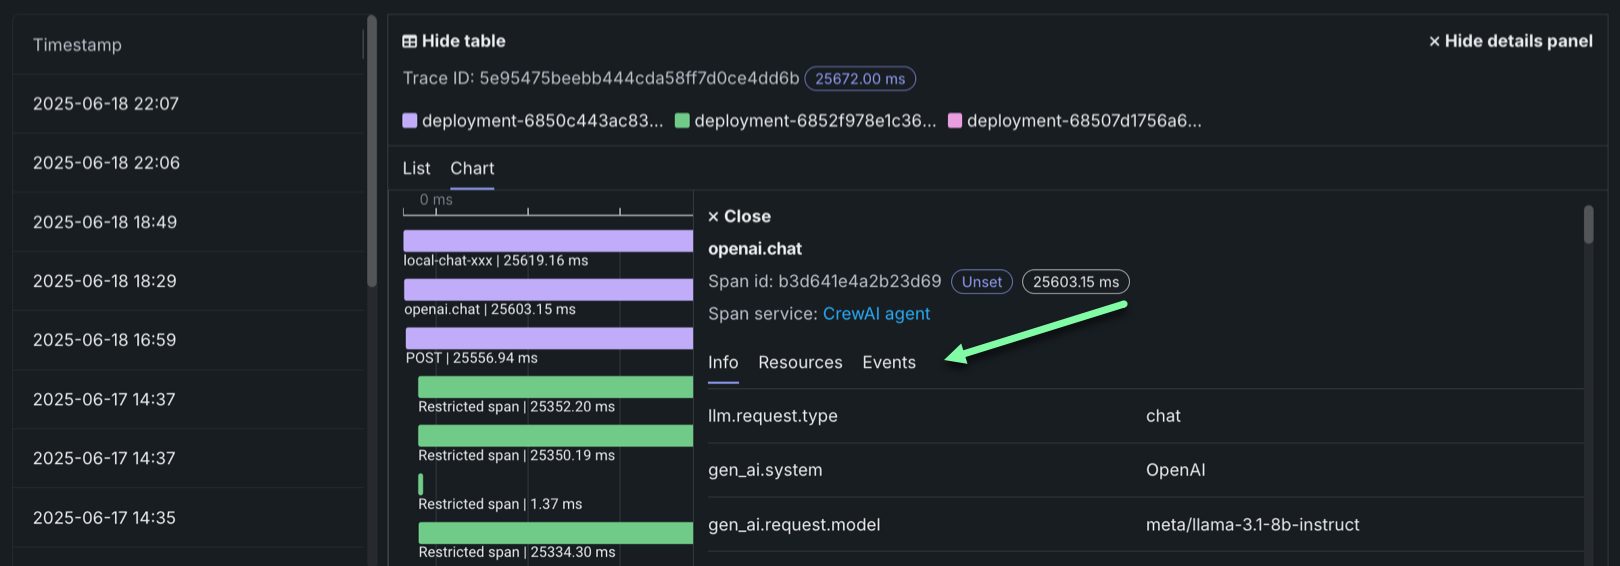
To review the spans contained in a trace, along with trace details, click a trace row in the Tracing table. The span colors correspond to a Span service, usually a deployment. Restricted span appears when you don’t have access to the deployment or service associated with the span. You can view spans in Chart format or List format.
Span detail controls
From either view, you can click Hide table to collapse the Timestamps table or Hide details panel to return to the expanded Tracing table view.
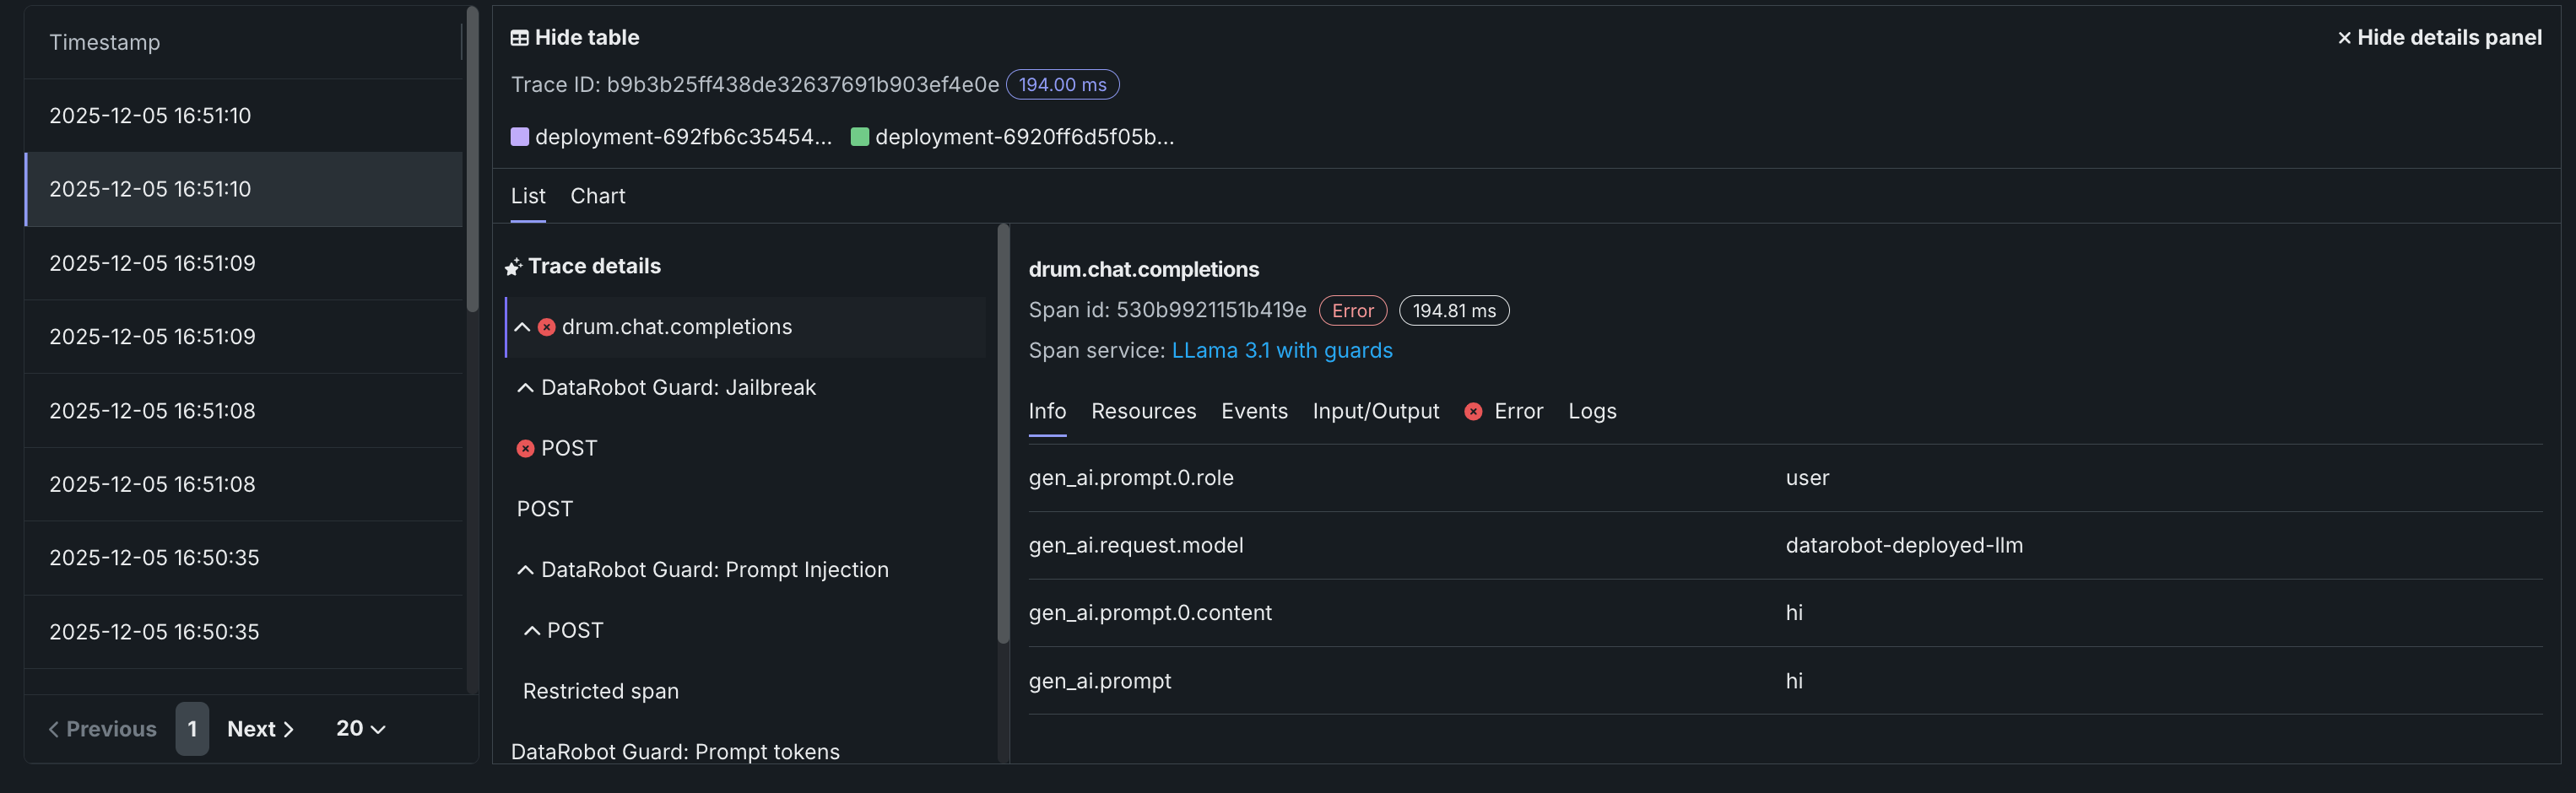
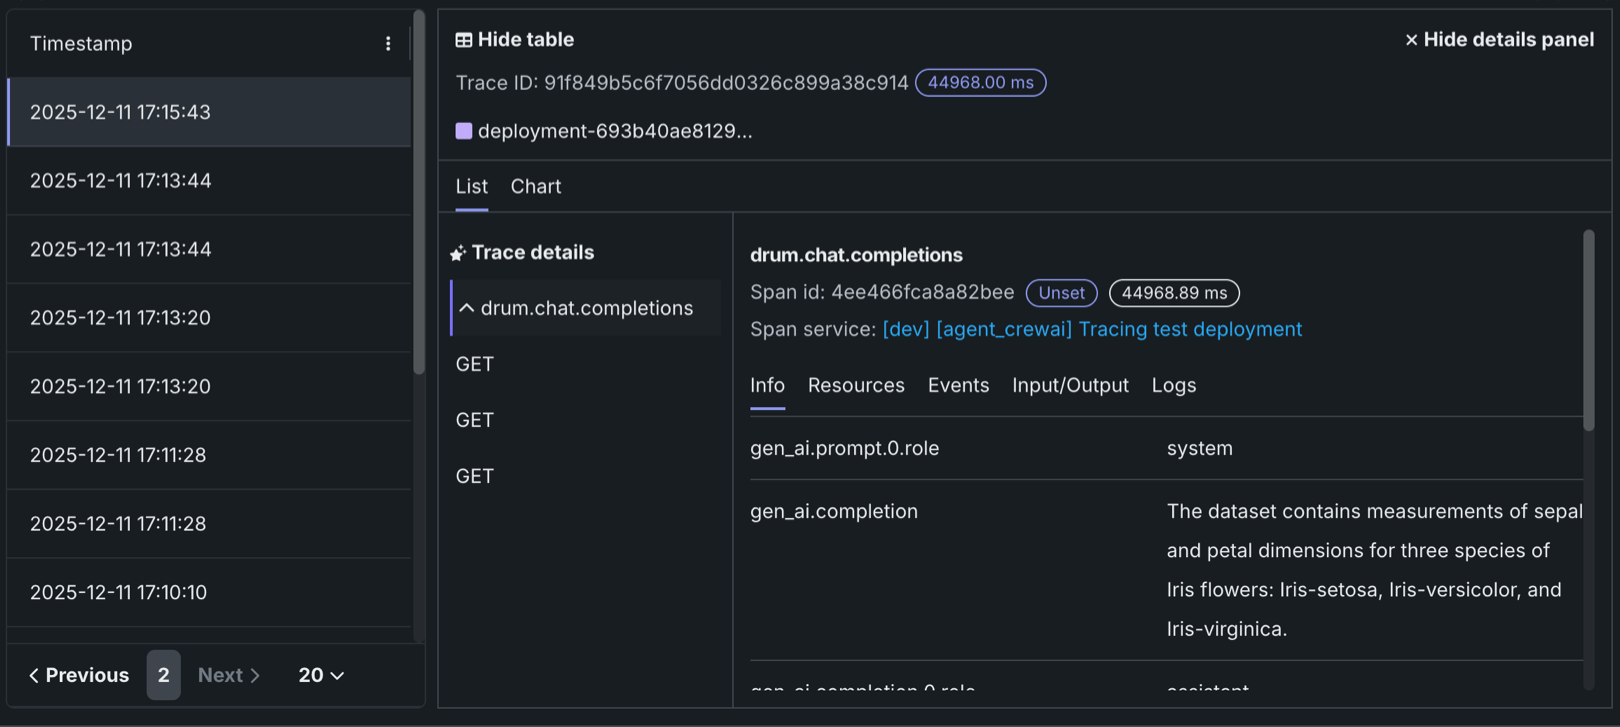
Trace details
In list view, you can click Trace details to view the Input/Output (Prompt and Completion) and Evaluation details about the trace associated with the current span.
For either view, click the Span service name to access the deployment or resource (if you have access). Additional information, dependent on the configuration of the generative AI model or agentic workflow, is available on the Info, Resources, Events, Input/Output, Error, and Logs tabs. The Error tab only appears when an error occurs in a trace.
Filter tracing logs
From the list view, you can display OTel logs for a span. The results shown are a subset of the full deployment logs, and are accessed as follows:
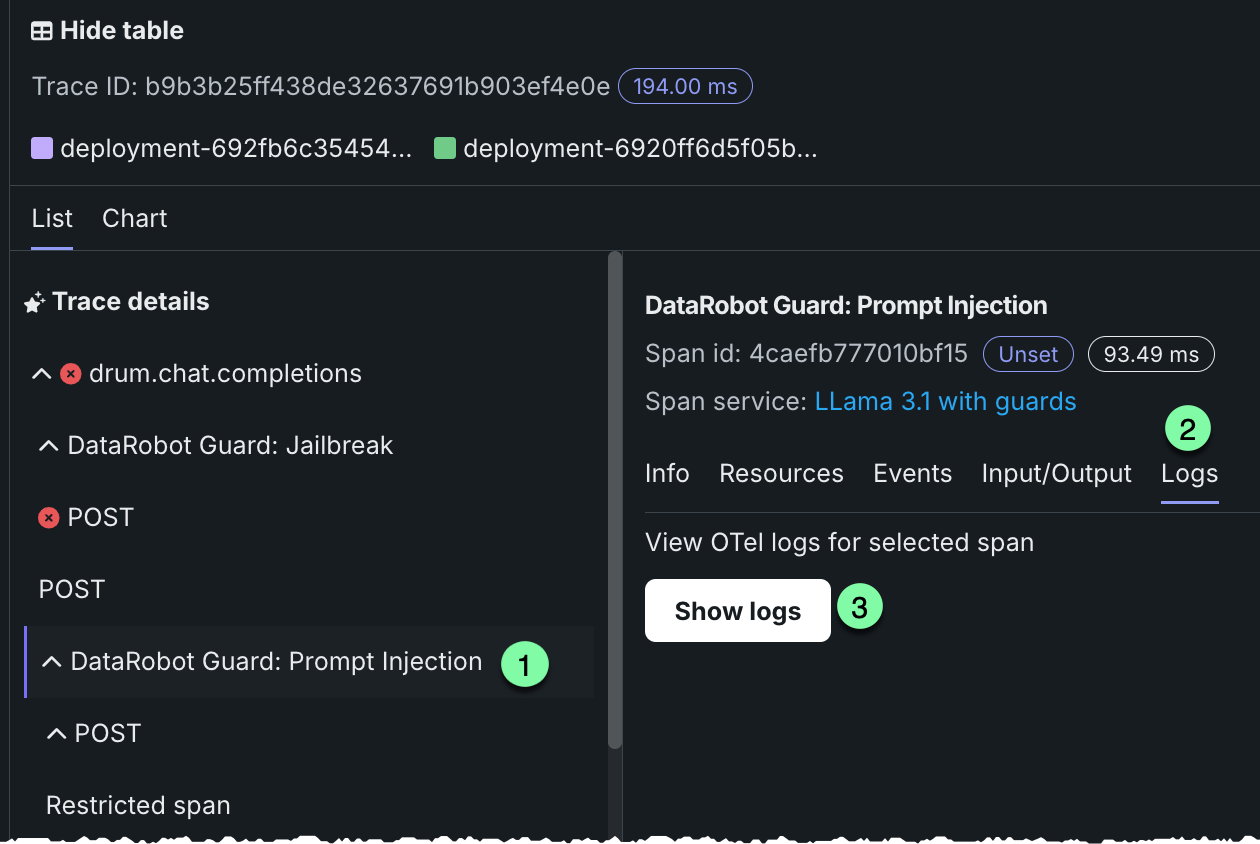
-
Open the list view and select a span under Trace details.
-
Click the Logs tab.
-
Click Show logs.
Tracing table OTel attributes
For Cost, Prompt, Completion, and Tools, DataRobot reads specific span attributes across all spans that belong to the trace. Other columns (such as Timestamp and Duration) come from trace and span metadata rather than these attributes.
| Column | OpenTelemetry mapping |
|---|---|
| Cost | Sums numeric values from the datarobot.moderation.cost attribute on spans in the trace (when that attribute is present). |
| Prompt | Uses the gen_ai.prompt attribute. If more than one span includes gen_ai.prompt, the first value encountered in trace order is shown. |
| Completion | Uses the gen_ai.completion attribute. If more than one span includes gen_ai.completion, the last value encountered in trace order is shown. |
| Tools | Collects every distinct value of the tool_name attribute found on spans in the trace and lists those tool names in the column. |
Attribute keys must match exactly (including the underscore in gen_ai). Names such as genai.prompt or GenAI.prompt are not read for the Prompt and Completion columns.
Automatic instrumentation (including DataRobot agent templates) often sets gen_ai.prompt, gen_ai.completion, and sometimes tool_name. For custom or external models, frameworks differ: tool execution may not emit tool_name even when tools run (for example, some LangGraph callback flows). In that case Prompt and Completion can populate while Tools remains empty until tool_name is configured on a span that runs inside the tool—see Implement tracing.