Implement tracing
OpenTelemetry (OTEL) provides comprehensive observability for your agents, allowing you to monitor, trace, and debug agent execution in real-time. This guide explains how to add custom tracing to your agent tools to capture detailed execution information.
OpenTelemetry tracing helps:
- Monitor agent performance and execution flow.
- Debug issues by tracking detailed execution traces.
- Understand tool execution patterns and timing.
- View custom attributes and metadata from your tools.
The agent templates already include OpenTelemetry instrumentation for frameworks like CrewAI, LangGraph, and Llama-Index. This instrumentation automatically captures spans for:
- Agent execution
- Tool invocations
- LLM API calls
- HTTP requests
You can enhance this default tracing by adding custom spans and attributes in your tools.
Add custom tracing to tools
Add custom OpenTelemetry tracing to your tools to capture additional information about tool execution. This allows you to track custom attributes, intermediate outputs, and execution details that are specific to your use case.
The basic pattern for adding custom tracing to a tool is:
from opentelemetry import trace

tracer = trace.get_tracer(__name__)

# Within your tool's execution
with tracer.start_as_current_span("my_custom_span_name"):
    current_span = trace.get_current_span()
    current_span.set_attribute("custom.attribute", "value")

    # Your tool logic here
    result = perform_tool_action()

    # Optionally add more attributes about the result
    current_span.set_attribute("result.status", "success")
    current_span.set_attribute("result.size", len(result))

    return result
Tool examples
See the code examples below to learn how to add custom OpenTelemetry tracing to agentic tools:
import requests
from crewai.tools import BaseTool
from opentelemetry import trace

tracer = trace.get_tracer(__name__)

class WeatherTool(BaseTool):
    name = "weather_tool"
    description = (
        "Fetches the current weather for a specified city. "
        "Requires an API key from OpenWeatherMap."
    )

    def run(self, city: str) -> str:
        with tracer.start_as_current_span("weather_tool_fetch"):
            current_span = trace.get_current_span()

            # Set custom attributes
            current_span.set_attribute("weather.city", city)
            current_span.set_attribute("weather.api", "openweathermap")

            api_key = "YOUR_API_KEY"  # Replace with your API key
            base_url = "http://api.openweathermap.org/data/2.5/weather"
            params = {"q": city, "appid": api_key, "units": "metric"}

            try:
                response = requests.get(base_url, params=params, timeout=10)
                response.raise_for_status()

                data = response.json()
                weather = data['weather'][0]
                main = data['main']

                # Add result attributes
                current_span.set_attribute("weather.temperature", main['temp'])
                current_span.set_attribute("weather.condition", weather['main'])

                result = (
                    f"Current weather in {data['name']}, {data['sys']['country']}:\n"
                    f"Temperature: {main['temp']}°C (feels like {main['feels_like']}°C)\n"
                    f"Condition: {weather['main']} - {weather['description']}\n"
                    f"Humidity: {main['humidity']}%\n"
                    f"Pressure: {main['pressure']} hPa"
                )

                return result

            except requests.exceptions.RequestException as e:
                current_span.set_attribute("weather.error", str(e))
                return f"Error fetching weather data: {str(e)}"
import requests
from langchain_core.tools import Tool
from opentelemetry import trace

tracer = trace.get_tracer(__name__)

class WeatherTool(Tool):
    name = "weather_tool"
    description = (
        "Fetches the current weather for a specified city. "
        "Requires an API key from OpenWeatherMap."
    )

    def run(self, city: str) -> str:
        with tracer.start_as_current_span("weather_tool_fetch"):
            current_span = trace.get_current_span()

            # Set custom attributes
            current_span.set_attribute("weather.city", city)

            api_key = "YOUR_API_KEY"  # Replace with your API key
            base_url = "http://api.openweathermap.org/data/2.5/weather"
            params = {"q": city, "appid": api_key, "units": "metric"}

            try:
                response = requests.get(base_url, params=params, timeout=10)
                response.raise_for_status()

                data = response.json()

                # Add result attributes
                current_span.set_attribute("weather.temperature", data['main']['temp'])

                result = f"Temperature in {city}: {data['main']['temp']}°C"
                return result

            except requests.exceptions.RequestException as e:
                current_span.set_attribute("weather.error", str(e))
                return f"Error: {str(e)}"
import requests
from llama_index.tools import BaseTool
from opentelemetry import trace

tracer = trace.get_tracer(__name__)

class WeatherTool(BaseTool):
    name = "weather_tool"
    description = (
        "Fetches the current weather for a specified city. "
        "Requires an API key from OpenWeatherMap."
    )

    def _run(self, city: str) -> str:
        with tracer.start_as_current_span("weather_tool_fetch"):
            current_span = trace.get_current_span()

            # Set custom attributes
            current_span.set_attribute("weather.city", city)

            api_key = "YOUR_API_KEY"  # Replace with your API key
            base_url = "http://api.openweathermap.org/data/2.5/weather"
            params = {"q": city, "appid": api_key, "units": "metric"}

            try:
                response = requests.get(base_url, params=params, timeout=10)
                response.raise_for_status()

                data = response.json()

                # Add result attributes
                current_span.set_attribute("weather.temperature", data['main']['temp'])

                result = f"Temperature in {city}: {data['main']['temp']}°C"
                return result

            except requests.exceptions.RequestException as e:
                current_span.set_attribute("weather.error", str(e))
                return f"Error: {str(e)}"
Create nested spans
Create nested spans to represent complex tool execution with multiple steps:
from opentelemetry import trace

tracer = trace.get_tracer(__name__)

def complex_tool_workflow(input_data):
    with tracer.start_as_current_span("complex_tool_main"):
        current_span = trace.get_current_span()
        current_span.set_attribute("input.size", len(input_data))

        # First step in the workflow
        with tracer.start_as_current_span("data_processing"):
            processed_data = process_data(input_data)
            trace.get_current_span().set_attribute("processed_items", len(processed_data))

        # Second step in the workflow
        with tracer.start_as_current_span("data_validation"):
            validated_data = validate_data(processed_data)
            trace.get_current_span().set_attribute("validated_items", len(validated_data))

        # Third step in the workflow
        with tracer.start_as_current_span("result_generation"):
            result = generate_result(validated_data)
            current_span.set_attribute("result.size", len(result))

        return result
Add events to spans
Add events to your spans to mark important moments in tool execution:
from opentelemetry import trace
from datetime import datetime

tracer = trace.get_tracer(__name__)

def tool_with_events():
    with tracer.start_as_current_span("tool_execution"):
        current_span = trace.get_current_span()

        # Add an event for when processing starts
        current_span.add_event(
            "Processing started",
            {"timestamp": datetime.utcnow().isoformat()}
        )

        # Your tool logic
        intermediate_result = perform_action()

        # Add an event for mid-execution
        current_span.add_event(
            "Intermediate result ready",
            {"result_count": len(intermediate_result)}
        )

        # More processing
        final_result = complete_processing(intermediate_result)

        # Add final event
        current_span.add_event(
            "Processing completed",
            {"output_size": len(final_result)}
        )

        return final_result
Add custom tracing to agent
You can set up a custom trace to capture how your agent starts up, including configurations and environment details. Follow the steps below to surface runtime parameters (like environment variables) on a span:
-
Update your
.envfile to contain the following environment variable so it's available during local development and when you package the model:EXAMPLE_ENV_VAR=my_example_value -
Add the parameter to
writer_agent/agentic_workflow/model-metadata.yamlso DataRobot can inject it when the agent runs:runtimeParameterDefinitions: - fieldName: EXAMPLE_ENV_VAR type: string defaultValue: SET_VIA_PULUMI_OR_MANUALLY -
Update
infra/infra/llm.pyto forward the runtime parameter into the custom model environment:custom_model_runtime_parameters = [ # ...existing parameters... datarobot.CustomModelRuntimeParameterValueArgs( key="EXAMPLE_ENV_VAR", type="string", value=os.environ.get("EXAMPLE_ENV_VAR"), ), ] -
Wrap the configuration loading code in a span and attach the values with
set_attributeandadd_event:@property def agent_planner(self) -> Any: with tracer.start_as_current_span("config_variables"): current_span = trace.get_current_span() current_span.set_attribute("config.example_env_var", config.example_env_var) current_span.add_event("config attribute set on span") # ...agent code continued...
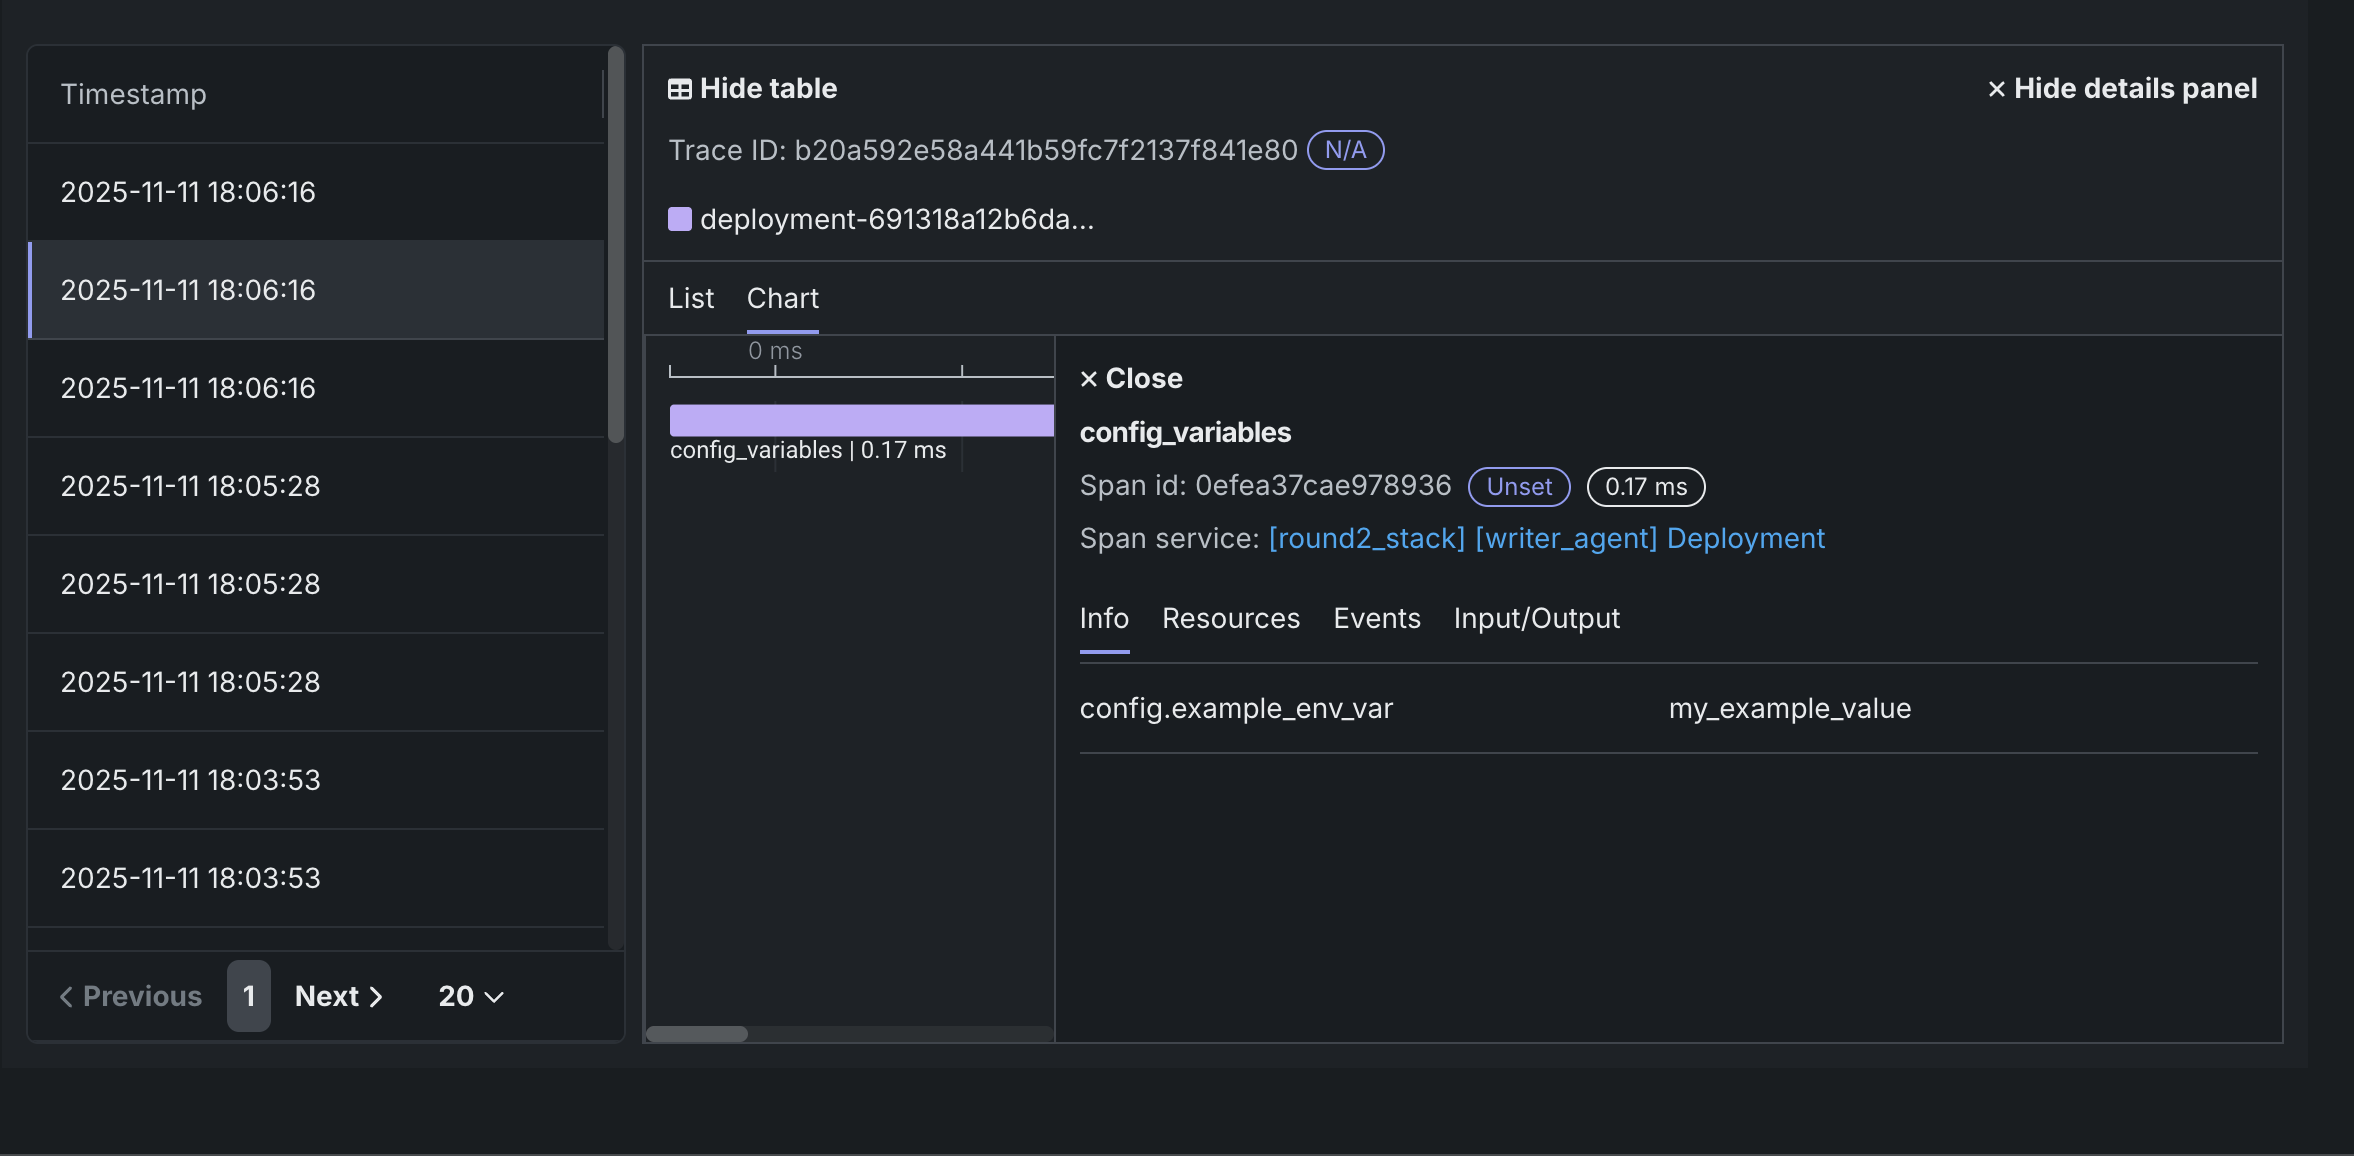
When you deploy and run the agent, the trace visualizer shows a config_variables span with attributes such as config.example_env_var=my_example_value. This makes it easy to confirm that runtime parameters and other environment values were loaded correctly.
Best practices
- Use descriptive span names:
- Use clear, descriptive names for spans (e.g.,
"weather_fetch"rather than"span1"). - Include the tool name in the span name when relevant.
- Use clear, descriptive names for spans (e.g.,
- Set meaningful attributes:
- Add attributes that provide context about the execution.
- Use consistent attribute naming conventions (e.g.,
tool.input,tool.output,tool.error). - Include relevant metadata like sizes, counts, or statuses.
- Keep spans focused:
- Create spans for significant operations, not every line of code.
- Each span should represent a meaningful unit of work.
- Use nested spans to represent sub-operations.