Monitor resource utilization
The Monitoring > Resource monitoring tab provides visibility into resource utilization metrics for a Workload, helping you monitor performance, identify bottlenecks, and understand autoscaling behavior. Use this tab to evaluate resource usage, navigate trade-offs between speed and cost, and ensure the Workload efficiently uses its allocated resources.
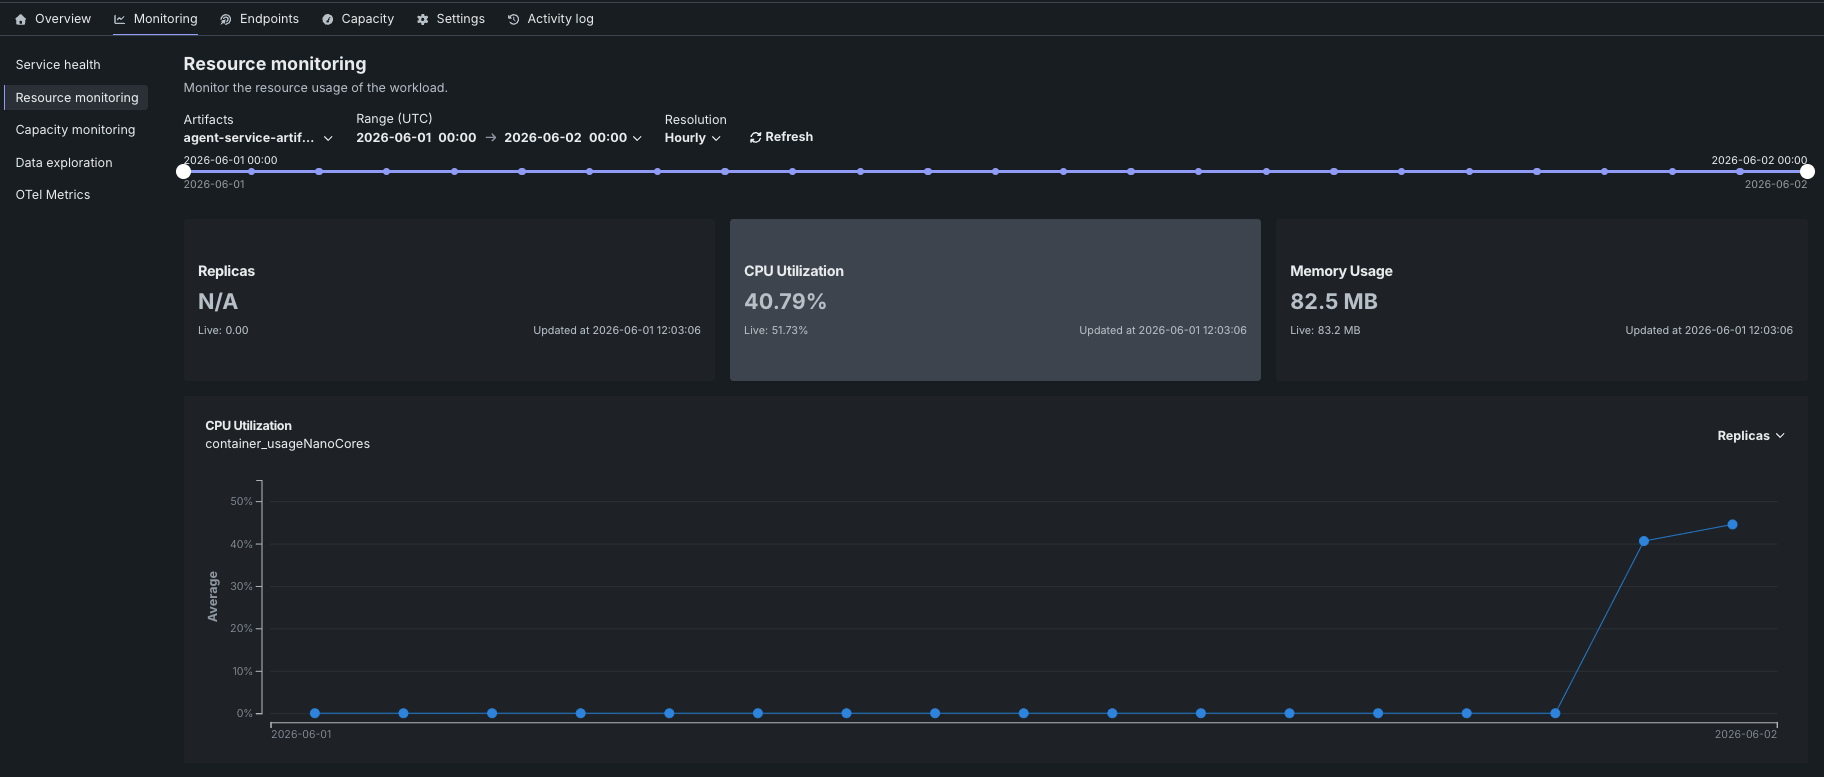
To access Resource monitoring, select a Workload from the Deployed Workloads list and then click Monitoring > Resource monitoring. The tab displays summary tiles showing aggregated and current values for key metrics, along with an interactive chart that visualizes resource utilization over time.
Resource utilization summary tiles
The Resource monitoring tab displays summary tiles at the top of the page, showing both the aggregated value over the selected timespan (the primary value) and the Live value at the time of the request. The aggregated value represents the average value over the selected timespan. Each tile also shows the timestamp of the most recent update. Click a metric tile to update the paired chart to display that metric over time.
The following metrics are displayed as summary tiles:
| 指標 | 説明 |
|---|---|
| レプリカ | プラットフォームが現在ランタイムメトリクスから監視しているアクティブレプリカ。ワークロード設定におけるreplicaCountではありません。 スケールアップ、置換、またはオートスケーリングイベントの後、ポッドの準備が整い、レポートが送信されるまで、この値に遅延が生じる場合があります。 |
| CPU Utilization / GPU Utilization | The percentage of CPU or GPU cores being used across the Workload's replicas. |
| メモリー使用量 | The amount of memory being used across the Workload's replicas. Displayed in bytes or appropriate units (KB, MB, GB) based on the scale of usage. |
設定されたレプリカ数
リクエストされているレプリカ数は、設定またはGET /workloads/{workload_id}/settings(ランタイム設定)で確認してください。 レプリカタイルには、現在実行中のレプリカが表示されます。
Resource utilization chart
The Resource monitoring tab displays an interactive chart that visualizes the selected metric over time, helping you identify patterns and understand resource consumption trends.
The chart displays the selected metric over time, with the following elements:
| チャートの要素 | 説明 |
|---|---|
| Time (X-axis) | Displays the time represented by each data point, based on the selected resolution. |
| Metric value (Y-axis) | 各期間のレプリカ数(カーディナリティ)、またはCPU、GPU、メモリーの平均値を表示します。 |
To view additional information on the chart, hover over a data point to see the time range and metric value.
You can configure the Resource monitoring dashboard to focus on specific time frames. 次のコントロールを使用できます。
| コントロール | 説明 |
|---|---|
| アーティファクト | ダッシュボードを更新し、選択したアーティファクトのリソース使用状況を表示します。 過去の統計データはそのアーティファクトに限定されているため、置き換え前後のリソース使用状況を簡単に比較することができます。 |
| 範囲 (UTC) | Sets the date range displayed for the Workload date slider. 日付スライダーをドラッグして範囲を設定することもできます。 |
| 単位 | Sets the time granularity of the Workload date slider. Available options are Minutes, Hourly, Daily, and Weekly. |
| 表示を更新 | 新しいデータを使用してダッシュボードのオンデマンド更新を開始します。 |
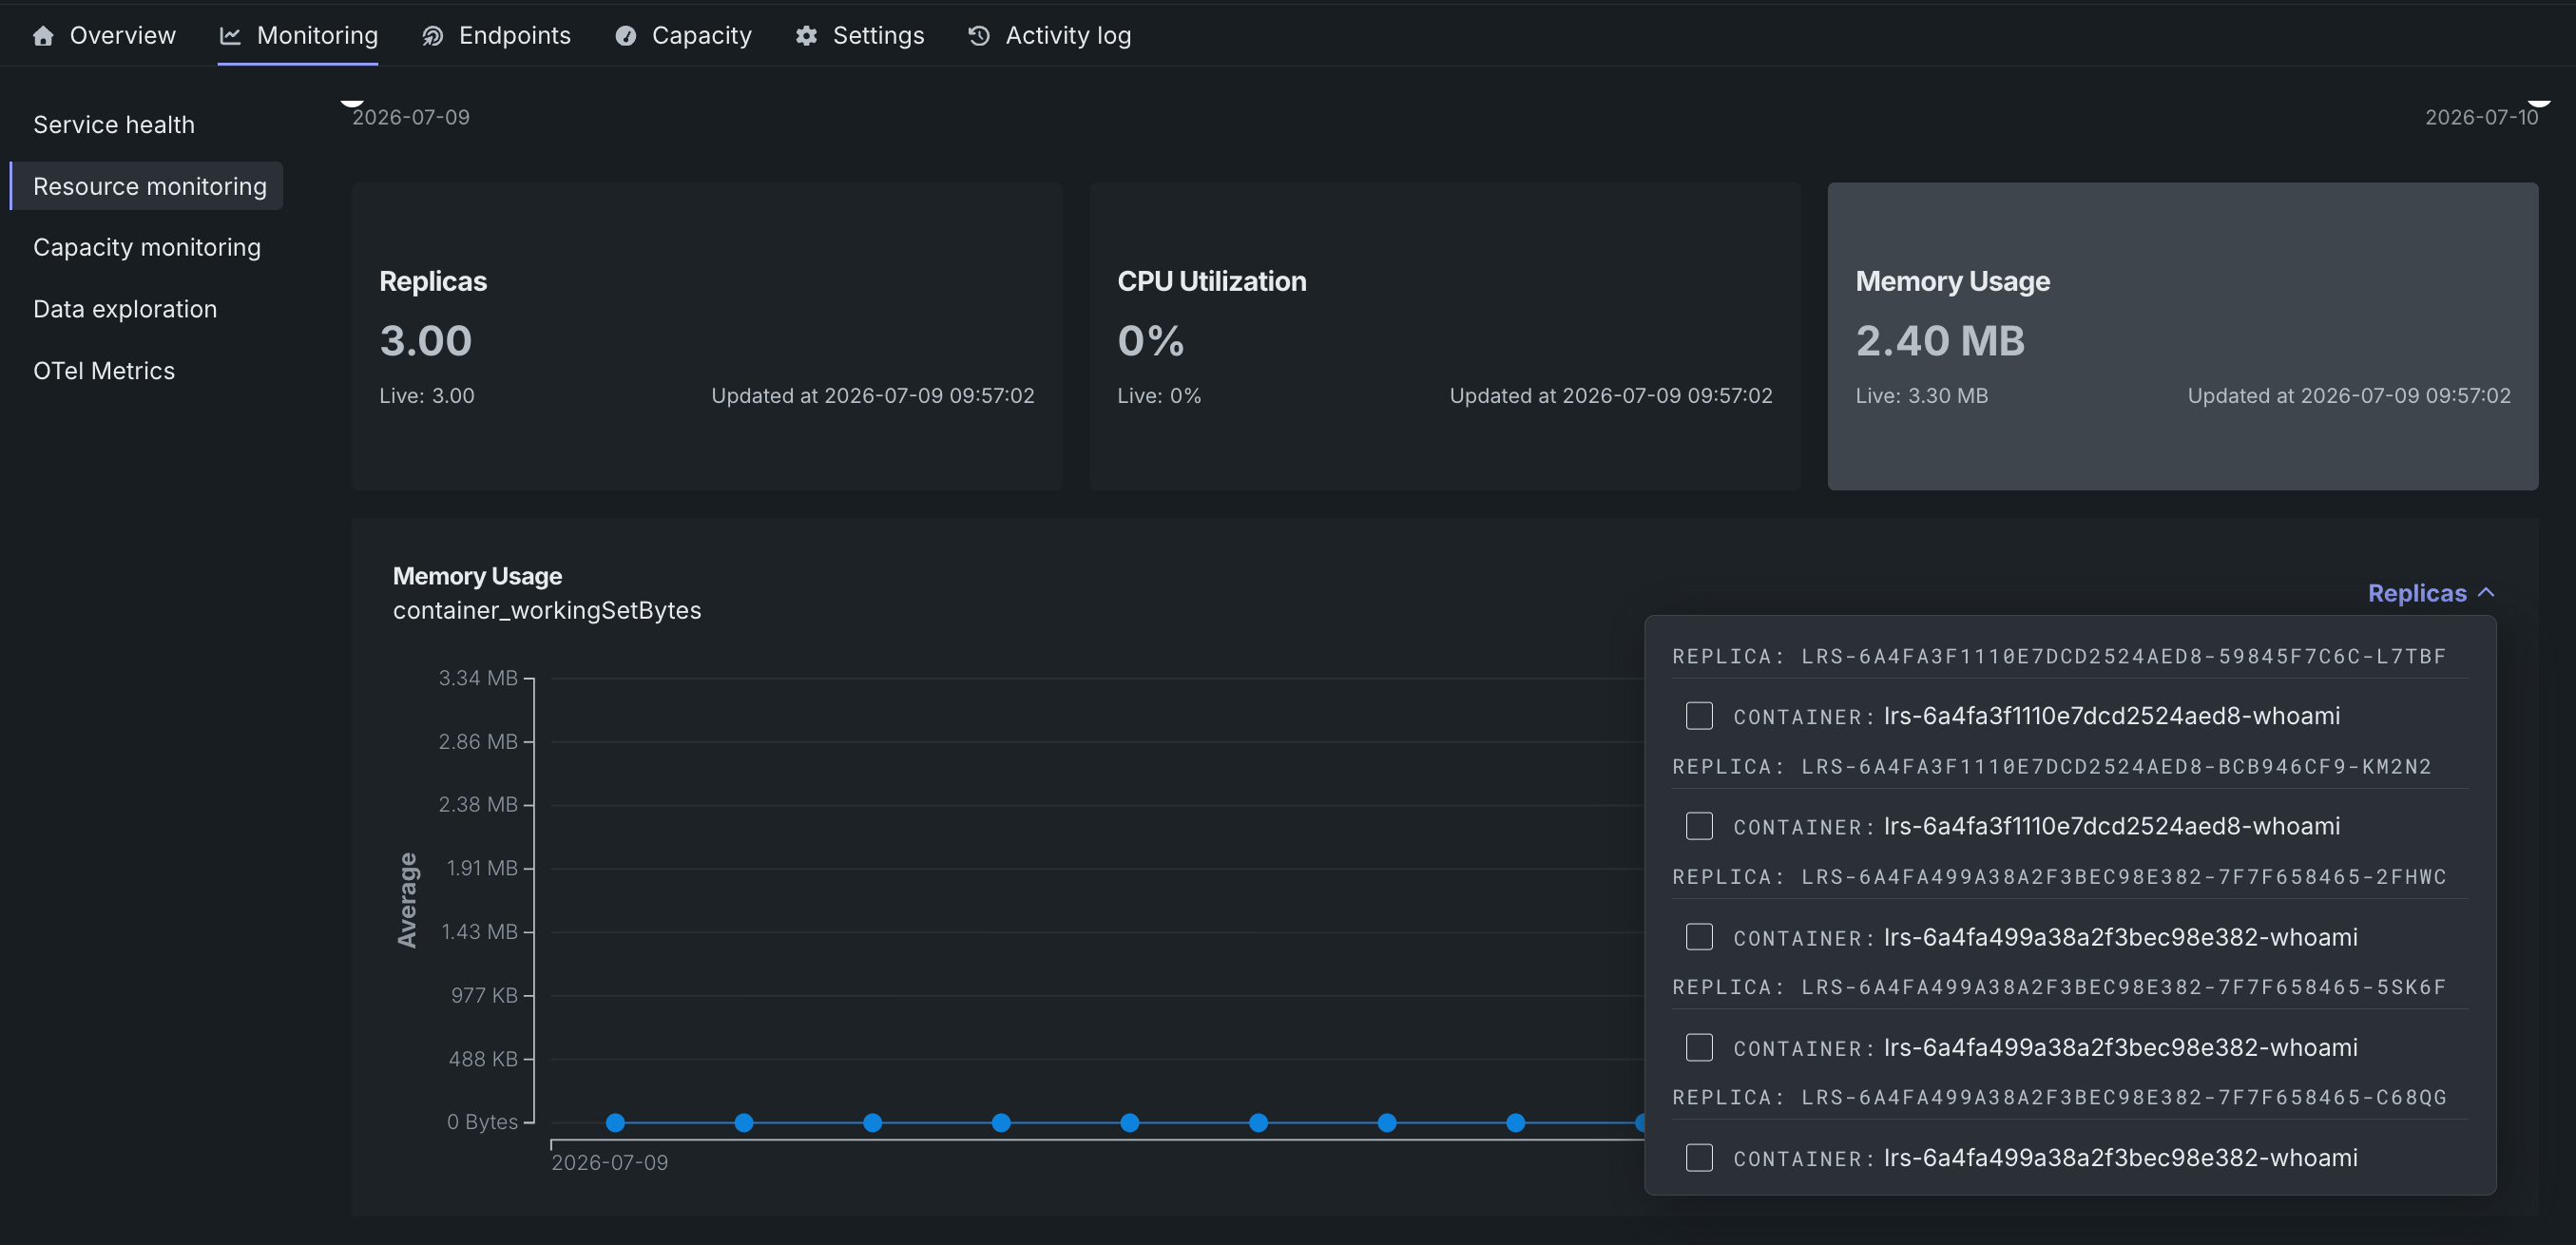
CPU使用率チャート、GPU使用率チャート、および メモリー使用量チャートでは、レプリカドロップダウンを使用して、1つまたは複数の特定のレプリカのリソース使用状況を表示するようにチャートを絞り込むことができます。