Monitor usage
The Usage report (self-managed only) and Usage Explorer provide administrators visibility into an organization's resource usage. Monitoring these resources over time can help indicate whether the organization has the correct number of resources to meet usage needs.
Usage report
Self-managed only
The Usage Report is only available for system admins on self-managed installations.
The Usage report provides system admins visibility into the organization's graphics processing unit (GPU) and central processing unit (CPU) usage across the platform.
The following services are tracked in the Usage Report:
- Modeling
- Inference
- NVIDIA AI Enterprise
- Vector Database Creation
- GenAI Playground
- Custom Models
- Moderations
- Data Management
- Predictions
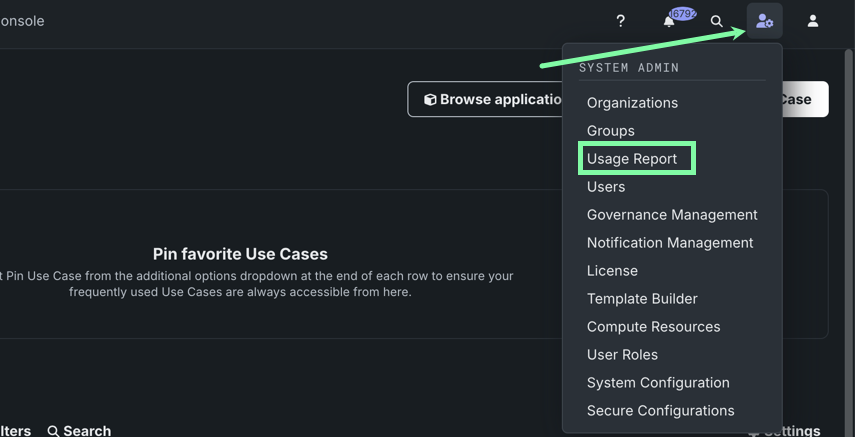
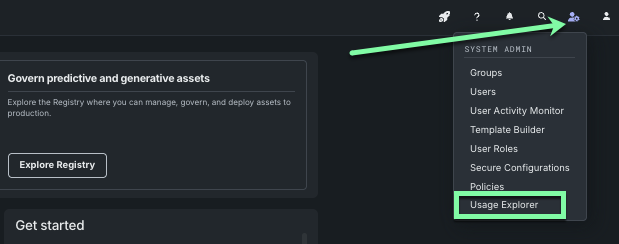
To access the Usage Report, open Admin settings > Usage Report.
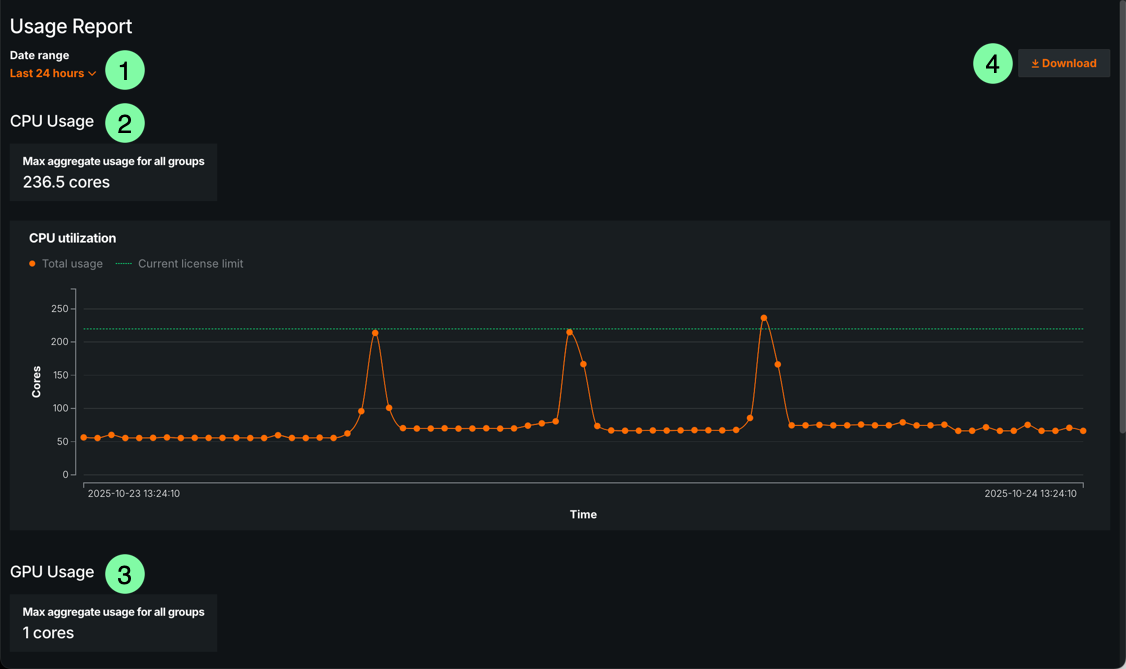
From here, you can view resource consumption for a given date range, as well as export the report as a .csv file.
| Element | Description | |
|---|---|---|
| 1 | Date range selector | Use the dropdown to display usage information for a specific time period. |
| 2 | CPU Usage | View CPU Usage information, including max aggregate usage for all groups and a usage over time chart. |
| 3 | GPU Usage | View GPU Usage information, including max aggregate usage for all groups and a usage over time chart. |
| 4 | Download | Download the report as a .csv file. |
CPU usage
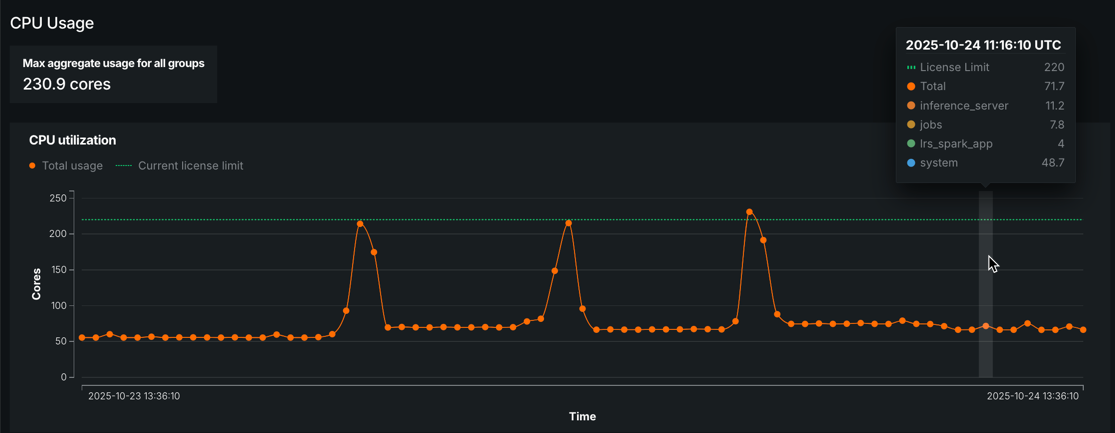
The CPU Usage section provides an overview of central processing unit (CPU) usage within the organization. This allows for easy monitoring of core usage, potentially helping to identify areas for optimization or budgetary concerns.
| Element | Description |
|---|---|
| Max aggregate usage for all groups | Total core usage for all users across the platform. |
| CPU utilization chart | A chart that displays total usage amount over the specified time period, as well as your organization's current license limit for core usage. Hover to over a point on the chart to view additional information. |
GPU usage
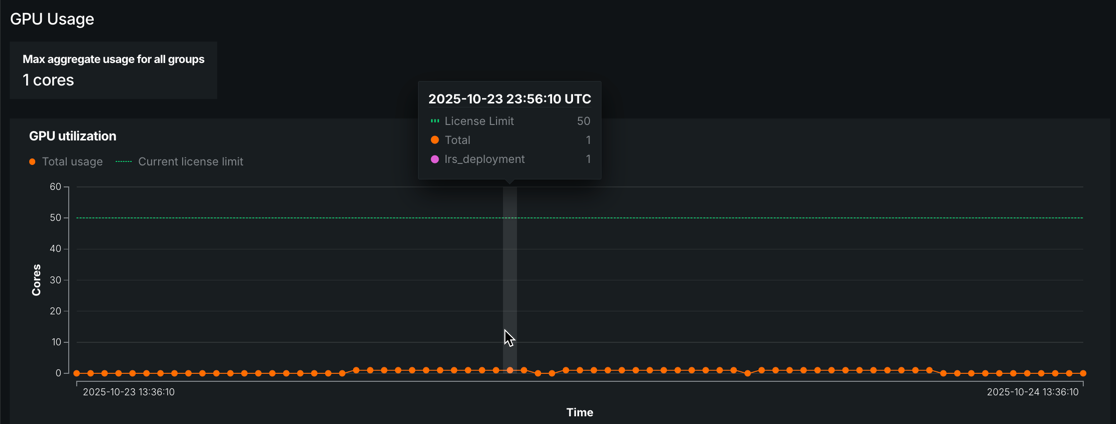
The GPU Usage section reports data on GPU usage, providing general usage information. GenAI features, for example, rely on GPU hardware for a range of workloads related to training, hosting, and running inference on LLMs.
| Element | Description |
|---|---|
| Max aggregate usage for all groups | Total core usage for all users across the platform. |
| GPU utilization chart | A chart that displays total usage amount over the specified time period, as well as your organization's current license limit for core usage. Hover over a point on the chart to view additional information. |
Tenant Usage Explorer
The Tenant Usage Explorer provides admins visibility into and organization's graphics processing unit (GPU), central processing unit (CPU), and large language model (LLM) API usage across the platform. Monitoring these resources over time can help indicate whether the organization has the correct number of resources to meet usage needs. For more information, see Usage Explorer in the documentation for Account Settings.
Note
The services displayed in the Tenant Usage Explorer may vary depending on the type of usage being viewed.
To access the Tenant Usage Explorer, open Admin settings > Tenant Usage Explorer.
From here, you can view resource consumption by user or service for a given date range, as well as export the report as a .csv file.
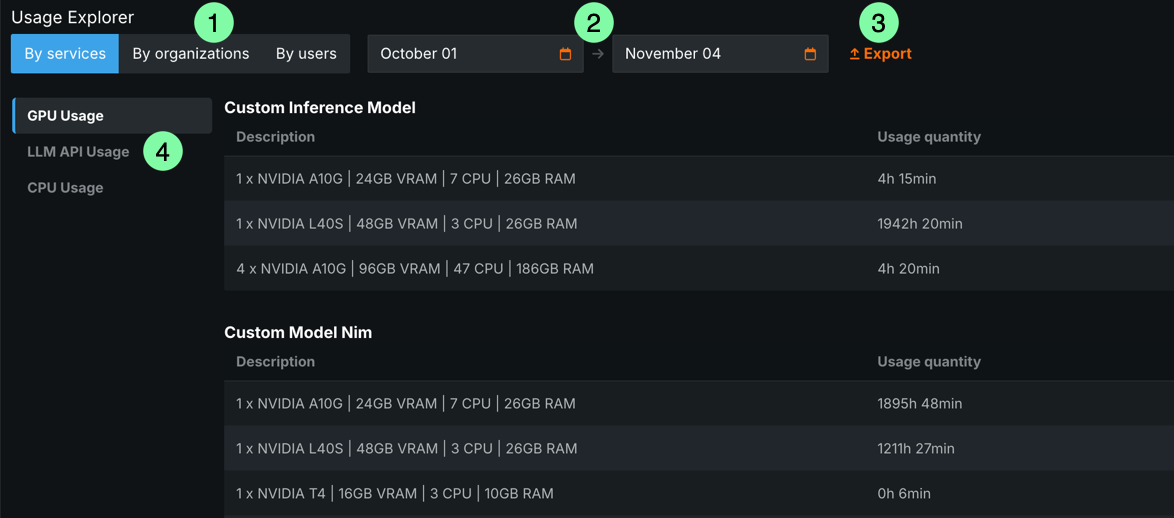
| Element | Description | |
|---|---|---|
| 1 | By services/By organizations/By users | View usage broken down by specific services, organizations (self-managed only), or users. |
| 2 | Date range selector | Use the two fields to display usage information for a specific date range. |
| 3 | Export | Download the report as a .csv file. |
| 4 | Usage options | Select the usage information to view—GPU, LLM, or CPU. |
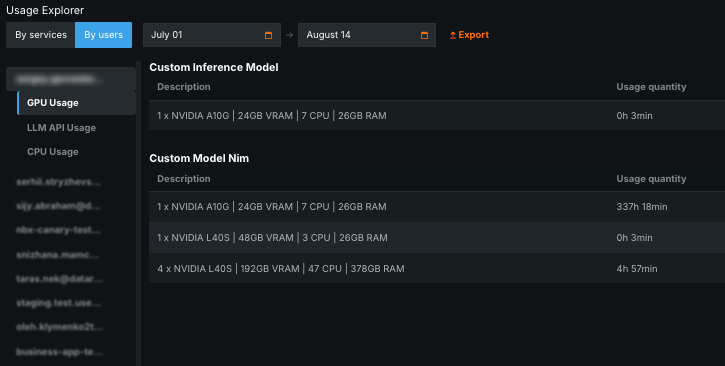
Toggling the page to display By users allows you to view usage details for individual user accounts within the organization.
Toggling the page to display By organizations allows you to view usage details for individual organizations within the cluster.
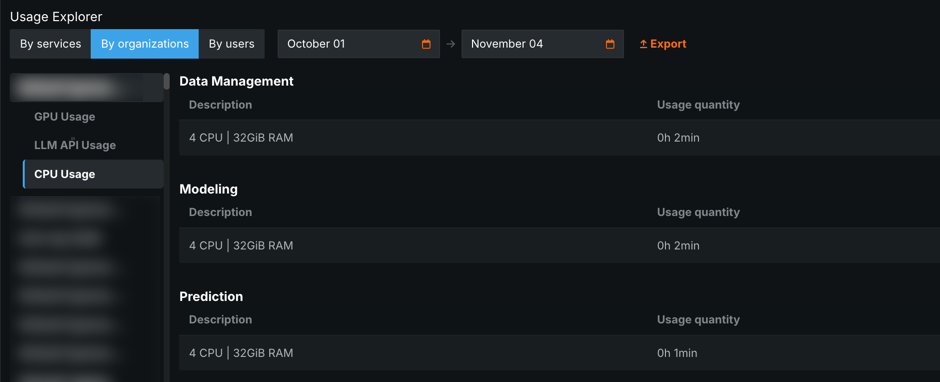
Self-managed-only
The By organizations tab is only available for system admins on self-managed installations.