Data exploration
On a deployment's Monitoring > Data exploration tab, you can interact with a deployment's stored data to gain insight into model or agent performance. You can also download deployment data to use in custom metric calculations. The Data exploration summary includes the following functionality, depending on the deployment type:
| Functionality | Description |
|---|---|
| Data export | For all deployments, download a deployment's stored data including training data, prediction data, actuals, and custom metric data. |
| Tracing | For custom and external model deployments, explore traces from a model or workflow. Each trace contains a visual timeline representing all actions carried out by the model or agent and revealing the order and duration of these actions. |
| Data quality | For generative AI and agentic workflow deployments, assess the quality of a generative AI model's responses based on user feedback and custom metrics. |
Data requirements
To use the Data exploration tab, the deployment must store prediction data. Ensure that you enable prediction row storage in the data exploration (or challenger) settings. The Data exploration tab doesn't store or export Prediction Explanations, even if they are requested with the predictions.
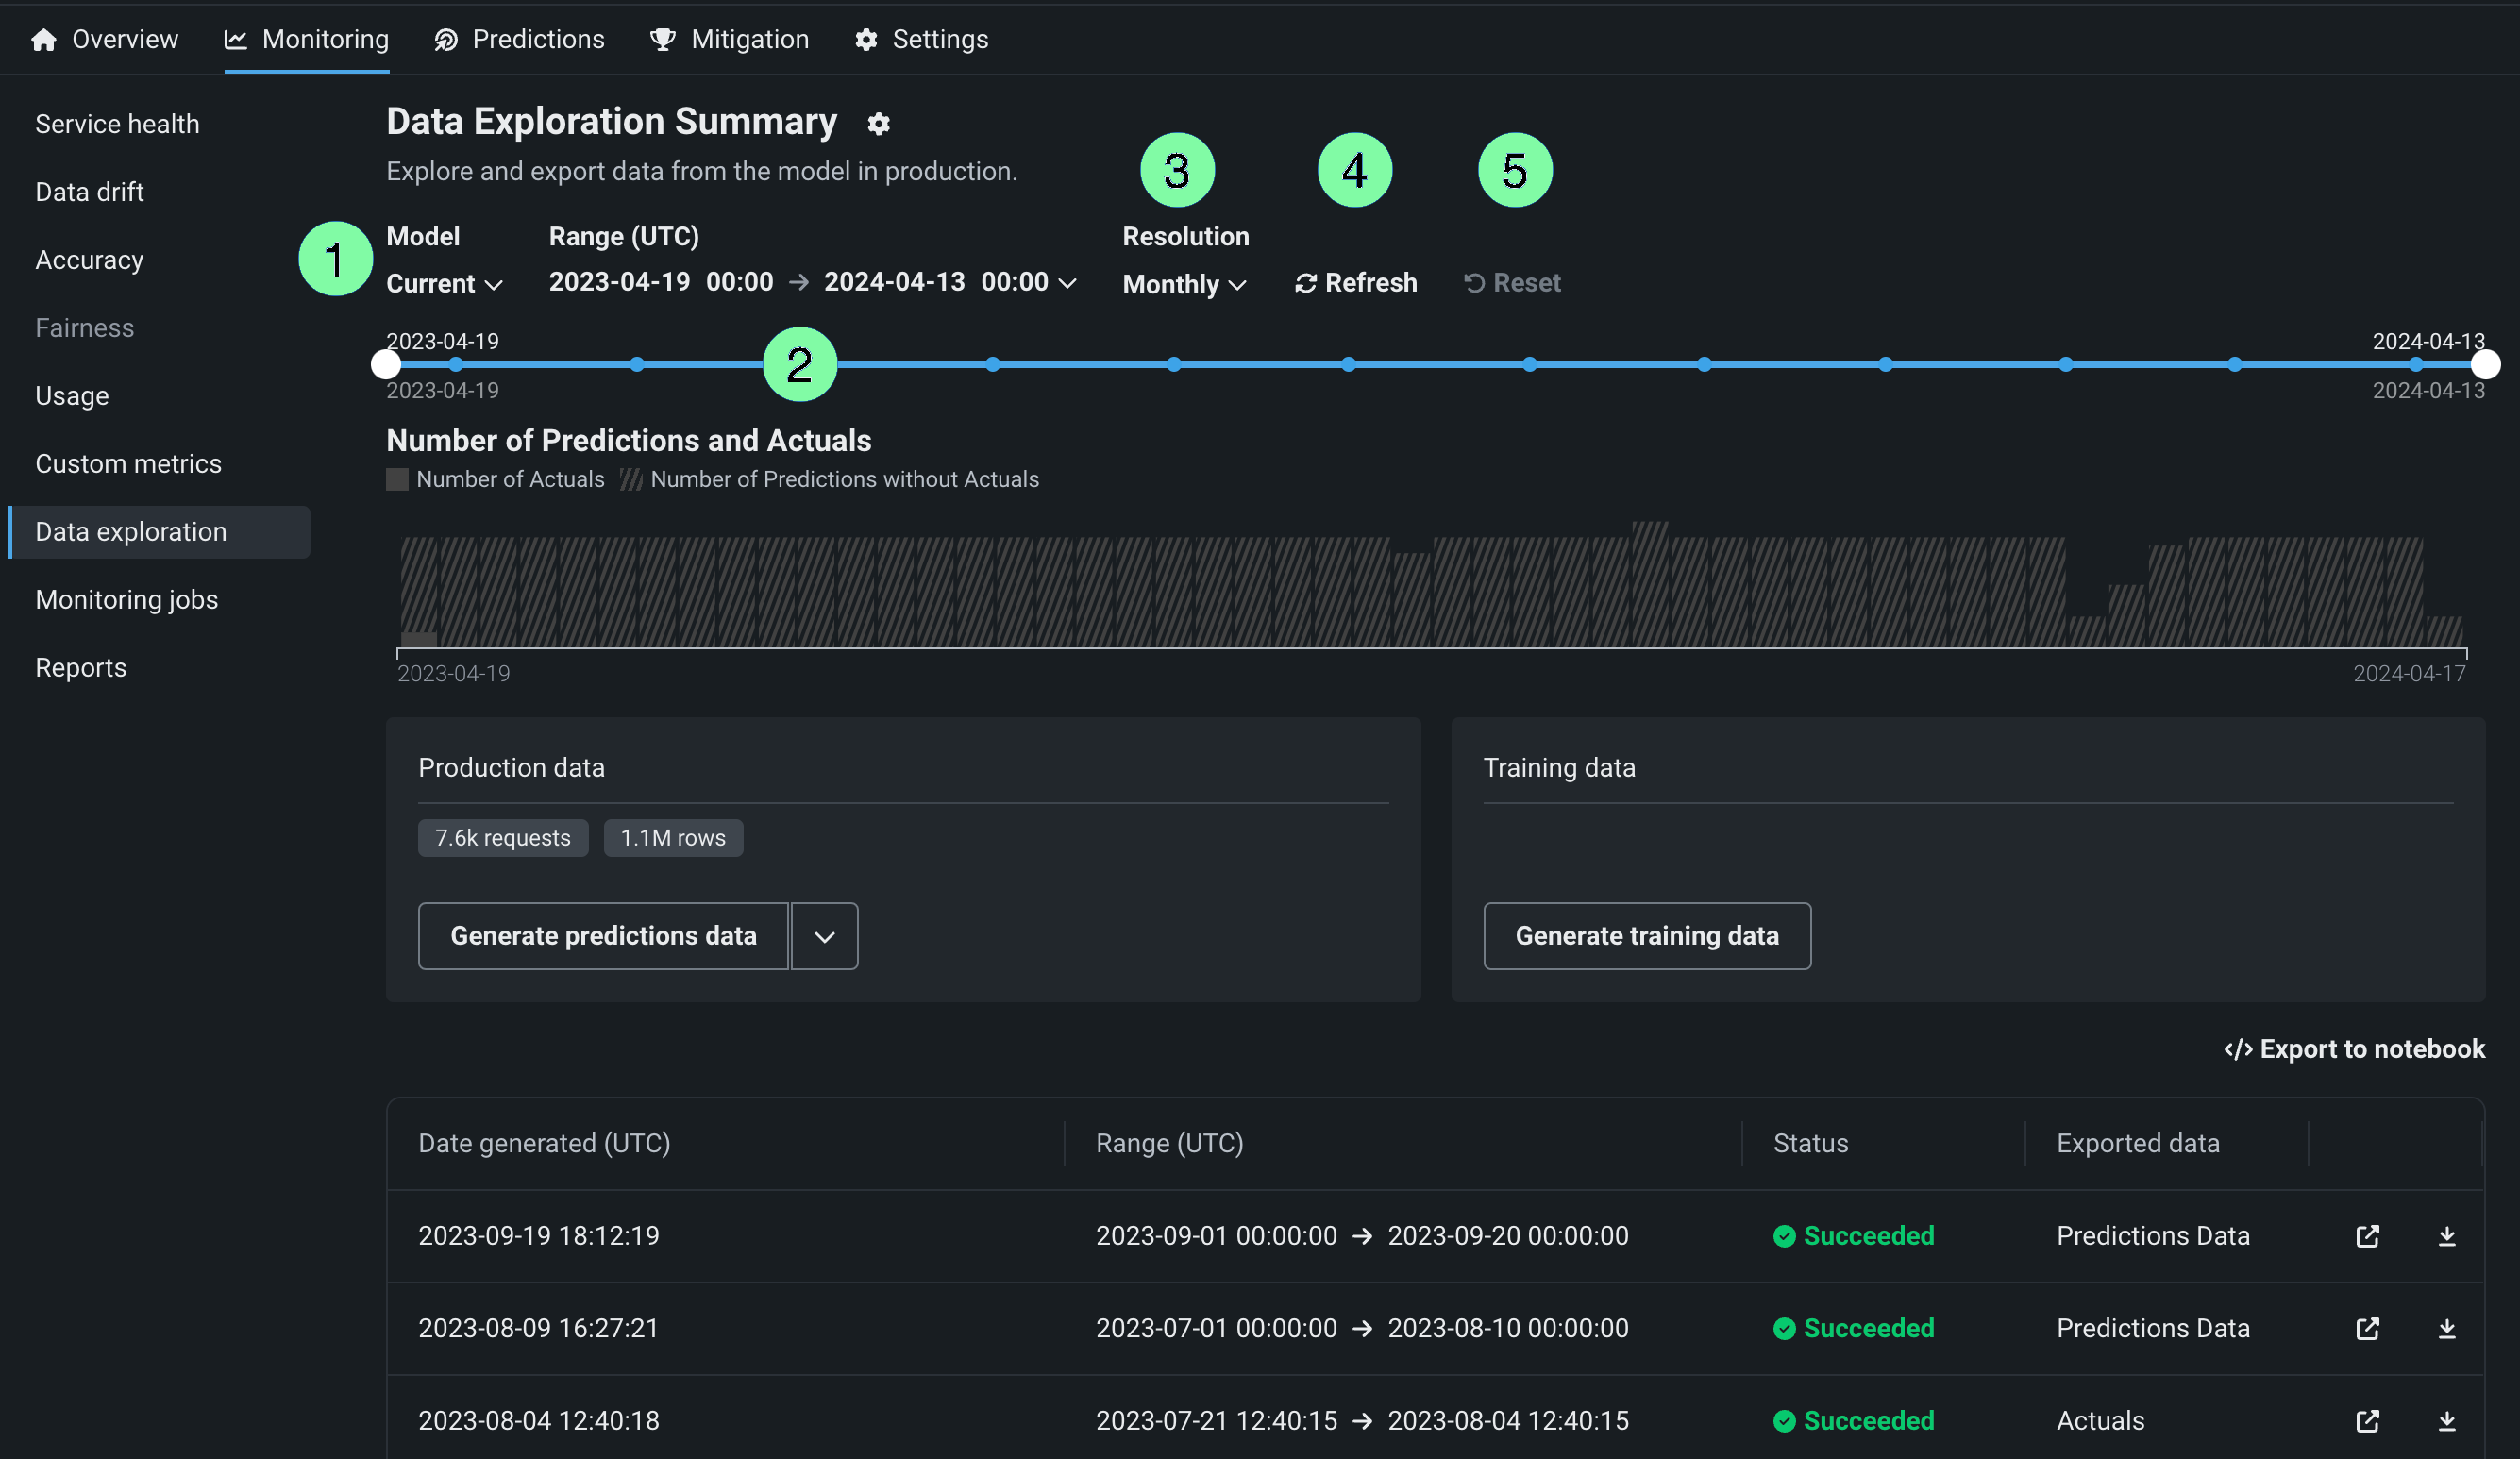
Configure data exploration range
In the deployment from which you want to export stored training data, prediction data, or actuals, click the Monitoring > Data exploration tab and configure the following settings to specify the stored training data, prediction data, or actuals you want to export:
| Setting | Description | |
|---|---|---|
| 1 | Model | Select the deployment's model, current or previous, to export prediction data for. |
| 2 | Range (UTC) | Select the start and end dates of the period you want to export prediction data from. |
| 3 | Resolution | Select the granularity of the date slider. Select from hourly, daily, weekly, and monthly granularity based on the time range selected. If the time range is longer than 7 days, hourly granularity is not available. |
| 4 | Refresh | Refresh the data exploration tab's data. |
| 5 | Reset | Reset the data exploration settings to the default. |
Export deployment data
On the Data exploration summary page (or the Data export tab of the Data exploration summary), you can download a deployment's stored data. This can include training data, prediction data, actuals, and custom metric data. Use the exported data to compute and monitor custom business or performance metrics on the Custom metrics tab or outside of DataRobot. To export deployment data for custom metrics, verify that the deployment stores prediction data, generate data for a specified time range, and then view or download that data.
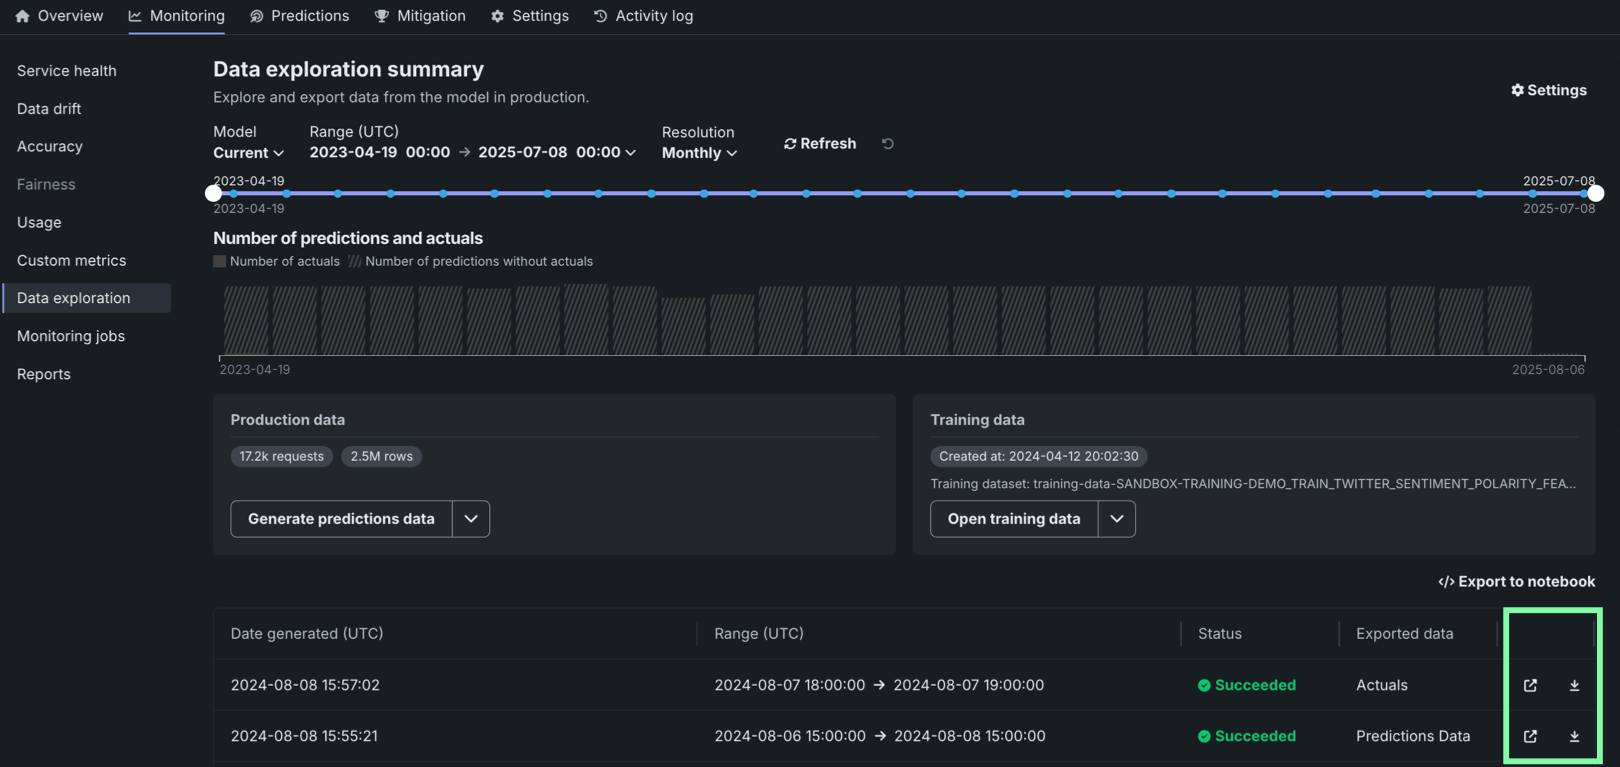
Export a deployment's production data
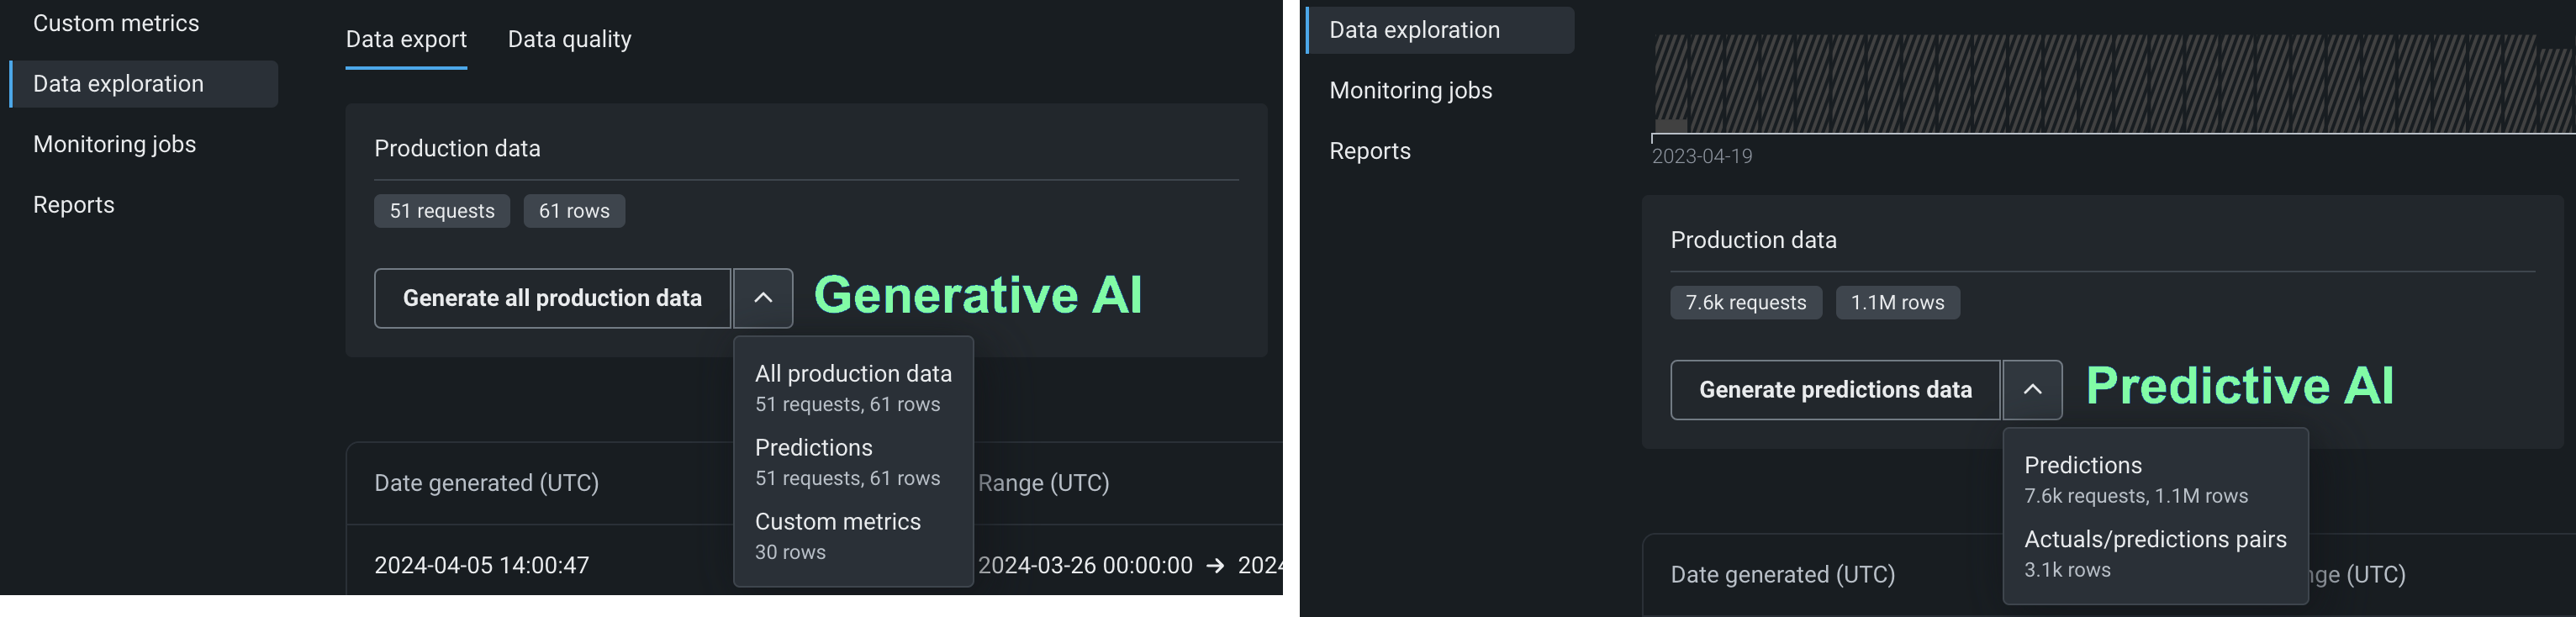
To access deployment data export for prediction data, actuals, or custom metric data, on the Data exploration summary page, locate the Production data panel. On the Production data panel, in the Generate button, click the down arrow and select one of the data generation options. The availability of the following options depends on the data stored in the deployment for the model and time range selected:
| Option | Description |
|---|---|
| All production data | For generative AI deployments, generate all available production data (predictions, actuals, custom metrics) for the specified model and time range. |
| Predictions | Generate prediction data for the specified model and time range. |
| Actuals/predictions pairs | Generate actuals paired up with the related predictions for the specified model and time range. |
| Custom metrics | For generative AI deployments, generate available custom metric data for the specified model and time range. |
Premium
Custom metric data export is off by default. Contact your DataRobot representative or administrator for information on enabling this feature.
Production data appears in the table below the panels. You can identify the data type in the Exported data column.
Prediction data and actuals considerations
When generating prediction data or actuals, consider the following:
-
When generating prediction data, you can export up to 200,000 rows per export. If the time range you set exceeds 200,000 rows of prediction data, decrease the range.
-
In the Data Registry, you can have up to 100 prediction export items. If generating prediction data for export would cause the number of prediction export items in the Data Registry to exceed that limit, delete old prediction export Data Registry items.
-
When generating prediction data for time series deployments, two prediction export items are added to the Data Registry. One item is for the prediction data, and the other is for the prediction results. The Data exploration tab links to the prediction results.
-
When generating actuals, you can export up to 1,000,000 rows per export. If the time range you set exceeds 1,000,000 rows of actuals, decrease the time range.
-
In the Data Registry, you can have up to 100 actuals export items. If generating actuals data for export would cause the number of actuals export items in the Data Registry to exceed that limit, delete old actuals export Data Registry items.
-
Up to 10,000,000 actuals are stored for a deployment; therefore, exporting old actuals can result in an error if no actuals are currently stored for that time period.
Export a deployment's training data
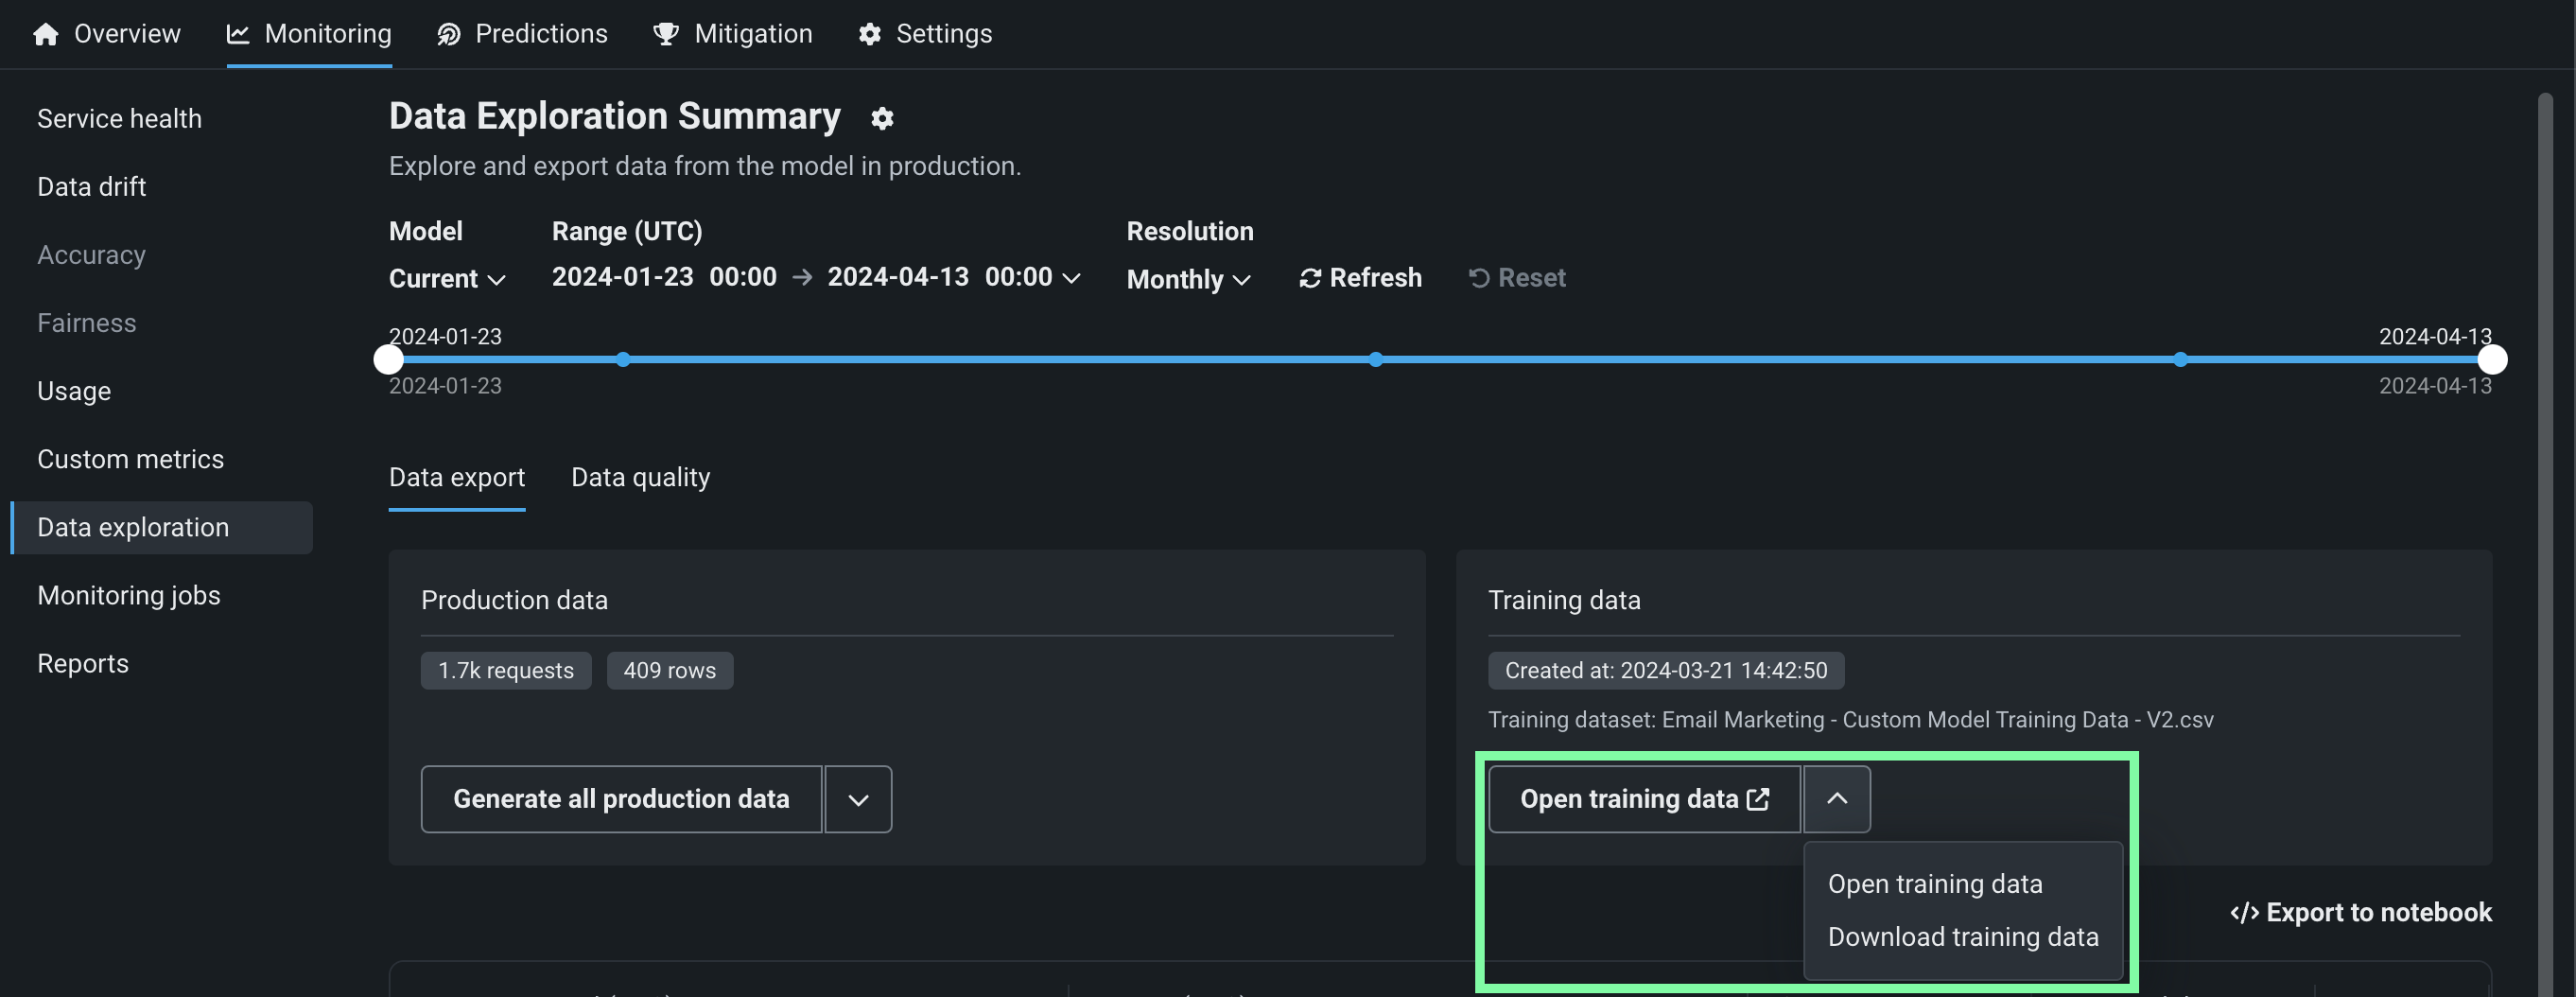
To access deployment data export for training data, on the Data exploration summary page, locate the Training data panel and click Generate training data to generate data for the specified model and time range:
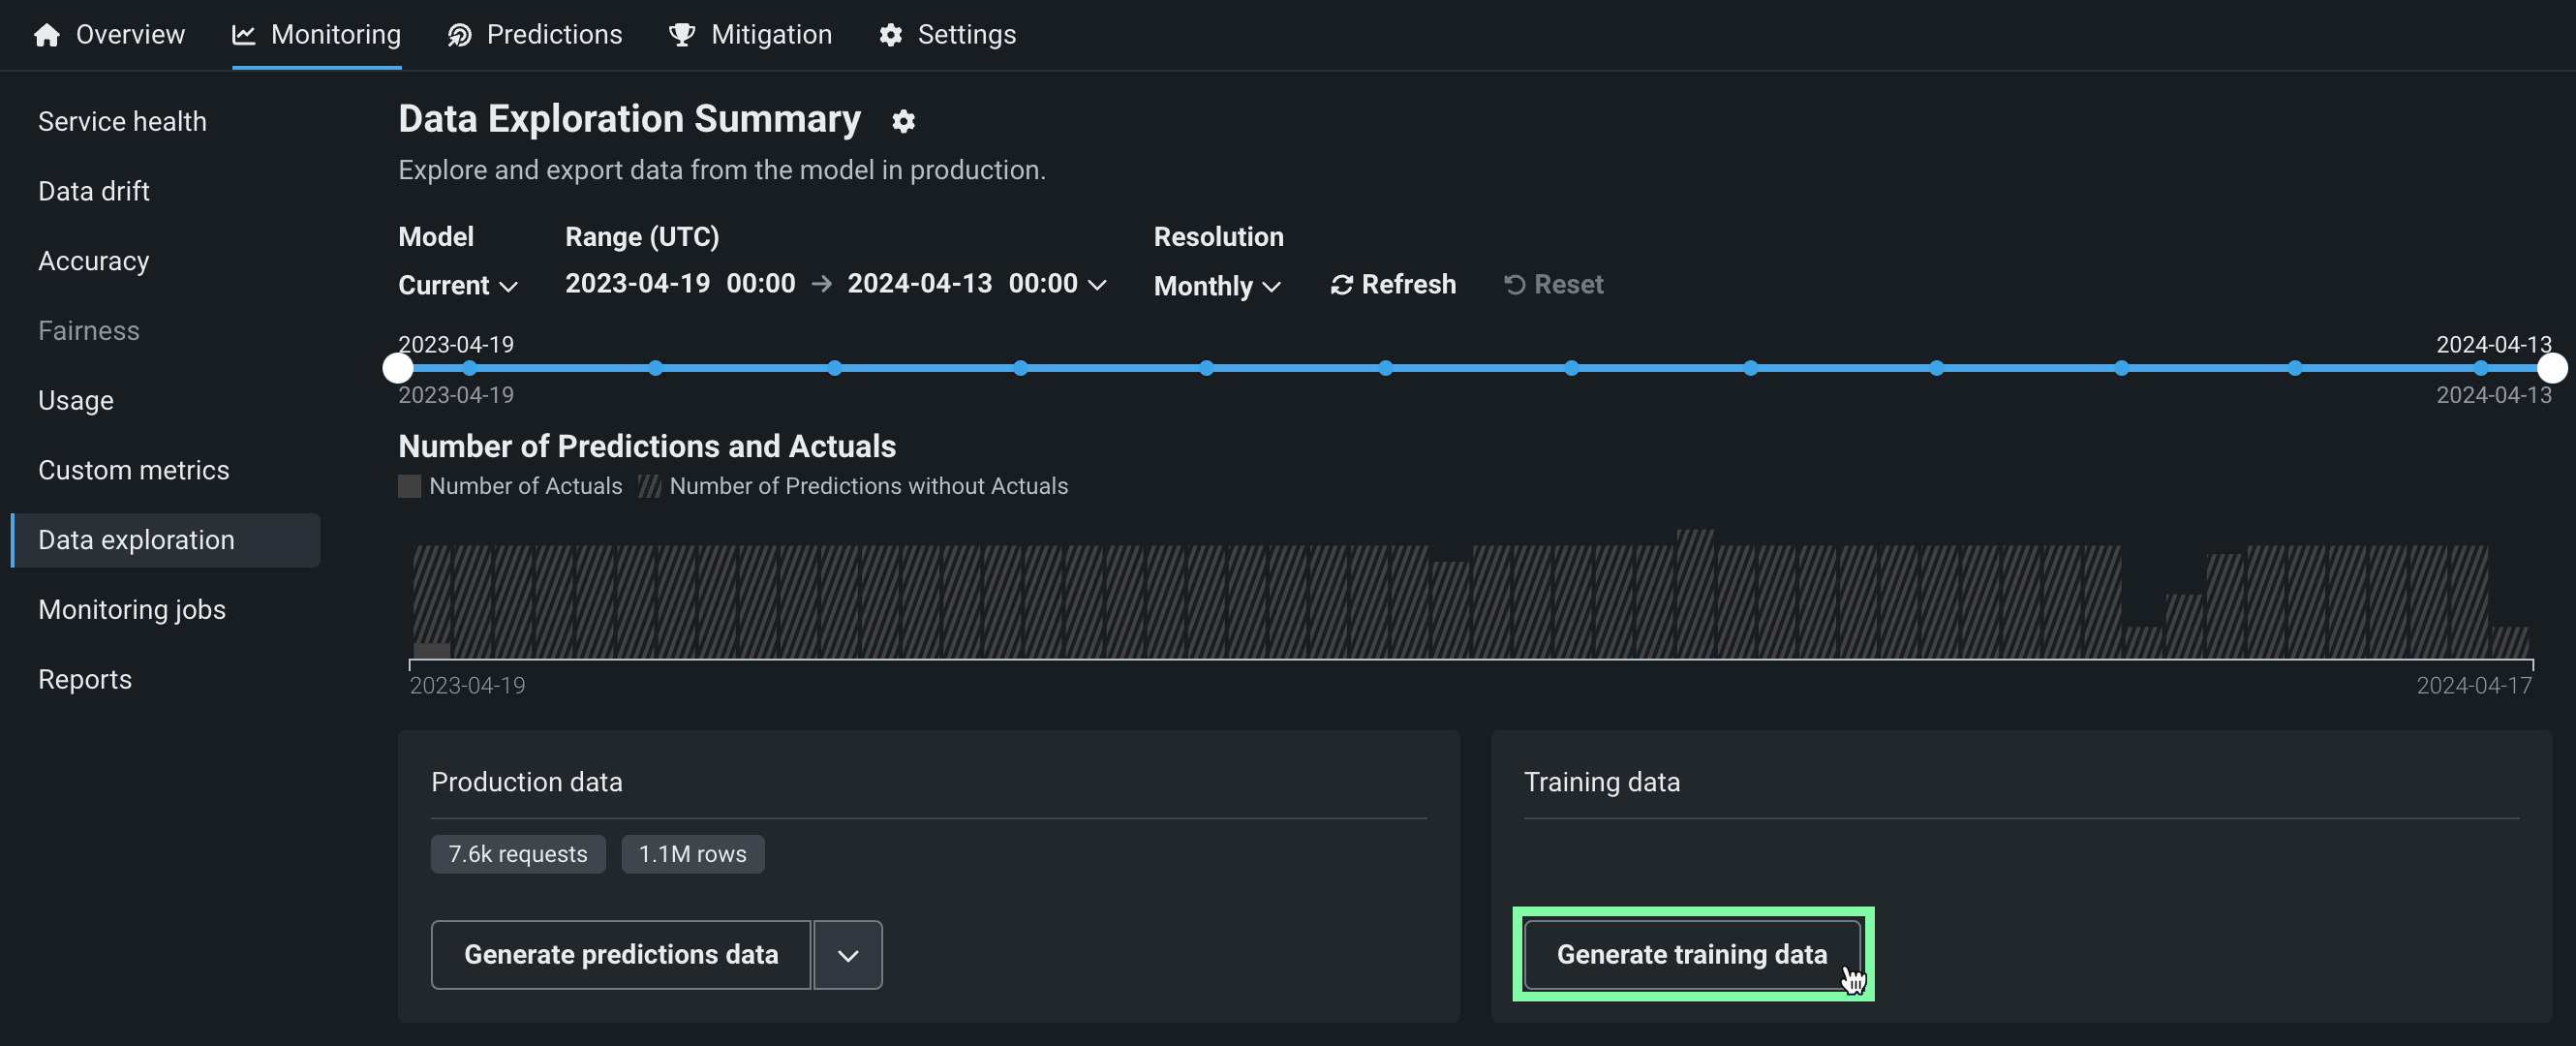
Options for interacting with the training data appear in the Training data panel. Click the down arrow to choose between Open training data and Download training data :
Review and download data
After the production or training data are generated, you can view or download the data. Production data appears in the table below the panels, where you can identify the data type in the Exported data column. Training data appears in the Training data panel.
| Option | Description |
|---|---|
| Open the exported data in the Data Registry. | |
| Download the exported data. |
Export to notebook
You can also click Export to notebook to open a DataRobot notebook with cells for exporting training data, prediction data, and actuals.
Use exported deployment data for custom metrics
To use the exported deployment data to create your own custom metrics, you can implement a script to read from the CSV file containing the exported data and then calculate metrics using the resulting values, including columns automatically generated during the export process.
This example uses the exported prediction data to calculate and plot the change in the time_in_hospital feature over a 30-day period using the DataRobot prediction timestamp (DR_RESERVED_PREDICTION_TIMESTAMP) as the DateFrame index (or row labels). It also uses the exported training data as the plot's baseline:
import pandas as pd
feature_name = "<numeric_feature_name>"
training_df = pd.read_csv("<path_to_training_data_csv>")
baseline = training_df[feature_name].mean()
prediction_df = pd.read_csv("<path_to_prediction_data_csv>")
prediction_df["DR_RESERVED_PREDICTION_TIMESTAMP"] = pd.to_datetime(
    prediction_df["DR_RESERVED_PREDICTION_TIMESTAMP"]
)
predictions = prediction_df.set_index("DR_RESERVED_PREDICTION_TIMESTAMP")["time_in_hospital"]
ax = predictions.rolling('30D').mean().plot()
ax.axhline(y=baseline - 2, color="C1", label="training data baseline")
ax.legend()
ax.figure.savefig("feature_over_time.png")
DataRobot column reference
DataRobot automatically adds the following columns to the prediction data generated for export:
| Column | Description |
|---|---|
DR_RESERVED_PREDICTION_TIMESTAMP |
Contains the prediction timestamp. |
DR_RESERVED_PREDICTION |
Identifies regression prediction values. |
DR_RESERVED_PREDICTION_<Label> |
Identifies classification prediction values. |
Explore deployment data tracing
Premium
Tracing is a premium feature. Contact your DataRobot representative or administrator for information on enabling this feature.
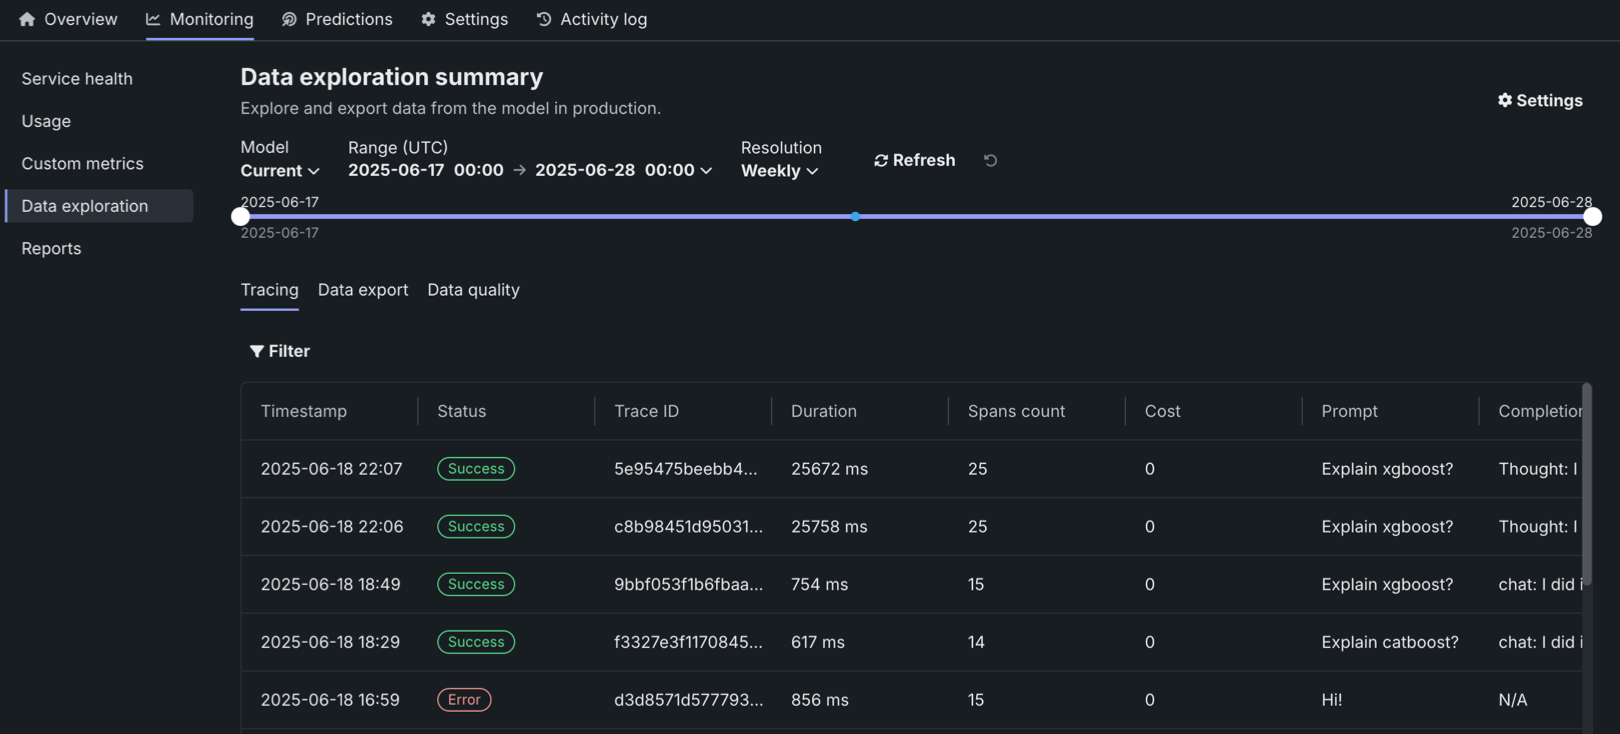
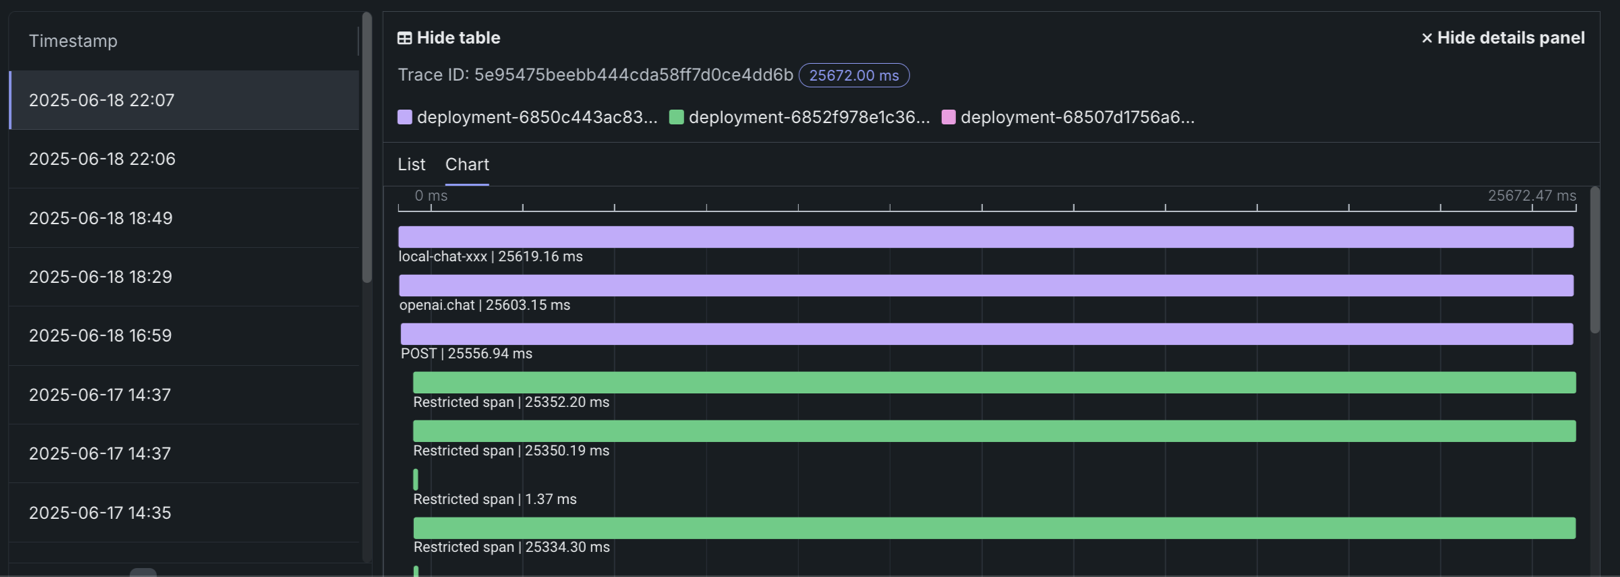
On the Data exploration tab of a custom or external model deployment, click Tracing to explore traces from the model or agentic workflow. Each trace—identified by a timestamp and a trace ID—contains a visual timeline that represents actions carried out by the model or agent, and revealing the order and duration of these actions.
Traces represent the path taken by a request to a model or agentic workflow. DataRobot uses the OpenTelemetry framework for tracing. A trace follows the entire end-to-end path of a request, from origin to resolution. Each trace contains one or more spans, starting with the root span. The root span represents the entire path of the request and contains a child span for each individual step in the process. The root (or parent) span and each child span share the same Trace ID.
In the Tracing table, you can review the following fields related to each trace:
| Column | Description |
|---|---|
| Timestamp | The date and time of the trace in YYYY-MM-DD HH:MM format. |
| Status | The overall status of the trace, including all spans. The Status will be Error if any dependent task fails. |
| Trace ID | A unique identifier for the trace. |
| Duration | The amount of time, in milliseconds, it took for the trace to complete. This value is equal to the duration of the root span (rounded) and includes all actions represented by child spans. |
| Spans count | The number of completed spans (actions) included in the trace. |
| Cost | If cost data is provided, the total cost of the trace. |
| Prompt | The user prompt related to the trace. |
| Completion | The agent or model response (completion) associated with the prompt for the trace. |
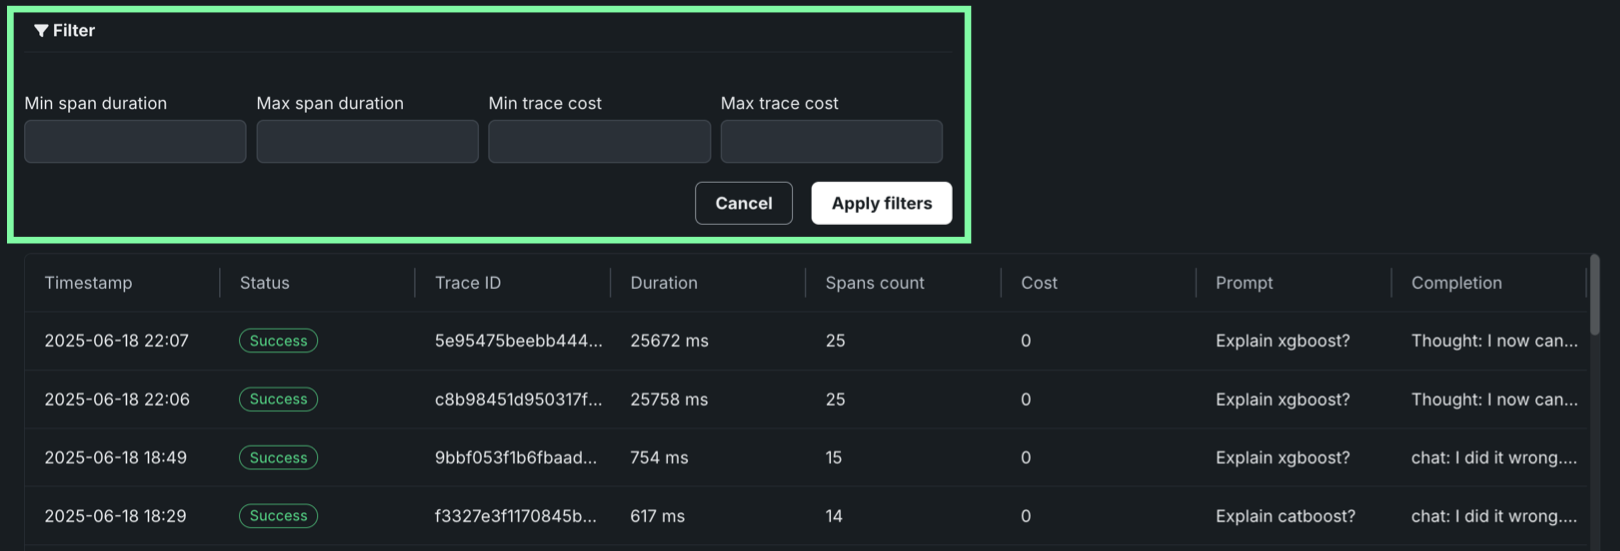
Click Filter to filter by Min span duration, Max span duration, Min trace cost, and Max trace cost. The unit for span filters is nanoseconds (ns), the chart displays spans in milliseconds (ms).
Filter accessibility
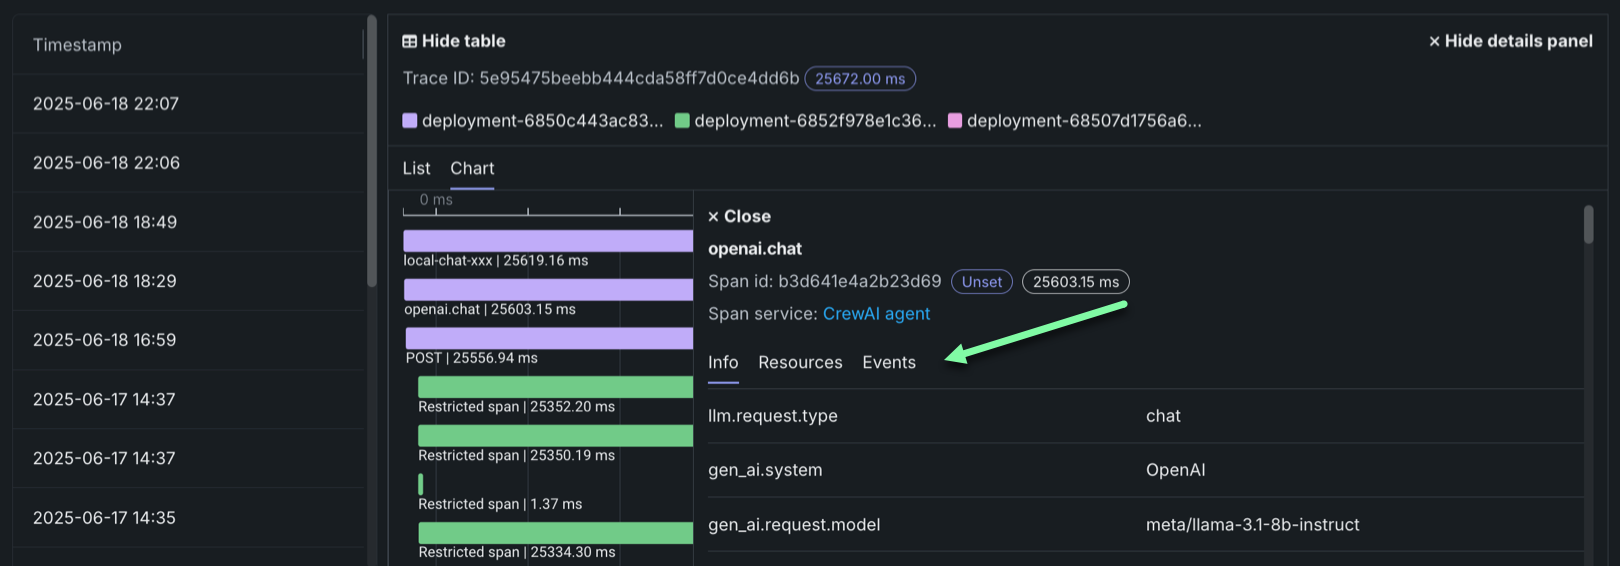
The Filter button is hidden when a span is expanded to detail view. To return to the chart view with the filter, click Hide details panel.
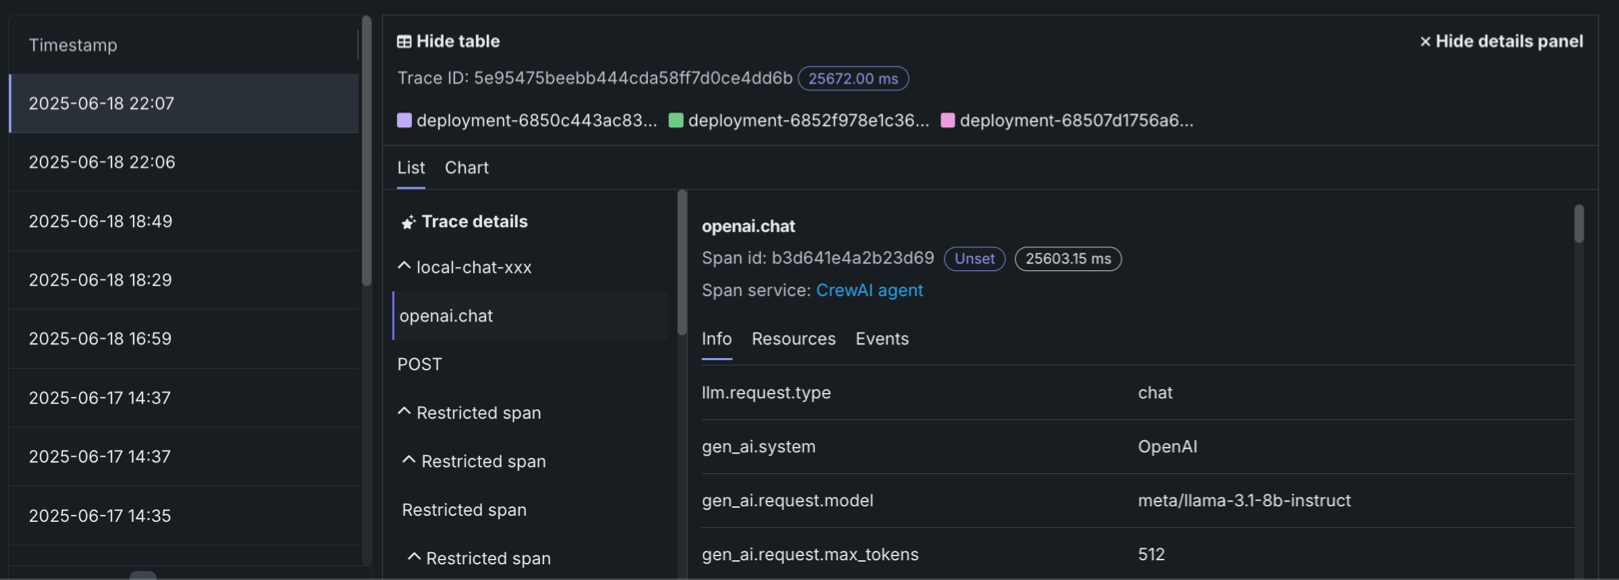
To review the spans contained in a trace, along with trace details, click a trace row in the Tracing table. The span colors correspond to a Span service, usually a deployment. Restricted span appears when you don’t have access to the deployment or service associated with the span. You can view spans in Chart format or List format.
Span detail controls
From either view, you can click Hide table to collapse the Timestamps table or Hide details panel to return to the expanded Tracing table view.
Trace details
In list view, you can click Trace details to view the Input/Output (Prompt and Completion) and Evaluation details about the trace associated with the current span.
For either view, click the Span service name to access the deployment or resource (if you have access). Additional information, dependent on the configuration of the generative AI model or agentic workflow, is available on the Info, Resources, Events, and Errors tabs. The Errors tab only appears when an error occurs in a trace.
Explore deployment data quality
Premium
Data quality is a premium feature. Contact your DataRobot representative or administrator for information on enabling this feature.
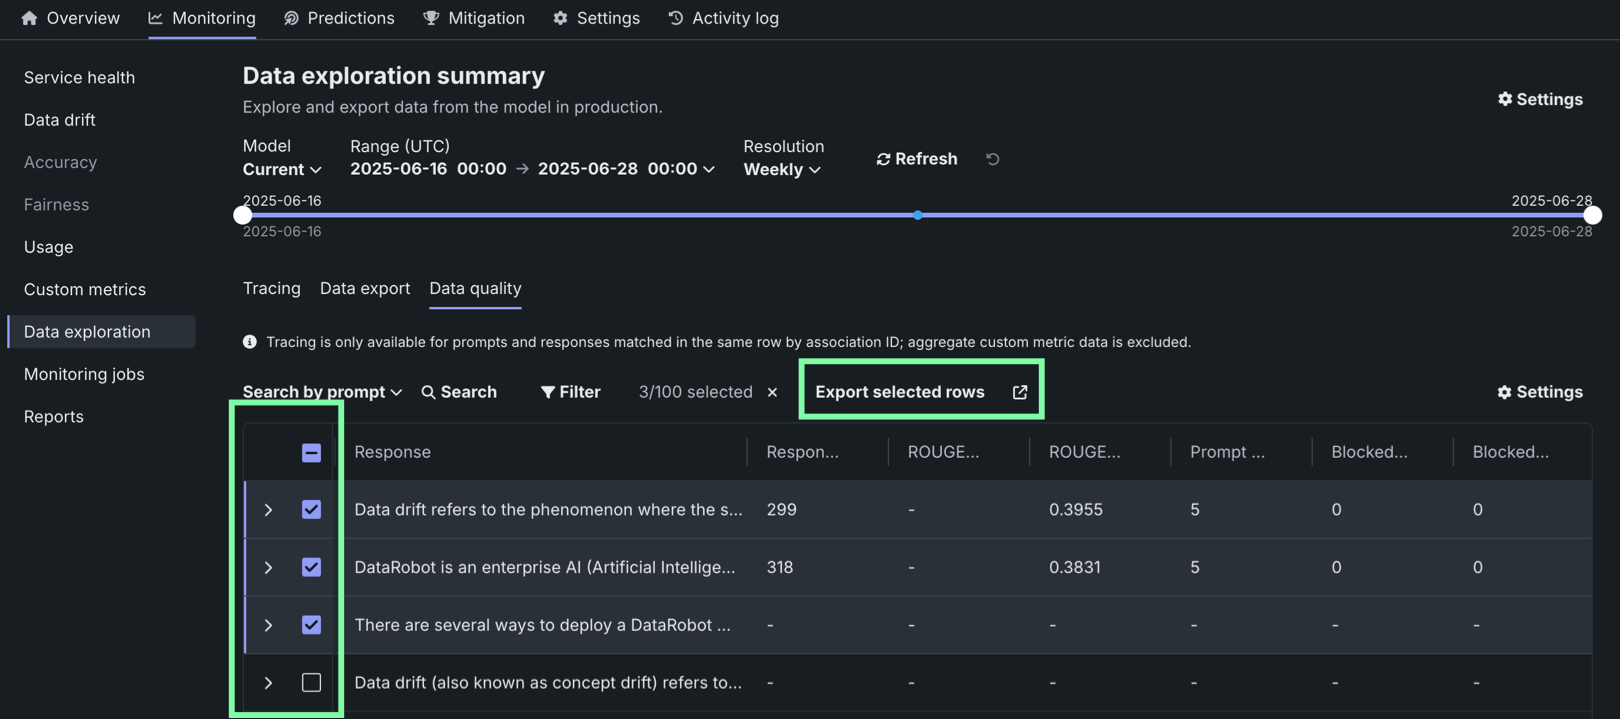
On the Data exploration tab of a generative AI deployment, click Data quality to explore prompts and responses alongside user ratings and custom metrics, if implemented, providing insight into the quality of the generative AI model. Prompts, responses, and any available metrics are matched by association ID:
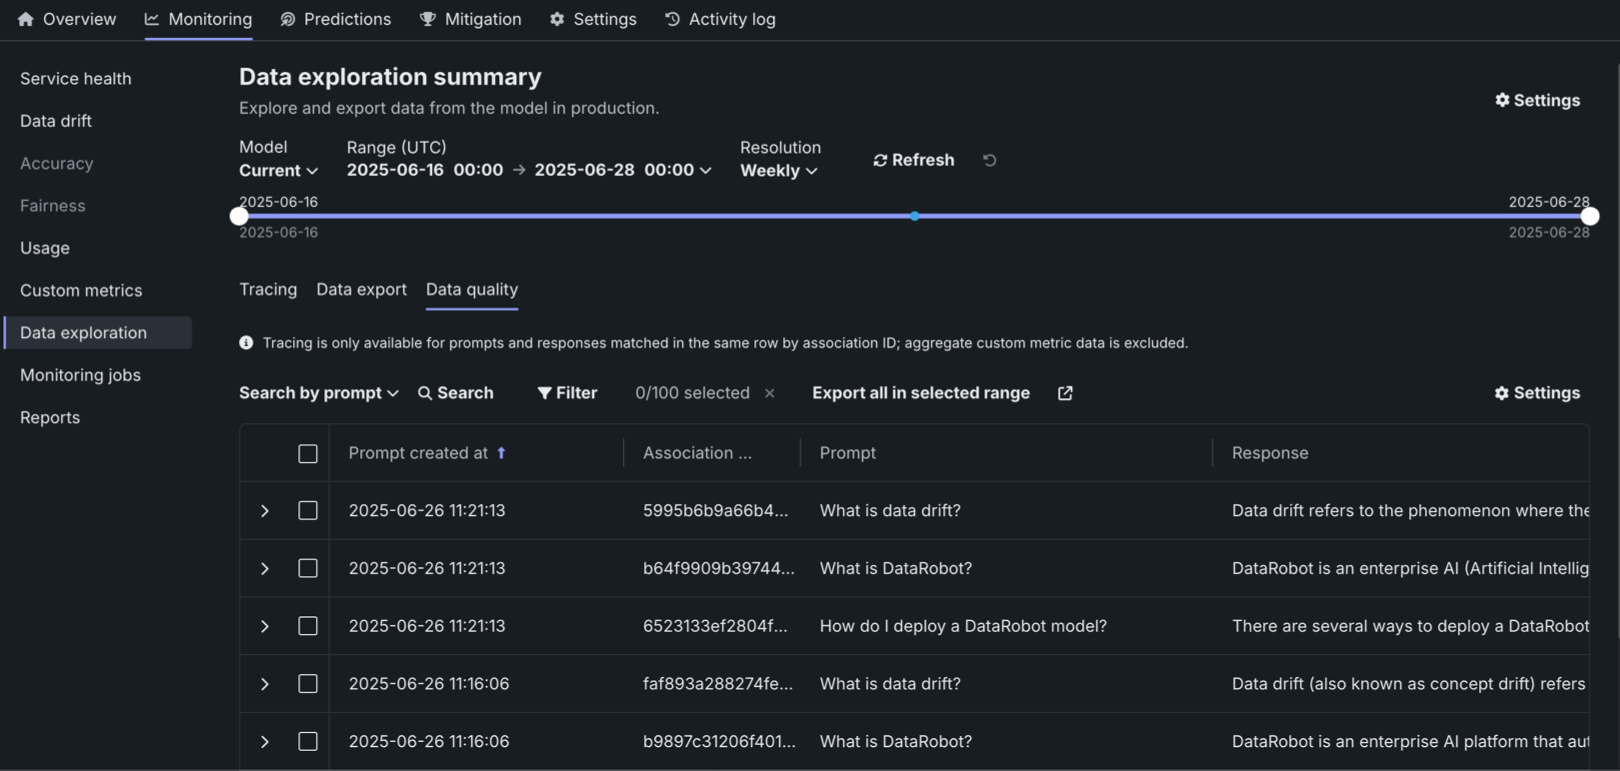
To configure the rows displayed in the data quality table, click Settings to open the Column management panel, where columns can be selected, hidden, or rearranged.
Prompt and response matching
To use the data quality table, define an association ID to match prompts with responses in the same row. Tracing analysis is only available for prompts and responses matched in the same row by association ID; aggregate custom metric data is excluded.
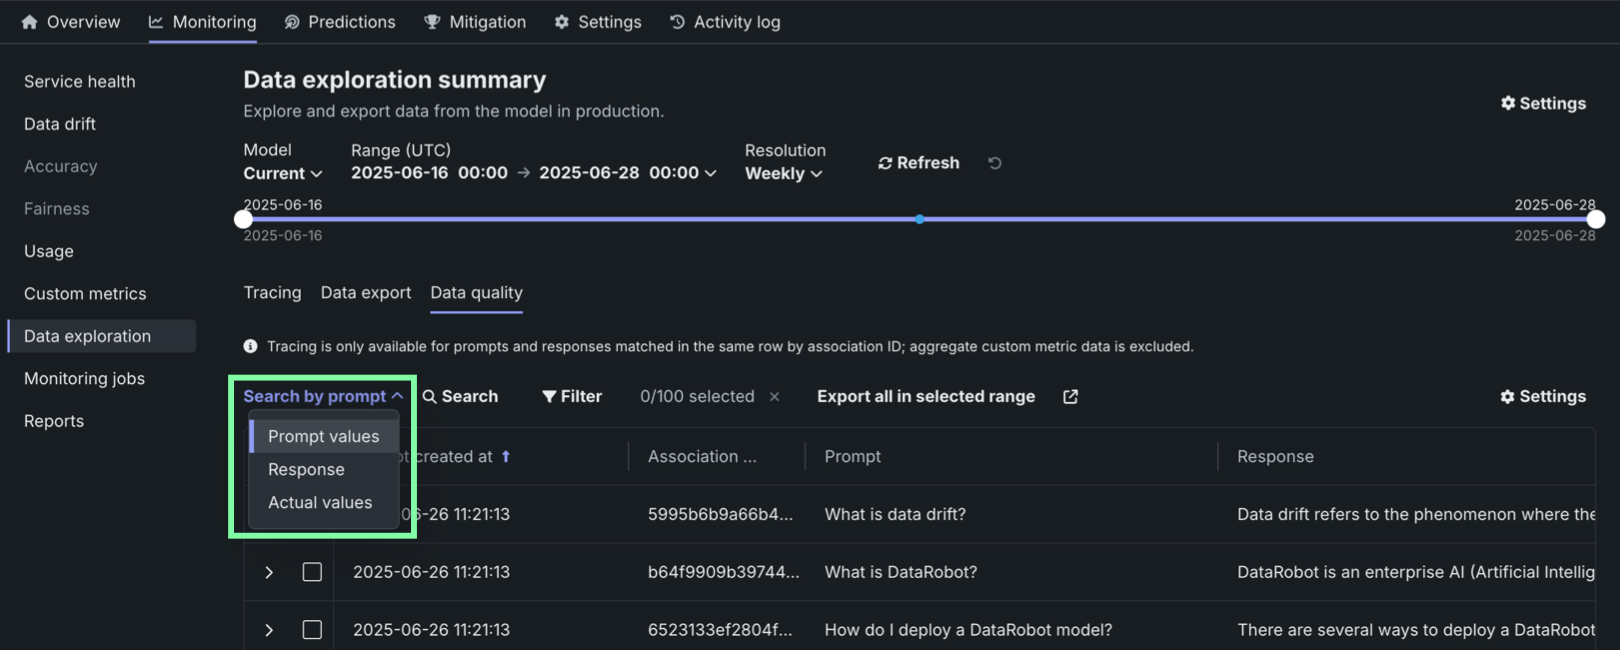
Locate specific rows in the Data quality table by searching. Click Search by and select Prompt values, Response, or Actual values. Then, click Search:
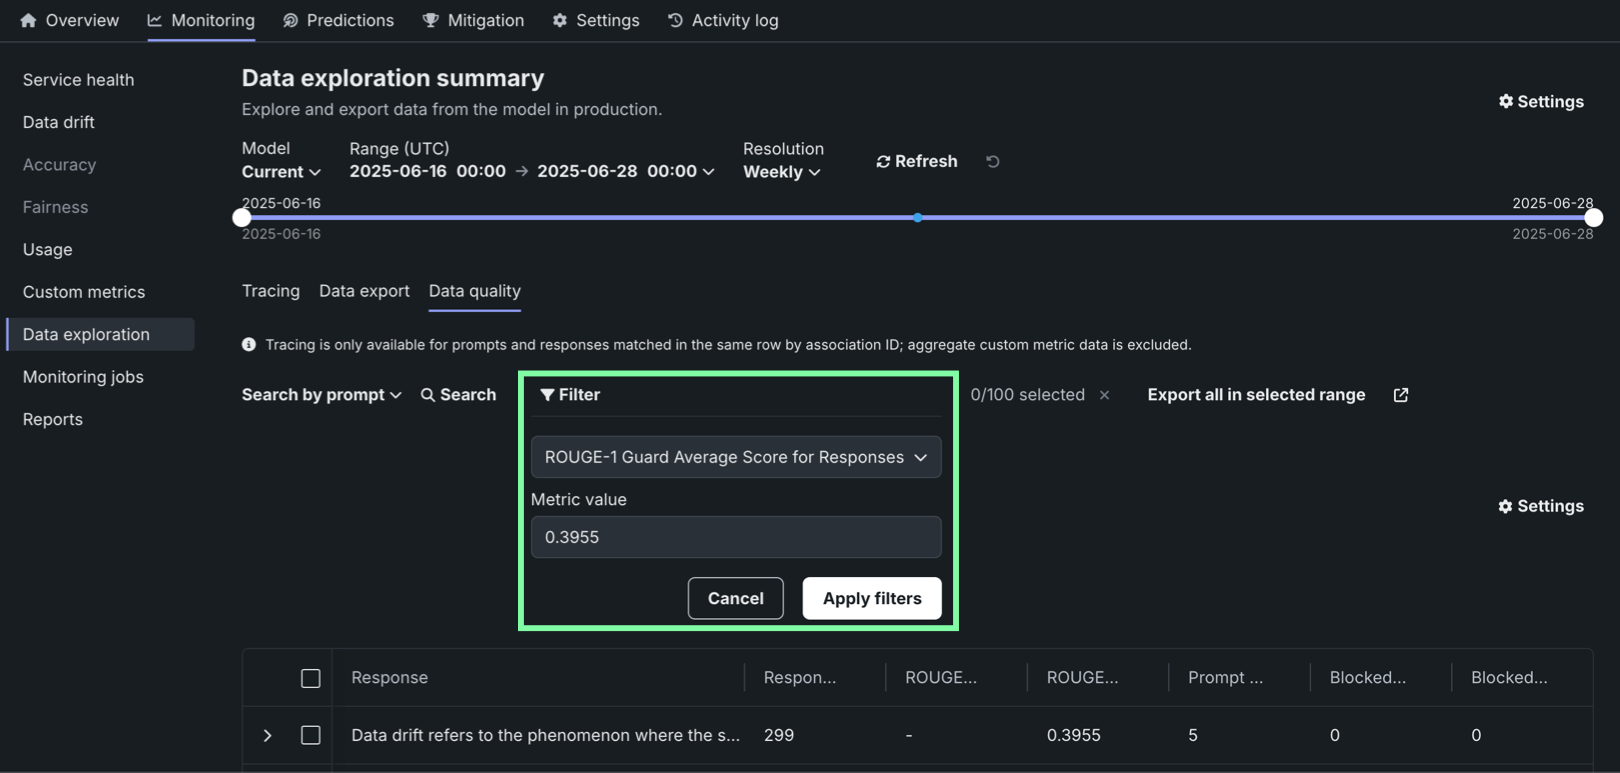
In addition, you can filter the Data quality table on a single custom metric value from one of the custom metrics created for the current deployment. To filter the table, click Filter, select a Metric, enter a Metric value, and then click Apply filters:
Sorting the data quality table
You can sort the Data quality table by clicking the column for Prompt created at, Association ID, or any custom metrics created for the current deployment.
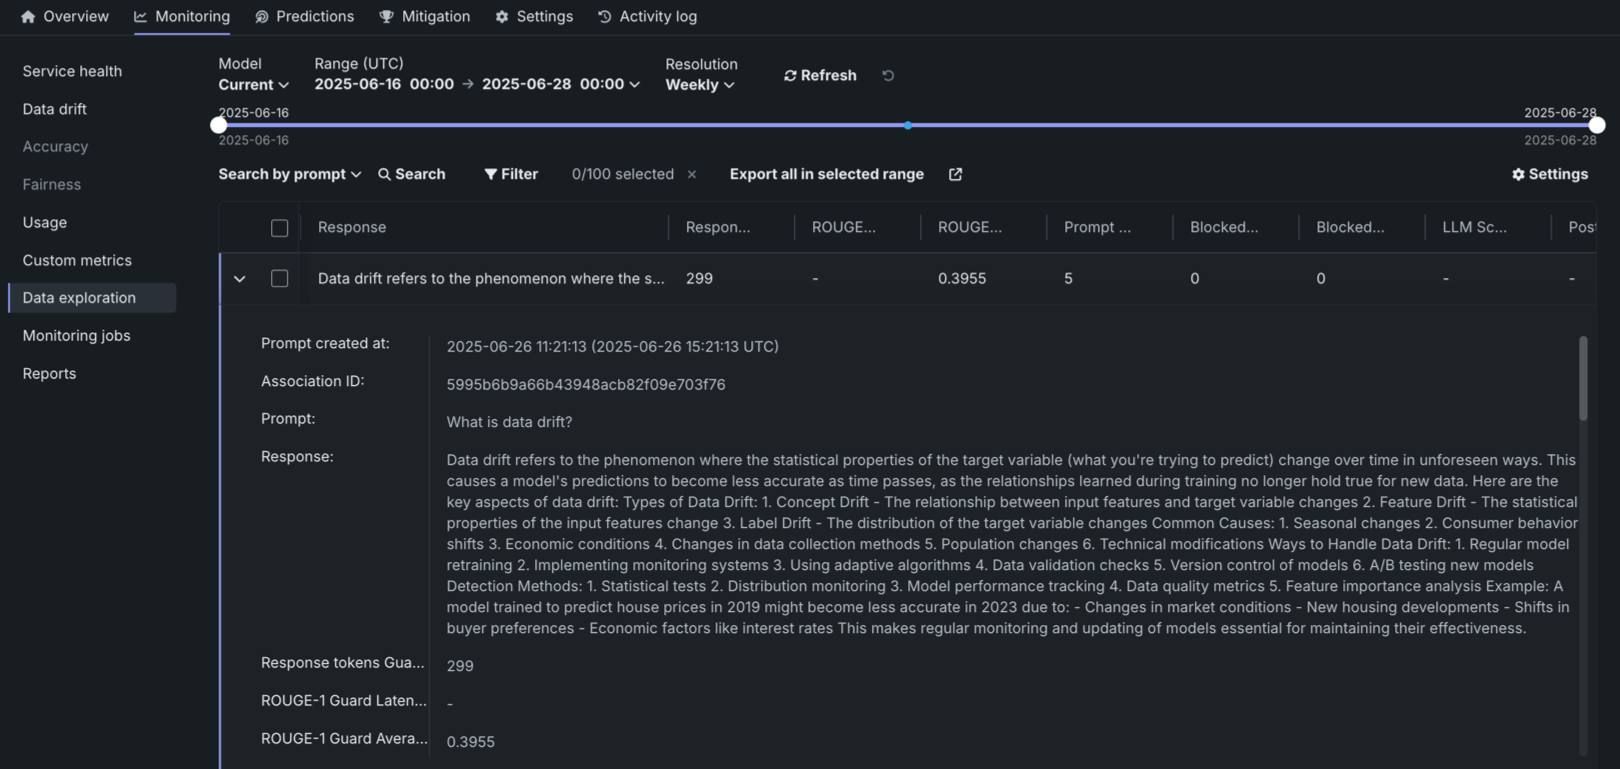
Click the open icon to expand the details panel. The display shows a row's full Prompt and the Response matched with the prompt by association ID. It also shows custom metric values and citations (if configured):
To export columns for external use, click Export all in selected range to export every row in the time range defined at the top of the Custom metrics, or click Export selected rows if you've selected one or more rows in the table: