Eureqa Models
| Tab | Description |
|---|---|
| Details | Provides access to model blueprints for Eureqa generalized additive models (Eureqa GAM), Eureqa regression, and Eureqa classification models. These blueprints use a proprietary Eureqa machine learning algorithm to construct models that balance predictive accuracy against complexity. |
The Eureqa modeling algorithm is robust when dealing with "noise" in the data and is highly flexible; it performs well across a wide variety of datasets. Eureqa typically finds simple, easily interpretable models with exportable expressions that provide an accurate fit to your data.
Eureqa GAM blueprints, a Eureqa/XGBoost hybrid, are available for both regression and classification projects.
When DataRobot runs a Eureqa blueprint, the Eureqa algorithm tries millions of candidate models and selects a handful (of varying complexity) which represent the best fit to the data. From the Eureqa Models insight, you can inspect and compare those models, and select one that best balances your requirements for complexity against predictive accuracy.
You can select one or more Eureqa GAM models to add to the Leaderboard for later deployment. Additionally, the ability to recreate Eureqa models enables you to fully reproduce their predictions outside of DataRobot. This is helpful for meeting requirements in regulated industries as well as for simplifying the steps to embed models in production software. Recreating a Eureqa model is as simple as copying and pasting the model expression to the target database or production environment. (Also, for GAM models only, parameters can be exported to recreate models.)
For additional information, see the Eureqa advanced tuning guide and the feature considerations.
Benefits of Eureqa models
There are a number of advantages to using Eureqa models:
-
They return human-readable and interpretable analytic expressions, which are easily reviewed by subject matter experts.
-
They are very good at feature selection because they are forced to reduce complexity during the model building process. For example, if the data had 20 different columns used to predict the target variable, the search for a simple expression would result in an expression that only uses the strongest predictors.
-
They work well with small datasets, so they are very popular with scientific researchers who gather data from physical experiments that don’t produce massive amounts of data.
-
They provide an easy way to incorporate domain knowledge. If you know the underlying relationship in the system that you're modeling, you can give Eureqa a "hint," (for example, the formula for heat transfer or how house prices work in a particular neighborhood) as a building block or a starting point to learn from. Eureqa will build machine learning corrections from there.
Build a Eureqa model
Eureqa models are run as part of Comprehensive Autopilot but not Quick Autopilot. They can also be accessed from the model Blueprint repository. They can be added to a supported experiment that started in manual mode or an existing experiment. See the model availability table for information on conditions for running models in each mode.
Eureqa Models tab
To view details for a Eureqa model, open it from the Leaderboard and then select the Details > Eureqa Models tab.
The following table describes elements of a Eureqa model in a sample classification project:
| Display component | Description |
|---|---|
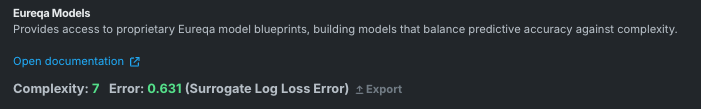
| 1 Eureqa model summary | Displays the model’s Eureqa complexity and Eureqa error. When viewing a Eureqa GAM only, an Export option is available to save the model's preprocessing and parameter information to CSV. |
| 2 Decimal rounding | Sets the number of decimal places to display for rounding in Eureqa constants when displaying the model expression. |
| 3 Models by error vs complexity graph | Plots model error against model complexity. |
| 4 Selected model details | Displays the mathematical model expression and plot for the selected model. |
| 5 Complexity selector | Available in the Selected model details graph, sets a different level of complexity for the model, updating the graph to reflect the new level. |
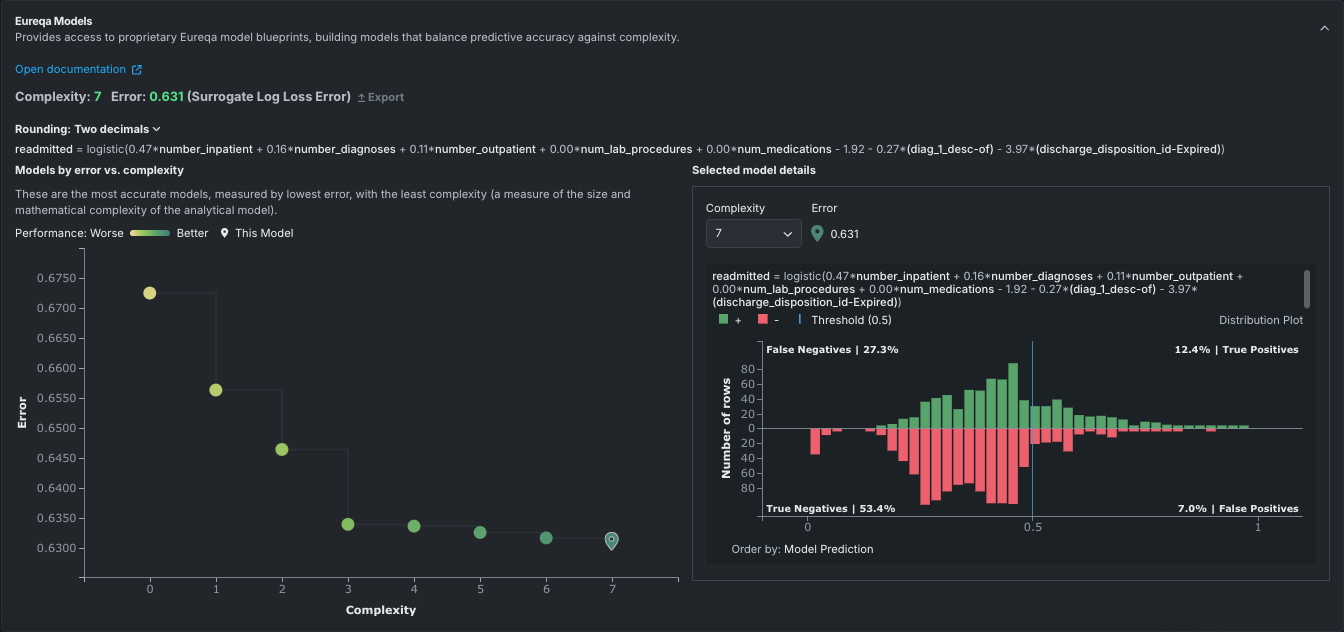
Eureqa model summary
The model summary information in the upper section displays complexity and error scores for the selected model. It also provides access to model export, which opens a dialog for downloading model preprocessing and parameter data for Eureqa GAM models.
The Complexity score reports the complexity of the selected model, as represented in the Models by Error vs. Complexity graph. Update the graph views, and this value, using the Complexity dropdown in the Selected model details graph. The Error value provides a mechanism for comparing Eureqa models.
Decimal rounding
To improve readability, DataRobot shows constants to two decimal points of precision by default. You can change the precision displayed from the Rounding dropdown. Changes to the display do not affect the underlying model, only the displayed model representation, which denotes the mathematical functions representing the model.
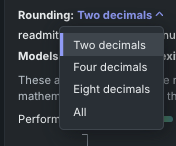
By default, two decimal point values are displayed.

Select four, eight, or All for more precision.

Models by error vs. complexity graph
The left panel of the Eureqa Model display plots model error against model complexity. Each point on the resulting graph (known as a Pareto front) represents a different model created by Eureqa. The color range for each point varies from yellow for the simplest and lowest accuracy model to green for the most complex and accurate model.
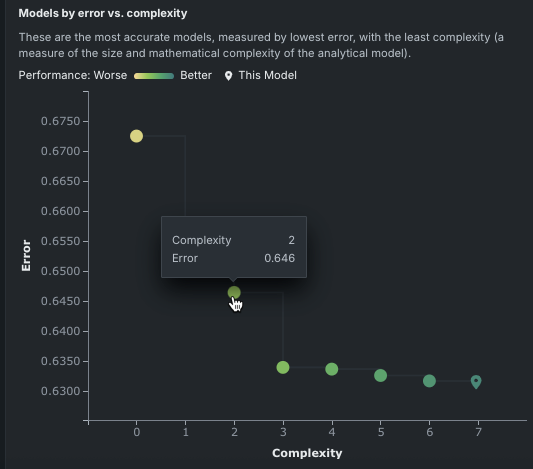
The location of the Leaderboard entry—the “current model”—is indicated on the graph (![]() ). Hover over any other point to display a tooltip reporting the model’s Eureqa complexity and Eureqa error. Clicking a model (point) updates the Selected model details graph on the right with details for that model.
). Hover over any other point to display a tooltip reporting the model’s Eureqa complexity and Eureqa error. Clicking a model (point) updates the Selected model details graph on the right with details for that model.
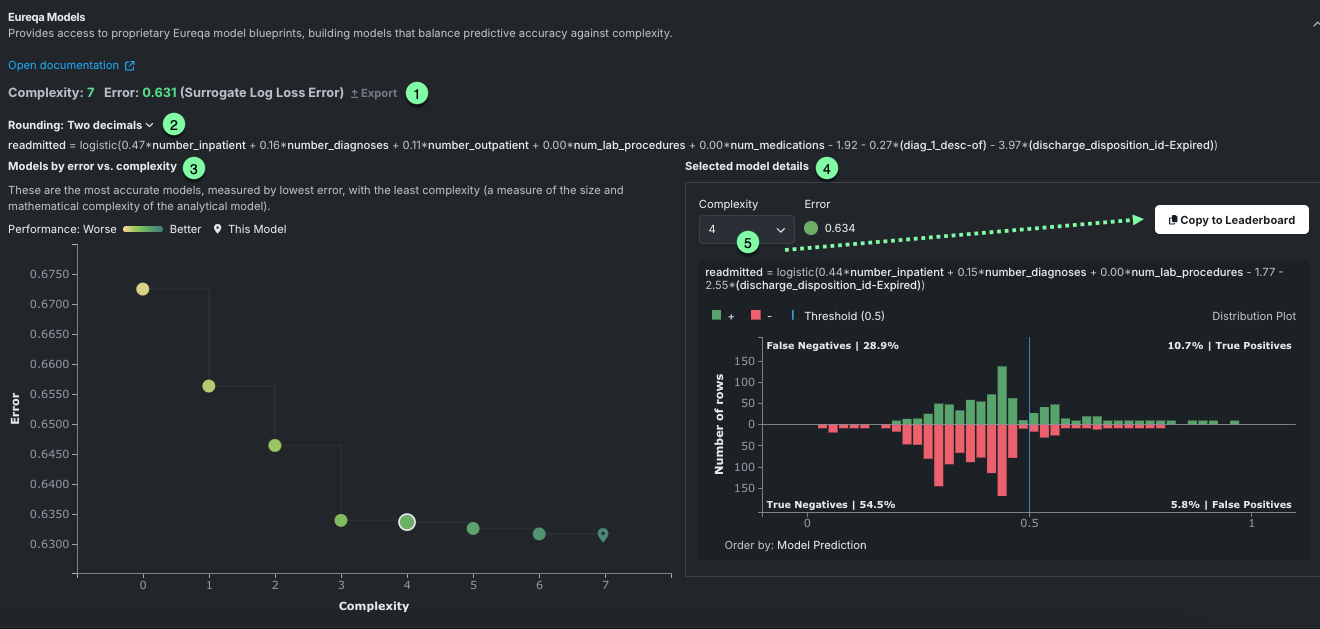
Selected model details graph
The Selected model details graph reports, for the selected model, the complexity and error scores, as well as the mathematical representation of the model. Update the graph by:
- Clicking a model (point) on the Models by Error vs. Complexity graph.
- Changing the complexity using the Complexity dropdown.
Selecting a different model activates the Move to Leaderboard button. Once you click the button, DataRobot creates a new, additional Leaderboard entry for the selected model. Because DataRobot already built the model, no new computations are needed.
The contents of the graphing portion are dependent on whether you are working with a regression or classification problem.
For regression projects
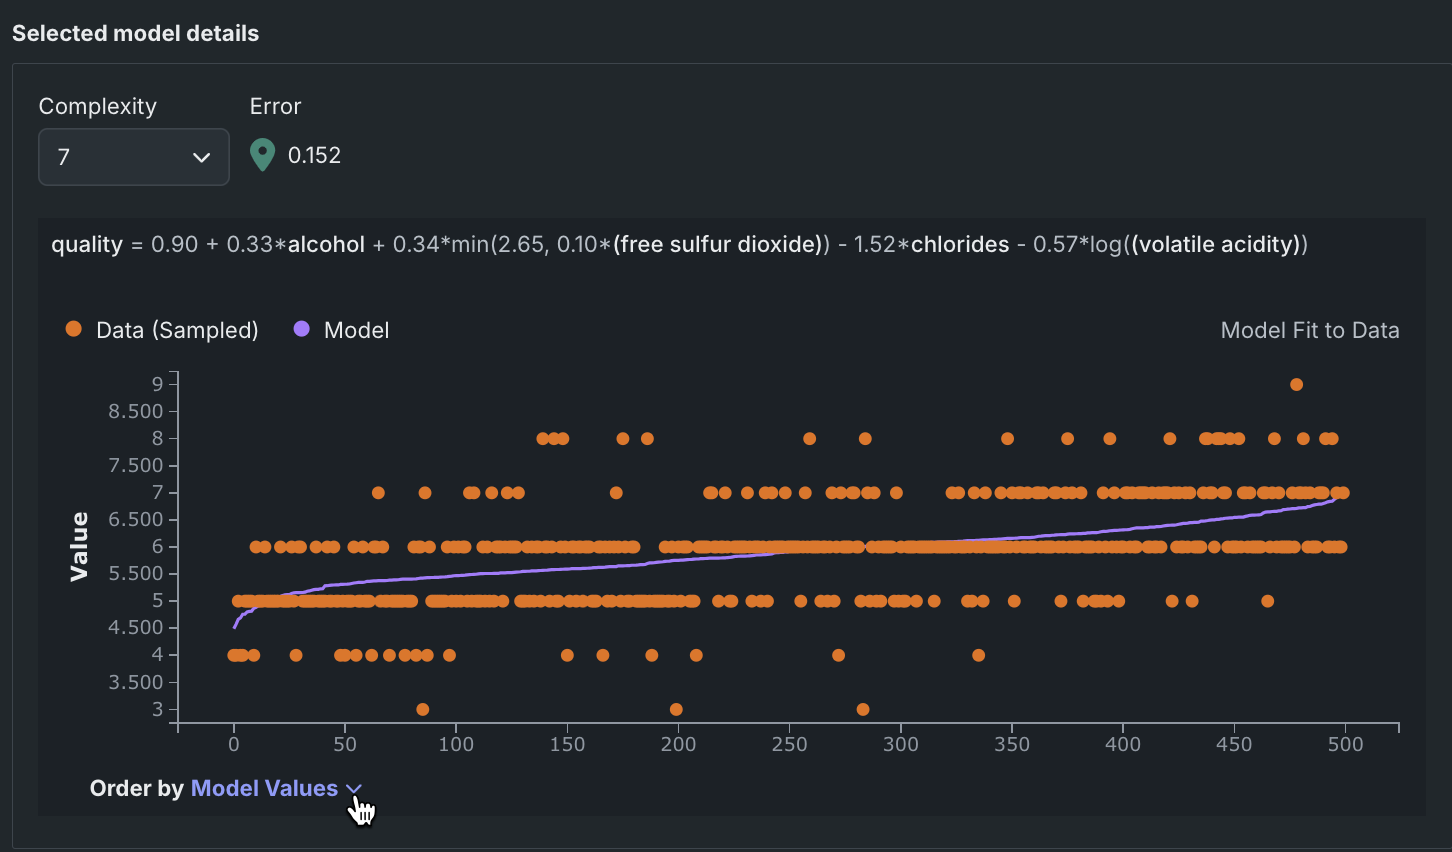
The Selected model detail graph for regression problems displays a scatter plot fit to data for the selected model. Similar to the Lift Chart, the orange points in the Selected Model Detail graph show the target value across the data; the purple line graphs model predictions. To see output for a different model, select a new model in the Models by error vs. complexity graph or choose a new complexity level.
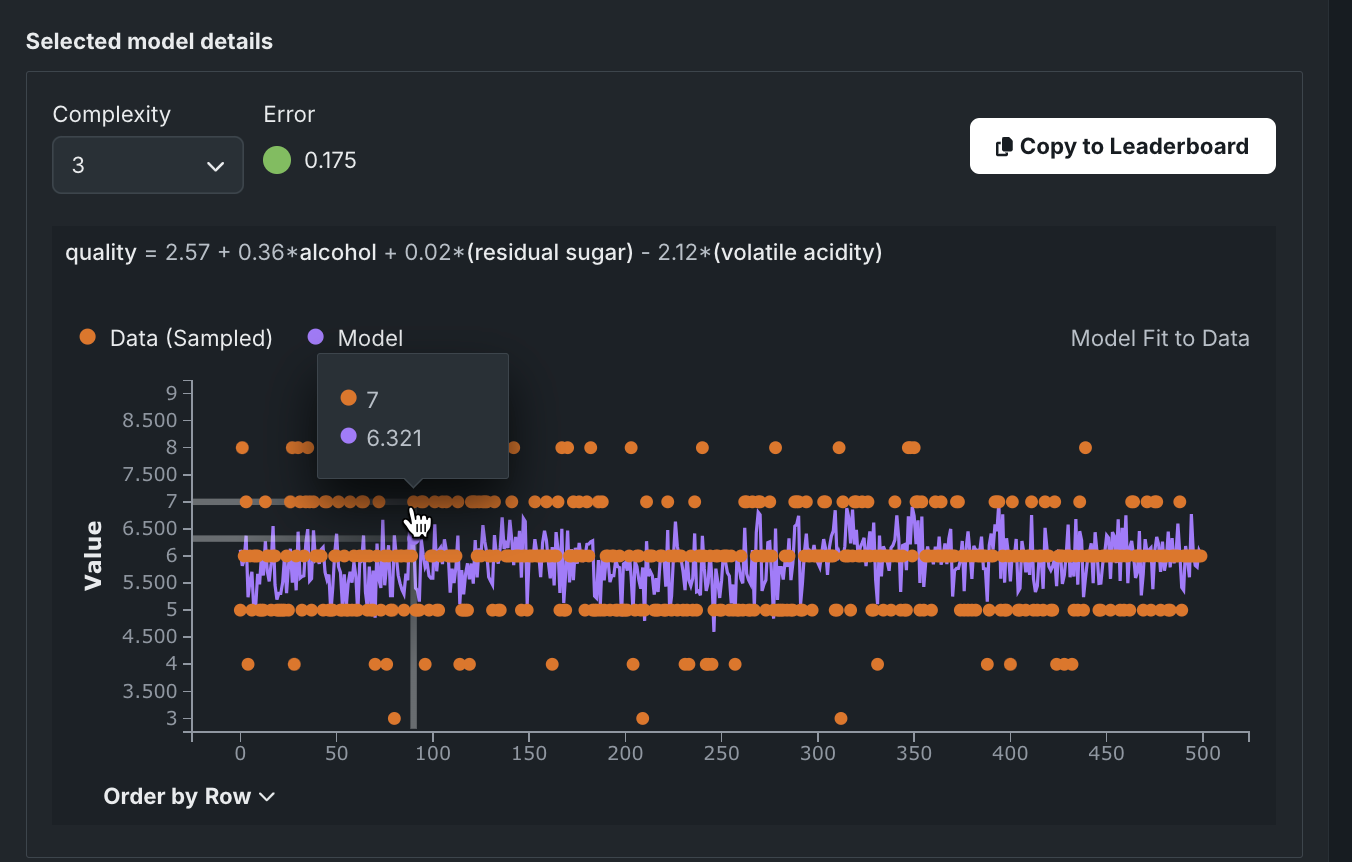
Interpret the graph as follows:
| Component | Description |
|---|---|
| 1 | Complexity values, error values, and model expression for the selected model. |
| 2 | Action to send the selected model to the Leaderboard. Because all available Eureqa models are built when first run, there is no additional processing necessary. |
| 3 | Tooltip displaying target values for sampled data and model predictions. |
| 4 | Dropdown to control row ordering along the X-axis. |
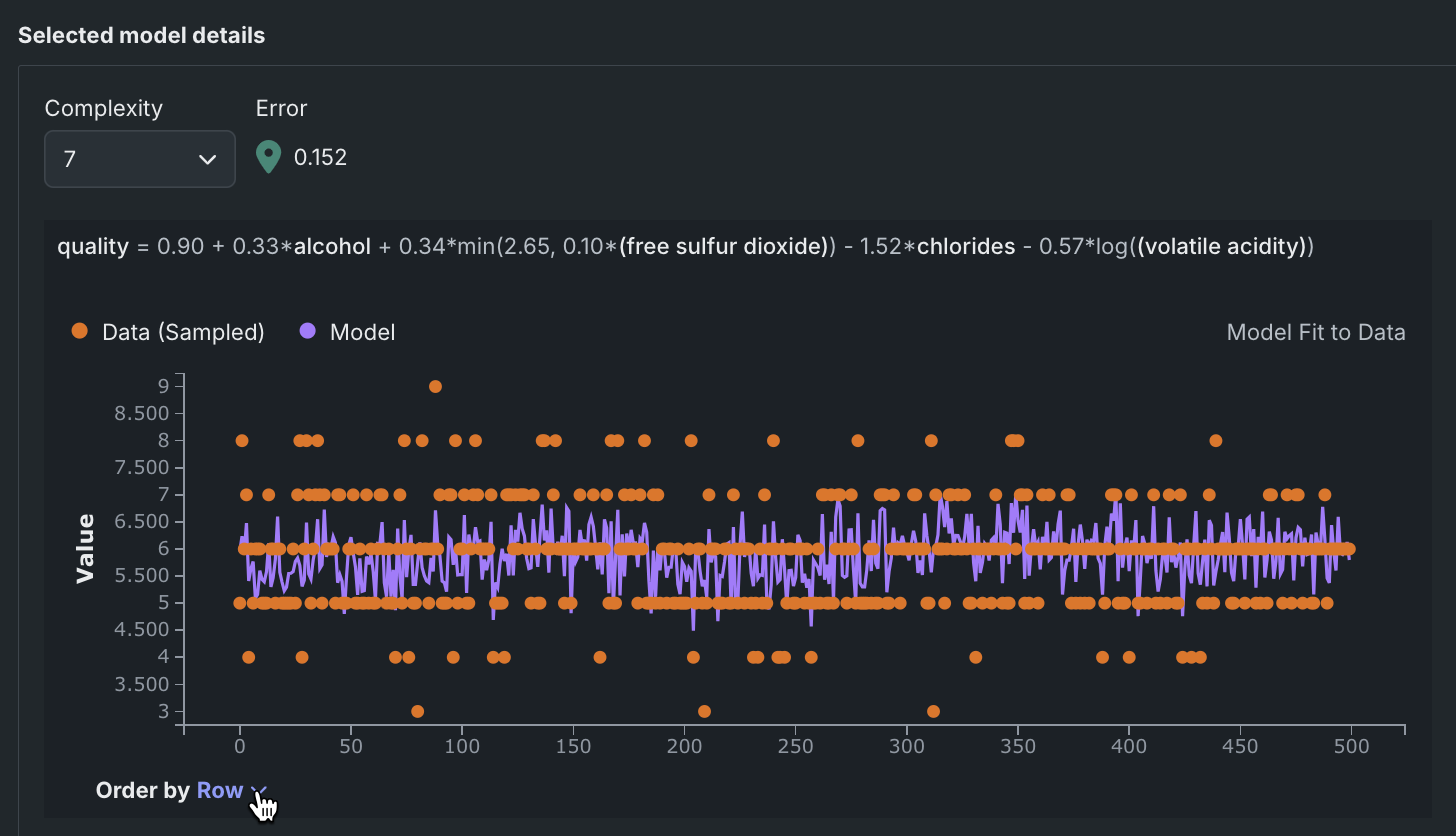
The Order by dropdown updates the graph based on selection.
Rows are ordered in the same order as the original data.
Rows are ordered by the target values (actuals).
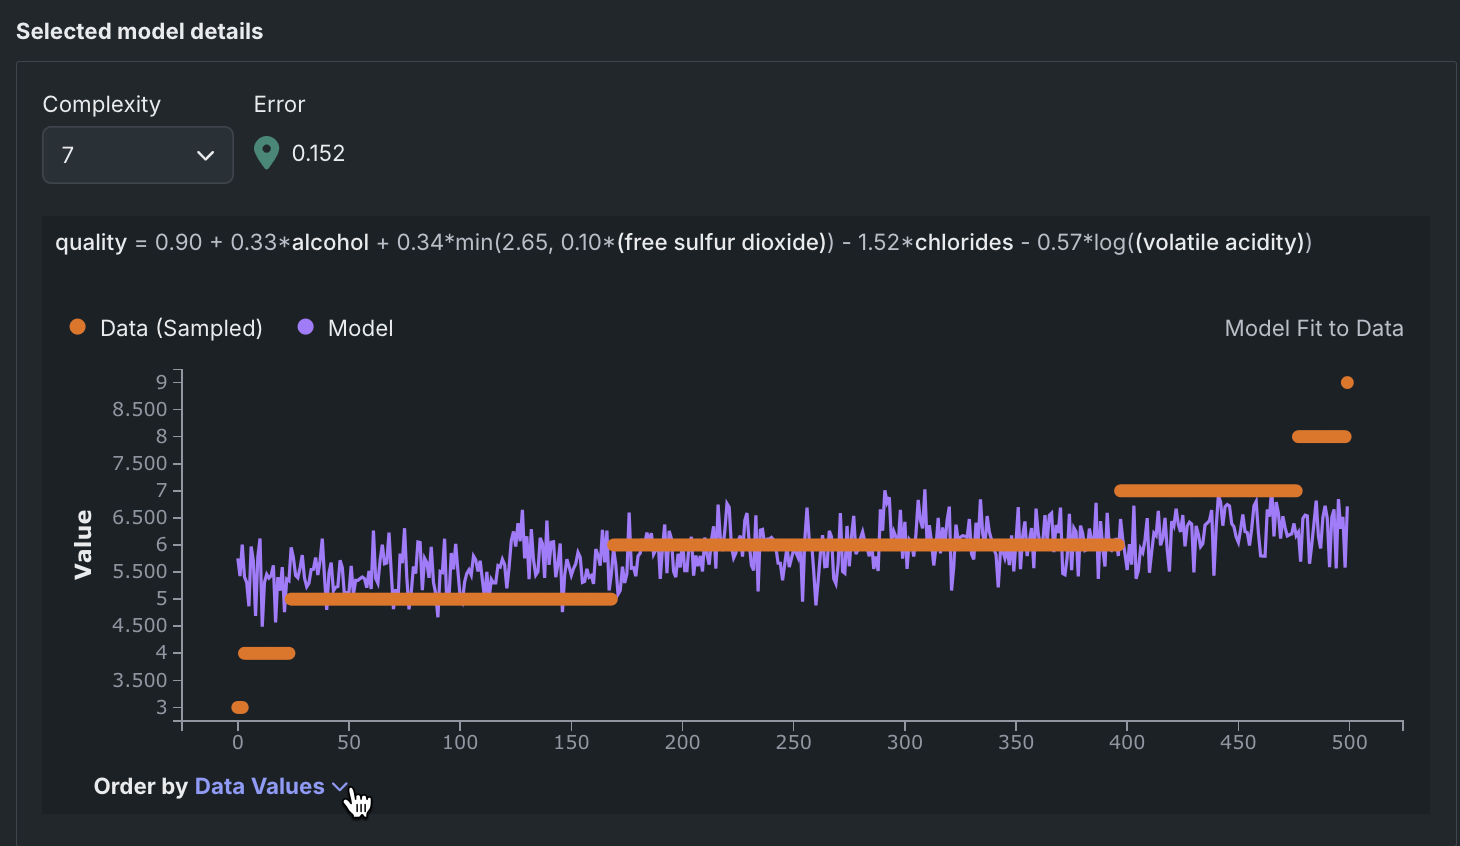
Rows are ordered by the model predictions.
For classification projects
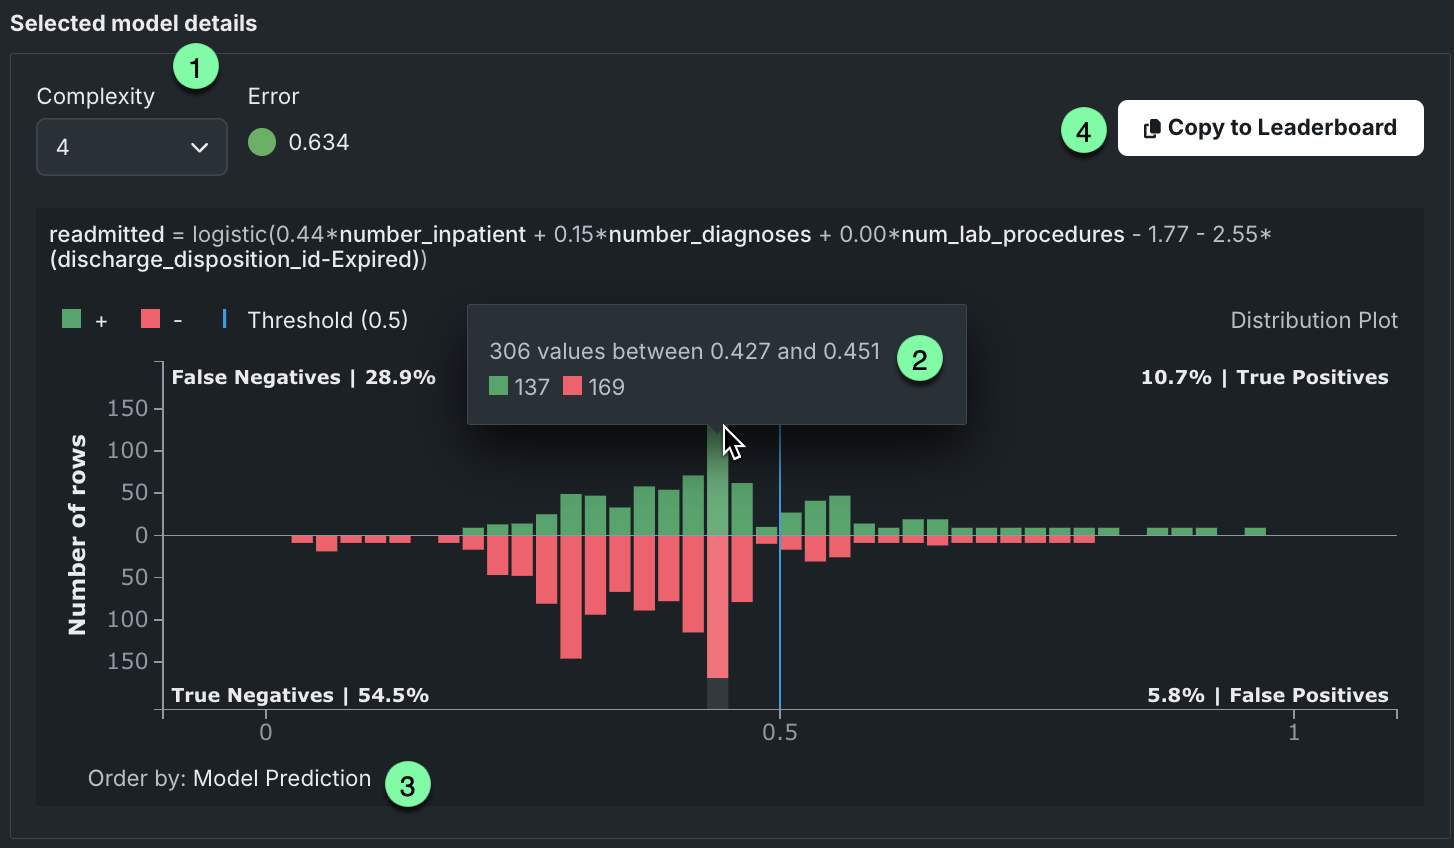
The Selected model details graph for classification problems displays a distribution histogram—a confusion matrix—for the selected model. That is, it shows the percentage of model predictions that fall into each of n buckets, spaced evenly across the range of model predictions. For more information about understanding a confusion matrix, see a general description in the ROC Curve details.
The histogram displays all predicted values applicable to the selected model. To see output for a different model, use the Complexity dropdown or select a new model (different point) in the Models by Error vs. Complexity graph.
Interpret the graph as follows:
| Component | Description |
|---|---|
| 1 | Complexity values, error values, and model expression for the selected model. |
| 2 | Tooltip describing the content of the bucket, including total values, range of values, and breakdown of true/false counts. |
| 3 | OIndicator that the order by value for the rows along the X-axis by model predictions. |
| 4 | Action to send the selected model to the Leaderboard. Because all available Eureqa models are built when first run, there is no additional processing necessary. |
The histogram displays a vertical threshold line (just below 0.5 in the above example), dividing the plot into four regions. The top portion of the plot shows all rows where the target value was 1 while the bottom portion includes all rows where the target value was 0. All predictions to the left of the threshold were predicted false (negative); lower left represents correct predictions, upper left incorrect predictions. Values to the right of the threshold are predicted to be true. Histogram counts are computed across the entire training dataset.
Export model parameters
Note
Although you can recreate GAM models using the Export button, another simple way to recreate any GAM or non-GAM Eureqa model is by copying and pasting the model expression into the target environment directly (such as a SQL query, Python, Java, etc.).
The Export button opens a window allowing you to download the Eureqa preprocessing and parameter table for the selected Leaderboard entry. This export provides all the information necessary to recreate the GAM model outside of DataRobot.
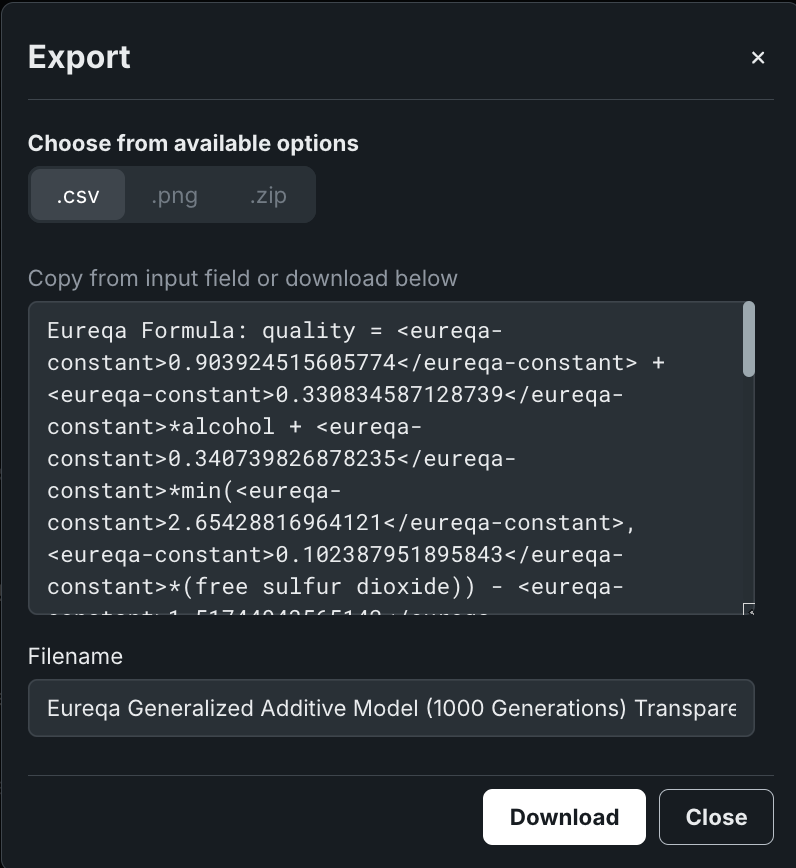
Interpret the output in the same way as you would the export available from the Coefficients tab (with GAM-specific information here), with the following differences:
-
The first section of output shows the Eureqa model formula. This is the mathematical equation displayed at the top of the Eureqa Models tab, beginning with
Target=.... -
The second section displays the DataRobot preprocessing parameters for each feature used in the model, which includes parameters for one or two input transformations (e.g., standardization). With Eureqa models, the
Coefficientfield is set to 0 when there are no text or-high cardinality features. “Coefficient” is used in linear models to denote the column’s linearly-fit coefficient. -
Eureqa model parameters can be exported to .csv format only (.png and .zip options are disabled).
Eureqa reference
With traditional DataRobot model building, data is split into training, validation, and holdout sets. Eureqa, by contrast, uses the training DataRobot split and then, to compute the Eureqa error, further splits that set using its own internal training/validation splitting logic.
Model availability
The following table describes the conditions under which Eureqa models for AutoML and time series are available in Comprehensive Autopilot and from the repository.
| Eureqa model type | Comprehensive Autopilot | Repository |
|---|---|---|
| AutoML experiments | ||
| Regressor/Classifier |
|
|
| GAM |
|
|
| Time series experiments | ||
| Regressor/Classifier |
|
No restrictions |
| GAM |
|
No restrictions |
| Eureqa With Forecast Distance Modeling | N/A |
|
Number of generations
The following table describes the number of generations performed, based on blueprint selected. Generation values are reflected in the blueprint name.
| Eureqa model type | Comprehensive Autopilot generations | Repository generations |
|---|---|---|
| Regressor/Classifier | 250 | 40, 250, or 3000 |
| GAM | Dynamic* | 40, dynamic*, or 10,000 |
* The dynamic option for the number of generations is based on the number of rows in the dataset. The value will be between 1000 and 3000 generations.
Eureqa and stacked predictions
Because it would be too computationally "expensive" to do so, Eureqa blueprints don't support stacked predictions. Most models use stacking to generate predictions on the data that was used to create the project. When you generate Eureqa predictions on the training data, all predictions will come from a single Eureqa model, not from stacking.
As a result, the Eureqa error isn't exactly the error on the data; it's the error on a filtered version of the data. This explains why the reported Eureqa error can be lower than the Leaderboard error when the error metrics are the same. You cannot change the Eureqa error metric, although you can change the DataRobot optimization metric (the value DataRobot uses to rank models on the Leaderboard).
The following lists differences from non-Eureqa modeling due to lack of stacked predictions:
- lenders that train on predictions (for example, GLM or ENET) are disabled. Other blenders are available (such as AVG or MED).
- Validation and cross-validation scores are hidden for Eureqa and Eureqa GAM models trained into validation and/or holdout.
- Downloading predictions on training data is disabled.
Model training process
When training a Eureqa model, DataRobot executes either a new solution search or a refit:
- New solution search: The Eureqa evolution process does a complete search, looking for a new set of solutions. The mechanism is slower than retrofitting.
- Refit: Eureqa refits coefficients of the linear components. In other words, it takes the target expression from the existing solution, extracts linear components, and refits its coefficients using all the training data.
The following table describes, for each Eureqa model type, training behavior for validation/backtesting and frozen runs:
| Model type | Backtesting/Cross-Validation | Frozen run |
|---|---|---|
| Eureqa Regressor/Classifier | Refits coefficients of existing solutions from the model trained on the first fold. | Refits coefficients of existing solutions from the parent model. |
| Eureqa GAM* | Refits coefficients of existing solutions from the model trained on the first fold. | Freezes XGBoost hyperparameters; performs new solution search for Eureqa second-stage models. |
| Eureqa with Forecast Distance Modeling (selects the best solution—per strategy—for each forecast distance) | Performs a new solution search. | Performs a new solution search with fixed Eureqa building blocks. |
* Eureqa GAM consists of two stages. The first stage is XGBoost, the second stage is Eureqa approximating the XGBoost model but trained on a subset of the training data.
Deterministic modeling
Like other DataRobot models, Eureqa's model-generation process is deterministic: if you run Eureqa twice against the same data, with the same configuration arguments, you will get the same model—same error, same complexity, and same model equation. Because of Eureqa's unique model-generation process, if you make a very small change in its inputs, such as removing a single row or changing a tuning parameter slightly, it's possible that you will get a very different model equation.
Tune with error metrics
The metric used by Eureqa for Eureqa GAM (Mean Absolute Error) is a "surrogate" error, as the Eureqa GAM blueprint runs Eureqa on the output of XGBoost. It measures how well Eureqa could reproduce the raw output of XGBoost. For regression, you can change the loss function used in XGBoost in the advanced option but you cannot change the Eureqa error metric. You can also change the DataRobot optimization metric (the value DataRobot uses to rank models on the Leaderboard). This tuning affects the tuning of XGBoost and the default choice of XGBoost loss function, and leads to different results for Eureqa GAM.
Feature considerations
The following considerations apply to working with both GAM and general Eureqa models.
Note
Eureqa model blueprints are deterministic only if the number of cores in the training and validation environments is kept constant. If the configurations differ, the resulting Eureqa blueprints produce different results.
-
There is no support for multiclass modeling.
-
Cross-validation can only be run from the Leaderboard (not from the repository).
-
For legacy Eureqa SaaS product users, accuracy may be comparatively reduced due to fewer cores. (Legacy users can contact their DataRobot representative to discuss options for addressing this.)
-
Eureqa Scoring Code is available for both AutoMl and time series. When using with time series, Scoring Code is supported for Eureqa regression and Eureqa GAMs only (no classification).