Logging into AWS CloudWatch log
Note: this documentation and setup can be considered deprecated in favour
of the setup with the datarobot-observability-core subchart with
OpenTelemetry as documented by the Enterprise Monitoring Guide.
Logging setup
AWS provides an option to stream container logs to CloudWatch, allowing easy access to logs without the need to log into each individual container.
To set up CloudWatch Logging, follow these steps. Please note this example uses <my-eks-cloudwatch> as a role name. Replace this with a role name suitable for your situation.
Preparation
Firstly, ensure your environment is set up for AWS access. There are multiple ways to achieve this. For instance, setting up a few environment variables. Obtain actual values from the AWS site.
export AWS_ACCESS_KEY_ID="YOUR-KEY-ID"
export AWS_SECRET_ACCESS_KEY="YOUR-ACCESS-KEY"
export AWS_SESSION_TOKEN="SESSION-TOKEN"
Setup
- Set up variables required to associate logging. Please provide cluster name for your own use case.
account_id=$(aws sts get-caller-identity --query "Account" --output text)

oidc_provider=$(aws eks describe-cluster --name <my-eks-cluster> --query "cluster.identity.oidc.issuer" --output text | cut -d '/' -f 5)
-
Create a trust policy file for cloudwatch logging
cat >cloudwatch-trust-relationship.json <<EOF { "Version": "2012-10-17", "Statement": [ { "Effect": "Allow", "Principal": { "Federated": "arn:aws:iam::$account_id:oidc-provider/$oidc_provider" }, "Action": "sts:AssumeRoleWithWebIdentity", "Condition": { "StringLike": { "$oidc_provider:aud": "sts.amazonaws.com" } } } ] } EOF -
Create an IAM role with the policy document you just created. Please provide your own role name.
aws iam create-role --role-name <my-eks-cloudwatch-role> --assume-role-policy-document file://cloudwatch-trust-relationship.json -
Attach the policy named CloudWatchAgentServerPolicy to the new role
aws iam attach-role-policy --role-name <my-eks-cloudwatch> --policy-arn=arn:aws:iam::aws:policy/CloudWatchAgentServerPolicy -
Confirm that the IAM role's trust policy is configured correctly
aws iam get-role --role-name <my-eks-cloudwatch> --query Role.AssumeRolePolicyDocument -
Export the EKS CloudWatch role ARN
export CLOUDWATCH_EKS_ARN="arn:aws:iam::293058073847:role/<my-eks-cloudwatch>" -
Create a namespace called amazon-cloudwatch
Please note that the above command may not work if you haven't configured kubernetes to point to the right cluster. If so, please run following command to configure that connection.kubectl apply -f https://raw.githubusercontent.com/aws-samples/amazon-cloudwatch-container-insights/latest/k8s-deployment-manifest-templates/deployment-mode/daemonset/container-insights-monitoring/cloudwatch-namespace.yamlk8s aws eks update-kubeconfig --name <my-eks-cluster> --region <region-name> -
Run this command to create a ConfigMap called fluent-bit-cluster-info, including the cluster name and the Region that you want to send logs to. Replace
<my-eks-cluster>and<my-cluster-region>with your cluster's name and RegionClusterName=<my-eks-cluster> RegionName=<my-cluster-region> FluentBitHttpPort='2020' FluentBitReadFromHead='Off' [[ ${FluentBitReadFromHead} = 'On' ]] && FluentBitReadFromTail='Off'|| FluentBitReadFromTail='On' [[ -z ${FluentBitHttpPort} ]] && FluentBitHttpServer='Off' || FluentBitHttpServer='On' kubectl create configmap fluent-bit-cluster-info \ --from-literal=cluster.name=${ClusterName} \ --from-literal=http.server=${FluentBitHttpServer} \ --from-literal=http.port=${FluentBitHttpPort} \ --from-literal=read.head=${FluentBitReadFromHead} \ --from-literal=read.tail=${FluentBitReadFromTail} \ --from-literal=logs.region=${RegionName} -n amazon-cloudwatch -
Deploy the Fluent Bit optimized configuration DaemonSet to the cluster
kubectl apply -f https://raw.githubusercontent.com/aws-samples/amazon-cloudwatch-container-insights/latest/k8s-deployment-manifest-templates/deployment-mode/daemonset/container-insights-monitoring/fluent-bit/fluent-bit.yaml -
Optional: Patch the aws-for-fluent-bit DaemonSet to use the AWS for Fluent Bit image on Amazon Elastic Container Registry
kubectl patch ds fluent-bit -n amazon-cloudwatch -p \ '{"spec":{"template":{"spec":{"containers":[{"name":"fluent-bit","image":"public.ecr.aws/aws-observability/aws-for-fluent-bit:latest"}]}}}}' -
Associate the IAM role with the cloudwatch-agent and fluent-bit service accounts.
kubectl annotate serviceaccounts fluent-bit -n amazon-cloudwatch "eks.amazonaws.com/role-arn=$CLOUDWATCH_EKS_ARN"
At this stage, the new log groups should be visible in the CloudWatch User Interface. Your cluster has three log groups created.
  * /aws/containerinsights/my-eks-cluster/application
  * /aws/containerinsights/my-eks-cluster/dataplane
  * /aws/containerinsights/my-eks-cluster/host
If you don't see the log groups, there is a chance that the access was denied to create log stream. Please run the following command to approve the access.
eksctl create iamserviceaccount --region <region-name> --name fluent-bit --namespace amazon-cloudwatch --cluster <my-eks-cluster> --attach-policy-arn arn:aws:iam::aws:policy/CloudWatchAgentServerPolicy --override-existing-serviceaccounts --approve
For more information on how to set up the DataRobot application log group to an S3 bucket, refer to Export log data to Amazon S3 guide. To learn more about how to stream container logs to CloudWatch, refer to How to stream container logs to CloudWatch guide for detailed information.
For information on configuring log levels, see the Modifying Application Log Levels of this guide.
Logging search/analysis
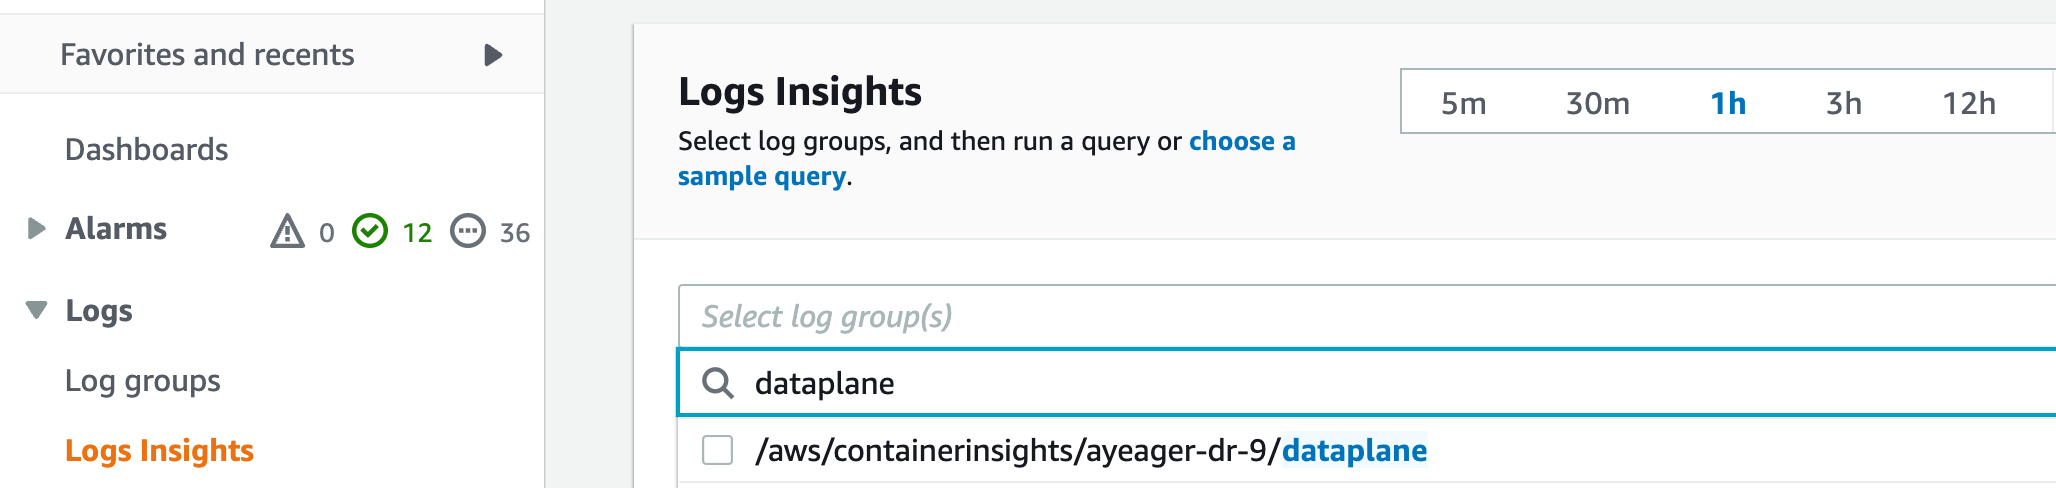
To search and analyze logs, CloudWatch provides a user interface that allows you to search specific log groups from the Log Group menu or across different log groups from the Log Insight menu. On the Log analysis page, select the log groups you want to search against and write queries using CloudWatch's query language to search, filter, parse, and generate metrics.
You can adjust the time range for log searches by selecting a different range or providing a custom absolute time range. For local analysis, you can export the log analysis results in CSV format by clicking the "Export results" button.
Refer to Logs Insights to learn more on how to analyze the logs.
Sample log queries
The following queries show some common log search queries that can help identify potential issues.
Query to search for logs that contains "error", "exception", or "fail" keywords
fields @timestamp, @message, @logStream, @log
| filter @message like /(?i)(Exception|error|fail)/
| sort @timestamp desc
Query to search for logs with ERROR log level
fields @timestamp, @log, @message
| parse @message '"levelname":"*"' as loglevel
| filter loglevel="ERROR"
| sort error_count desc
Query to search for logs with WARNING log level
fields @timestamp, @log, @message
| parse @message '"levelname":"*"' as loglevel
| filter loglevel="WARNING"
| sort error_count desc
Query to search logs that contains certain project ID
# replace <project_id> with project of interest
fields @timestamp, @log
| filter strcontains(log, "project-id")
| parse @log /\"project-id\":\"(?<project_id>.*?)\"/
| filter ispresent(project_id)
Query to search kubelet error/warning per ec2 instance
fields @timestamp, @message, ec2_instance_id
| filter   message =~ /.*(E|W)[0-9]{4}.*/
# uncomment the following line to only see the count
#| stats count(*) as error_count by ec2_instance_id
Query to count from stderr
stats count() as error_count by kubernetes.container_name
| filter stream="stderr"
| sort error_count desc
Query to view counts for error and warning
fields @timestamp, @log, @message
| parse @message '"levelname":"*"' as loglevel
| filter loglevel="ERROR" or loglevel="WARNING"
| stats count() as error_count by loglevel
| sort error_count desc