Observability subchart
This section shows how to configure the DataRobot chart to export platform telemetry to an observability backend with OpenTelemetry:
- The structure of the observability subchart, each of the instances that compose it, and the responsibilities of each
- How to install and configure the observability subchart, including the configuration of exporters of supported backends, as well as the provisioning of these for AWS, Azure and GCP
- How to optionally extend OTEL pipelines
- How to run helm tests to ensure that receivers are ready to accept telemetry data
Platform telemetry encompasses logs, metrics, and traces to monitor the overall performance, availability, and resource utilization of the system, as well as troubleshooting. User level workload telemetry such as user workload logs or agentic traces aren't included.
Subchart structure
The observability sub-chart is named datarobot-observability-core, which is
in turn composed of several other charts:
kube-state-metrics: service that generates metrics about the state of the objects (chart)prometheus-node-exporter(daemonset): prometheus exporter for hardware and OS metrics exposed by *NIX kernels (chart)
And several OpenTelemetry collector instances (chart), broken down below by the telemetry they export:
| Collector subchart name | Mode | Logs | Metrics | Traces |
|---|---|---|---|---|
opentelemetry-collector-daemonset |
daemonset | Events, pod logs | cAdvisor, kubelet stats | N/A |
opentelemetry-collector-deployment |
deployment | N/A | Application SDK instrumented | Application SDK instrumented |
opentelemetry-collector-scraper |
deployment | N/A | k8s service endpoints, control plane | N/A |
opentelemetry-collector-scraper-static |
deployment | N/A | kube-state-metrics | N/A |
opentelemetry-collector-statsd |
deployment | N/A | Application SDK instrumented | N/A |
High level architecture
The following diagram shows a high level view of the whole setup for a DataRobot cluster.
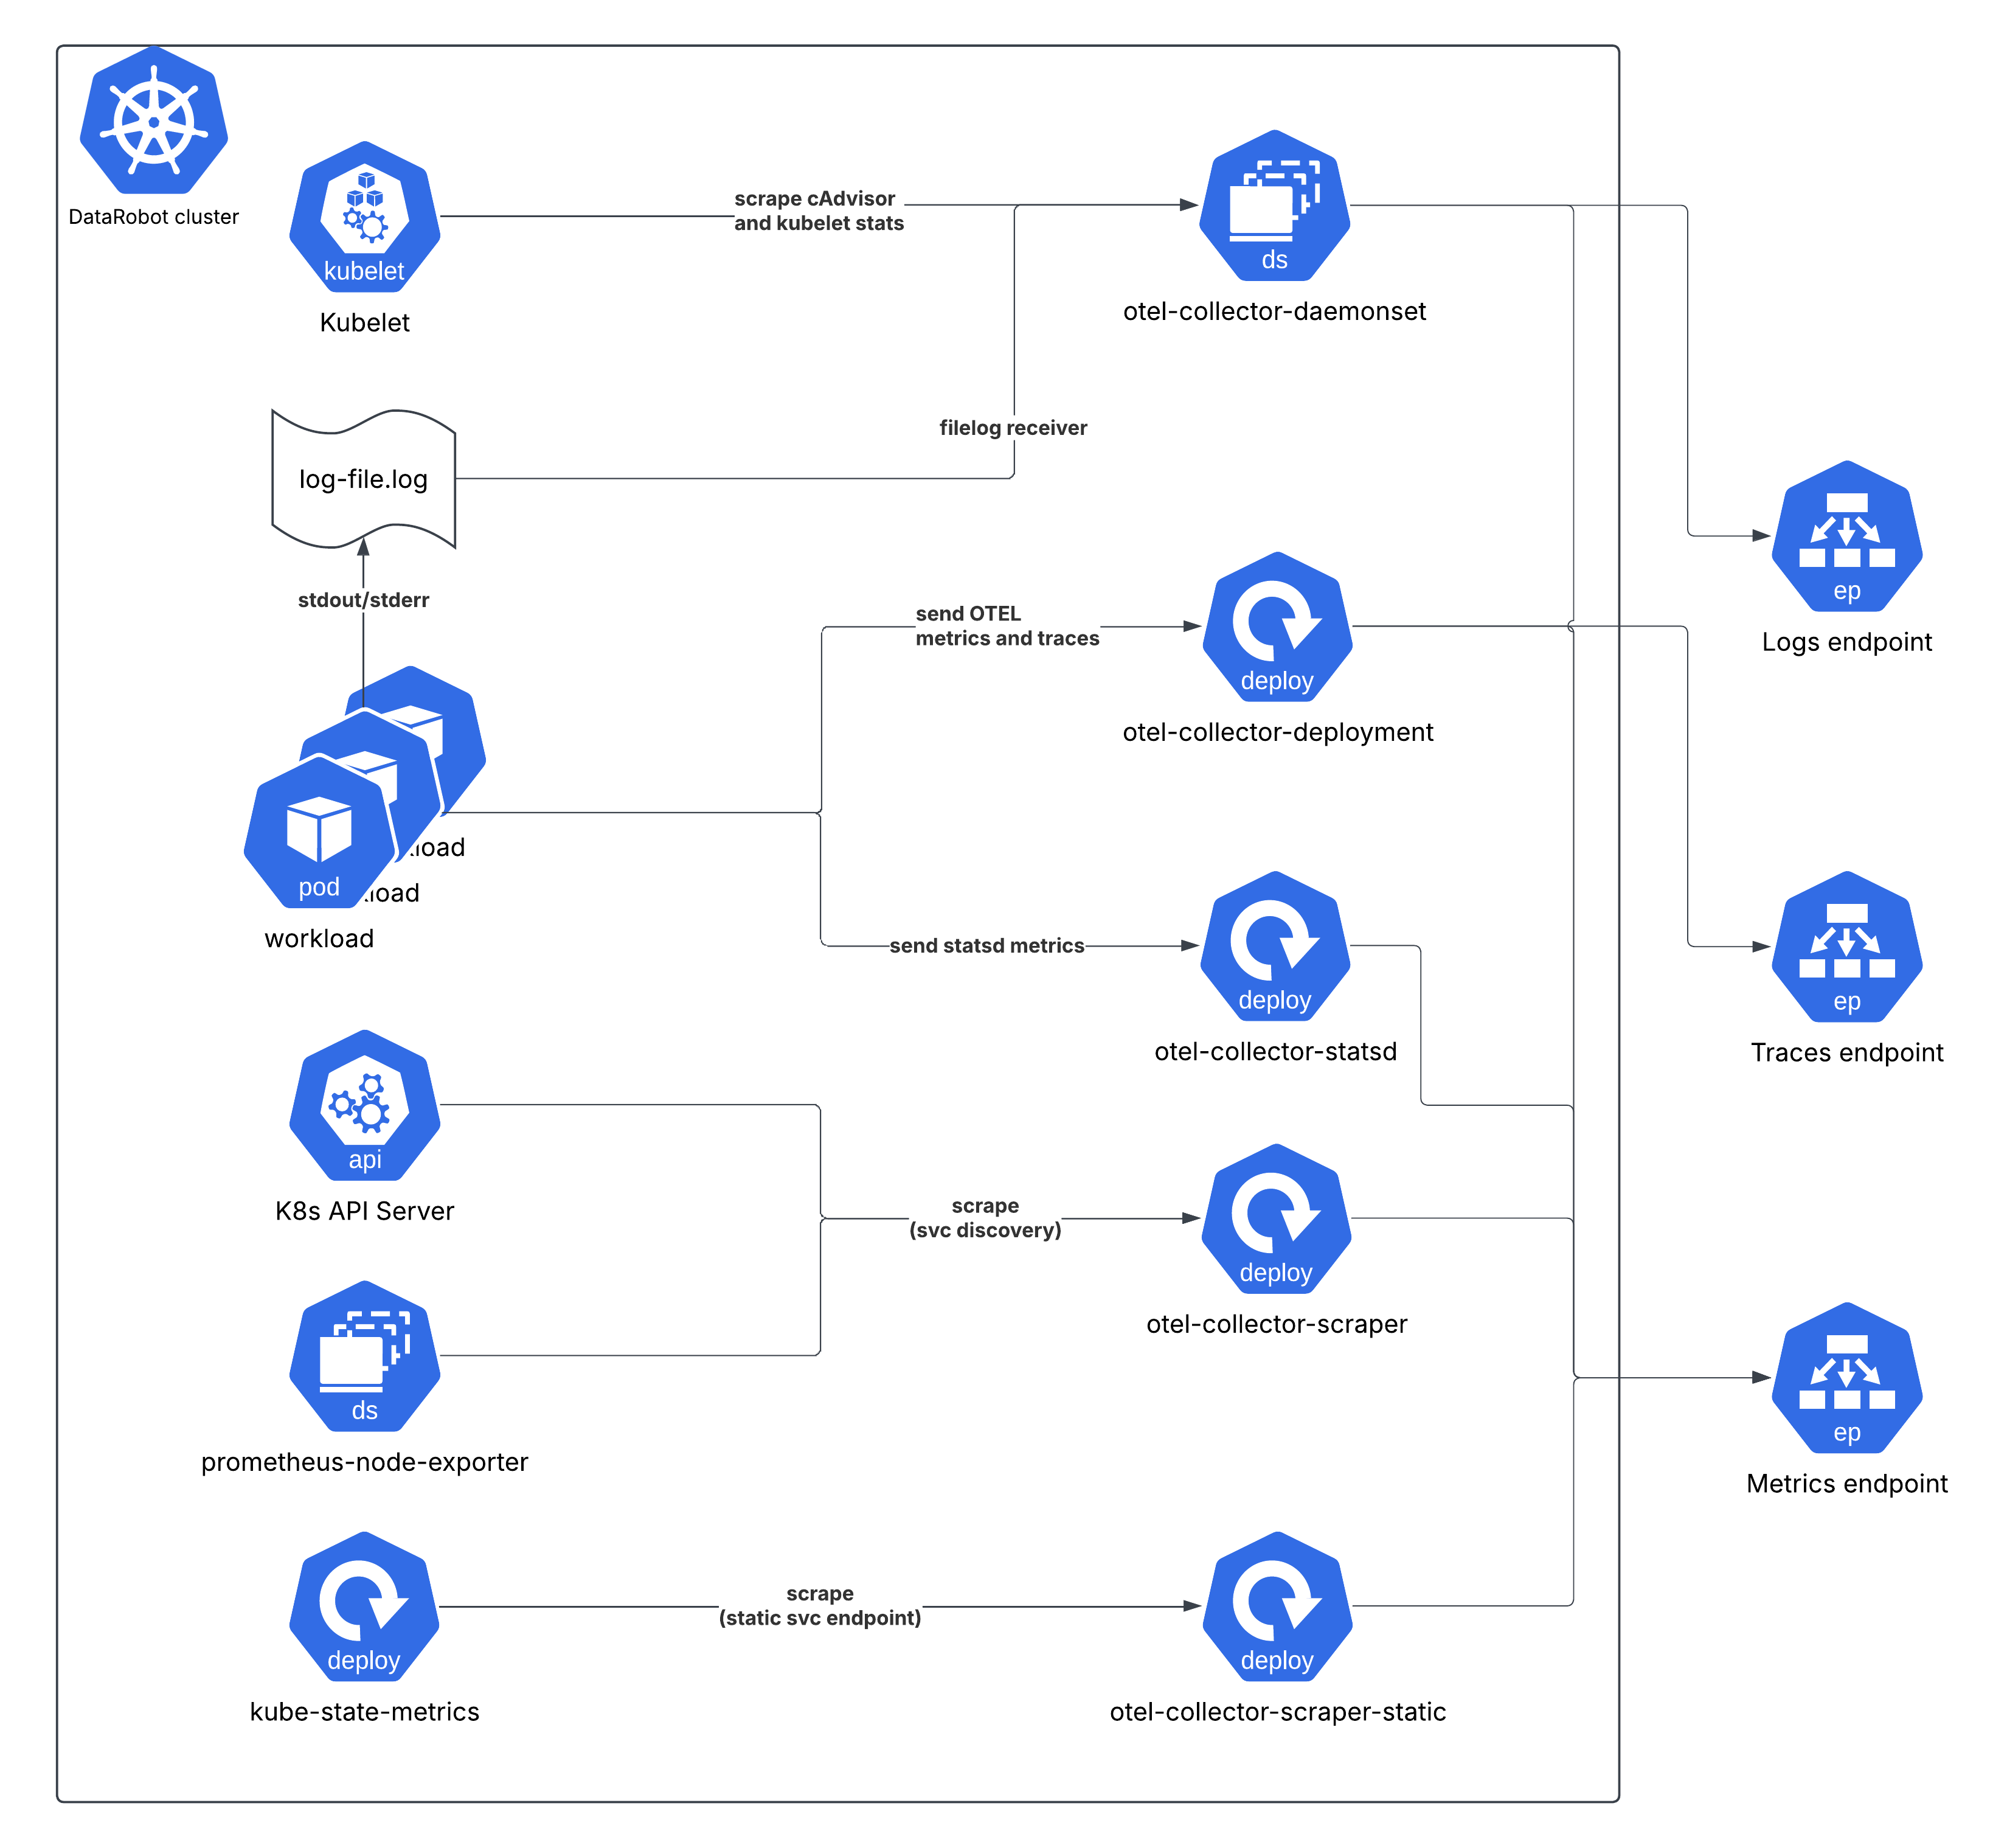
The telemetry generated by the workloads (i.e. explicitly by the application
code) are either sent to the opentelemetry-collector-deployment service
endpoint (OTEL traces and metrics), opentelemetry-collector-statsd (statsd
metrics), or indirectly collected by the opentelemetry-collector-daemonset by
tailing log files for log entries output to stdout/stderr.
Cluster level metrics (cAdvisor, kube-state-metrics, node exporter, kubelet stats) are scraped on interval by other collector instances.
Priority classes
The two sets of daemonsets (opentelemetry-collector-daemonset and
prometheus-node-exporter) have the priorityClassName:
"system-cluster-critical" assigned. This ensures these Pods have guaranteed
priority over all standard workloads in the cluster (those with no class
assigned or a lower custom value) for scheduling (prioritized by the scheduler)
or eviction (resistant to being evicted during resource pressure on the node).
This high priority is necessary because these agents are the definitive source of cluster health and status data. If the monitoring is compromised, the ability to diagnose any potential cluster issue is lost.
Refer also to kubernetes docs on PriorityClass
Cluster roles
In order to observe the cluster, it's required to define cluster roles and bind them to the collectors/metrics exposing services (kube-state-metrics and node exporter). This section shows a breakdown of the roles for each instance.
opentelemetry-collector-daemonset
ClusterRole Name: otel-collector
| API Group(s) | Resources | Verbs (Permissions) |
|---|---|---|
"" (Core) |
nodes, nodes/proxy, nodes/metrics, nodes/spec, services, endpoints, pods, pods/status, replicationcontrollers, replicationcontrollers/status, resourcequotas, events, namespaces, namespaces/status |
get, list, watch |
apps |
daemonsets, deployments, replicasets, statefulsets |
get, list, watch |
extensions |
daemonsets, deployments, replicasets |
get, list, watch |
batch |
jobs, cronjobs |
get, list, watch |
autoscaling |
horizontalpodautoscalers |
get, list, watch |
opentelemetry-collector-scraper
ClusterRole Name: otel-collector-scraper
| API Group(s) | Resources | Verbs (Permissions) |
|---|---|---|
"" (Core) |
nodes, nodes/proxy, nodes/metrics, nodes/spec, services, endpoints, pods, pods/status, replicationcontrollers, replicationcontrollers/status, resourcequotas, events, namespaces, namespaces/status |
get, list, watch |
apps |
daemonsets, deployments, replicasets, statefulsets |
get, list, watch |
extensions |
daemonsets, deployments, replicasets, ingresses |
get, list, watch |
| Non-Resource URLs | /metrics |
get |
opentelemetry-collector-scraper-static
ClusterRole Name: otel-collector-scraper-static
| API Group(s) | Resources | Verbs (Permissions) |
|---|---|---|
"" (Core) |
nodes, nodes/proxy, nodes/metrics, nodes/spec, services, endpoints, pods, pods/status, replicationcontrollers, replicationcontrollers/status, resourcequotas, events, namespaces, namespaces/status |
get, list, watch |
apps |
daemonsets, deployments, replicasets, statefulsets |
get, list, watch |
extensions |
daemonsets, deployments, replicasets, ingresses |
get, list, watch |
| Non-Resource URLs | /metrics |
get |
kube-state-metrics
| Resources (and API Group) | Non-Resource URLs | Resource Names | Verbs (Permissions) |
|---|---|---|---|
namespaces |
[] |
[] |
list, watch |
nodes |
[] |
[] |
list, watch |
persistentvolumeclaims |
[] |
[] |
list, watch |
persistentvolumes |
[] |
[] |
list, watch |
pods |
[] |
[] |
list, watch |
secrets |
[] |
[] |
list, watch |
services |
[] |
[] |
list, watch |
daemonsets.apps |
[] |
[] |
list, watch |
deployments.apps |
[] |
[] |
list, watch |
statefulsets.apps |
[] |
[] |
list, watch |
horizontalpodautoscalers.autoscaling |
[] |
[] |
list, watch |
jobs.batch |
[] |
[] |
list, watch |
daemonsets.extensions |
[] |
[] |
list, watch |
deployments.extensions |
[] |
[] |
list, watch |
ingresses.extensions |
[] |
[] |
list, watch |
ingresses.networking.k8s.io |
[] |
[] |
list, watch |
Configuring observability backends
The observability subchart provides a unified, signal-based interface for configuring where telemetry data is exported. Instead of configuring each collector instance individually, you define your exporters and assign them to signals (logs, metrics, traces) once, and the chart automatically routes the configuration to the appropriate collectors.
All observability configuration is defined under global.observability in
the datarobot-prime chart values. Because the OpenTelemetry collectors are
subcharts of datarobot-observability-core, which is itself a subchart of
datarobot-prime, the configuration must be defined as global values so it
can reach all chart layers.
Note
The datarobot-observability-core subchart disabled by default in the
datarobot-prime parent chart, so it needs to be enabled by setting
datarobot-observability-core.enabled: true (see below)
Configuration structure
The interface is structured as follows:
global:
  observability:
    # Exporter definitions (native OTEL exporter configs)
    exporters:
      <exporter-name>:
        <native OTEL exporter configuration>

    # Optional: processor definitions
    processors:
      <processor-name>:
        <native OTEL processor configuration>

    # Signal routing: which exporters/processors handle each signal
    signals:
      logs:
        exporters: [<exporter-names>]
        processors: [<processor-names>]
      metrics:
        exporters: [<exporter-names>]
        processors: [<processor-names>]
      traces:
        exporters: [<exporter-names>]
        processors: [<processor-names>]

    # Cloud provider authentication (auto-injects extensions and serviceAccount
    # annotations)
    auth:
      aws:
        enabled: false
        roleArn: ""
        region: ""
      azure:
        enabled: false
        clientId: ""
      gcp:
        enabled: false
        serviceAccount: ""
        project: ""

    # Secret references (injected as env vars to all collectors)
    secrets:
      - envVar: <ENV_VAR_NAME>
        secretName: <k8s-secret-name>
        secretKey: <key-in-secret>

    # Optional: OTEL connectors (e.g., Datadog APM metrics)
    connectors: {}

    # Optional: additional OTEL extensions
    extensions: {}

    # Optional: shared exporter defaults (sending queue, retry)
    defaults:
      sendingQueue:
        enabled: true
        queueSize: 10000
      retry:
        enabled: true
        initialInterval: 5s
        maxInterval: 30s
        maxElapsedTime: 5m

# The subchart needs to be enabled
datarobot-observability-core:
  enabled: true
Key points:
- Exporters use the native OpenTelemetry exporter configuration. Refer to the OpenTelemetry documentation for the specific exporter you are configuring.
- Signals assign exporters (and optionally processors) to each signal type. Each signal can use different exporters, enabling loose coupling (e.g., Splunk for logs, Prometheus for metrics).
- Auth auto-injects the required serviceAccount annotations and OTEL
extensions for cloud provider authentication. For example, setting
auth.aws.enabled: trueautomatically adds theeks.amazonaws.com/role-arnannotation to all collector serviceAccounts and injects thesigv4authextension. - Secrets are injected as environment variables to every collector pod.
Exporters reference them using OTEL's
${env:VAR_NAME}syntax.
Extending pipelines with custom processors
Custom processors can be added to extend the OTEL pipelines, for example to add a custom attribute, metric transformer, resource detector, etc.
Processors are defined under global.observability.processors and then
assigned to the desired signals under global.observability.signals. The chart
automatically injects them into the correct pipeline for each collector.
In the following example, a processor that adds a custom attribute is defined and then assigned to the logs and traces signals (leaving metrics unprocessed):
global:
  observability:
    processors:
      attributes/add_custom_attribute:
        actions:
          - key: "custom_attribute"
            action: insert
            value: "custom_value"

    exporters:
      # ... exporter config (see provider-specific page)

    signals:
      logs:
        exporters: [awscloudwatchlogs]
        processors: [attributes/add_custom_attribute]
      metrics:
        exporters: [prometheusremotewrite]
      traces:
        exporters: [awsxray]
        processors: [attributes/add_custom_attribute]
Processors use the native OpenTelemetry processor configuration. Refer to the OpenTelemetry documentation for the specific processor you are configuring.
Complete exporter configuration examples
Because the interface is signal-based and decoupled from any specific backend, any OpenTelemetry exporter can be used for any signal, in any combination. For example, you could export logs to Splunk, metrics to Prometheus, and traces to Datadog - or send all three signals to the same OTLP endpoint. The chart imposes no constraints on how exporters are combined; as long as the exporter is supported by the OpenTelemetry collector, it can be configured here.
The following pages provide complete, ready-to-use examples for common setups, including any infrastructure provisioning or authentication steps specific to that environment. These are starting points, not the only valid configurations.
Hyperscaler managed services
- AWS CloudWatch/X-Ray/Prometheus/Grafana
- Azure Monitor/Managed Prometheus and Grafana
- Google Cloud Monitoring
Observability vendors
Additional configuration
Configuration that is not backend specific (application-level instrumentation, helm tests, daemonset tuning, node groups, Grafana dashboards) can be found here.