使用状況エクスプローラー
The Usage explorer provides users visibility into graphics processing unit (GPU), central processing unit (CPU), large language model (LLM) API usage, agentic spans, and storage usage across the platform, providing general usage information broken down by service. There are two categories for LLM usage: LLM-DR hosted and LLM-BYOK (bring your own key).
This section describes the Usage explorer in Account settings—for documentation specific to the Tenant usage explorer in Admin settings, see Tenant usage explorer.
Usage explorer services
The following services are tracked in the Usage explorer, although displayed services vary depending on the type of usage being viewed.
- エージェントオブザーバビリティ
- カスタム推論モデル
- カスタムジョブ
- カスタムモデルNIM
- カスタムモデル
- カスタムタスクフィット
- データ管理
- GenAIのプレイグラウンド
- Memory Service
- モデルマネジメント {: #model-management }
- モデリング
- モデレーション
- NVIDIA AI Enterprise
- ノートブック
- OCR
- 予測値
- 予測オブザーバビリティ
- セグメンテーション
- Sparkデータ準備
- ベクターデータベースの作成
To access the Usage explorer, open Account settings > Usage explorer. ここから、指定した日付範囲におけるサービス別のリソース使用状況を確認できます。また、レポートを.csvファイルとしてエクスポートすることも可能です。
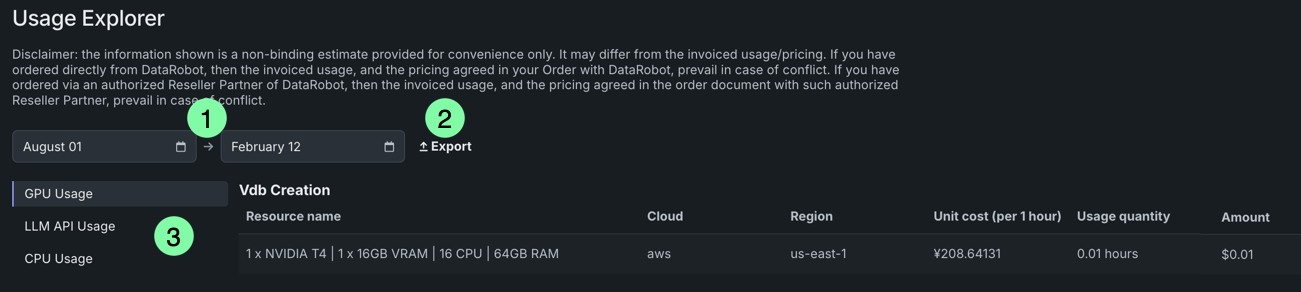
| 要素 | 説明 | |
|---|---|---|
| 1 | 日付範囲セレクター | 2つのフィールドを使用して、特定の日付範囲における使用情報を表示します。 |
| 2 | エクスポート | レポートを.csvファイルとしてダウンロードします。 |
| 3 | 使用状況に関するオプション | 表示したい使用状況の情報(GPU、LLM、CPU、エージェントスパン、またはストレージ)を選択します。 |
GPUの使用状況
GPUの使用状況ページでは、GPUの利用に関するデータを報告し、一般的な使用情報をサービス別に提供します。 たとえば、GenAIの機能は、LLMのトレーニング、ホスティング、推論の実行に関連するさまざまなワークロードにおいて、GPUハードウェアに依存しています。
Click GPU Usage in the Usage explorer to view a table that displays the name of the service using the resources, as well as the following details about each task under that service:
| フィールド | サマリー |
|---|---|
| サービス | GPUを使用したサービス(例:ノートブック、モデリング、ベクターデータベースの作成など)。 |
| リソース名 | タスクで使用されたGPUの数、CPUの数、RAM/VRAMの量。 |
| クラウド | リソースを実行しているクラウドプロバイダー。 |
| 地域 | コストが計算されるリージョン。 |
| 単価(1時間あたり) | リソースの1時間あたりの総コスト。 |
| 使用量 | 指定の期間内に各タスクがリソースを使用した時間。 |
| 金額 | タスクの現在のコスト。 |
LLM APIの使用状況
The LLM API Usage page reports data on which LLM models are being used by which services, as well as how much each model is using. This page breaks down usage information by service, tracking token consumption for each task. この詳細な監視は、さまざまなサービスの中で、LLMリソースを最も消費しているサービスを特定するのに役立ちます。
Single-tenant SaaS users
For increased transparency, the LLM API Usage page has been broken out into two separate pages: LLM DR-hosted and LLM-BYOK (bring your own model).
Click LLM API Usage in the Usage explorer to view a table that displays the name of the service using the resources, as well as the following details about each task under that service:
| フィールド | サマリー |
|---|---|
| サービス | LLM APIを使用したサービス(カスタムモデル、GenAIプレイグラウンドなど)。 |
| リソース名 | API経由で呼び出されるLLMモデルの名前。 |
| クラウド | リソースを実行しているクラウドプロバイダー。 |
| 地域 | コストが計算されるリージョン。 |
| 単価(1時間あたり) | リソースの1時間あたりの総コスト。 |
| 使用量 | タスクが使用したトークンの数。 |
| 金額 | タスクの現在のコスト。 |
DataRobot hosted LLMs
本機能の提供について
The DataRobot-hosted LLMs usage report (LLM - DR) is only available for Single-tenant SaaS deployments.
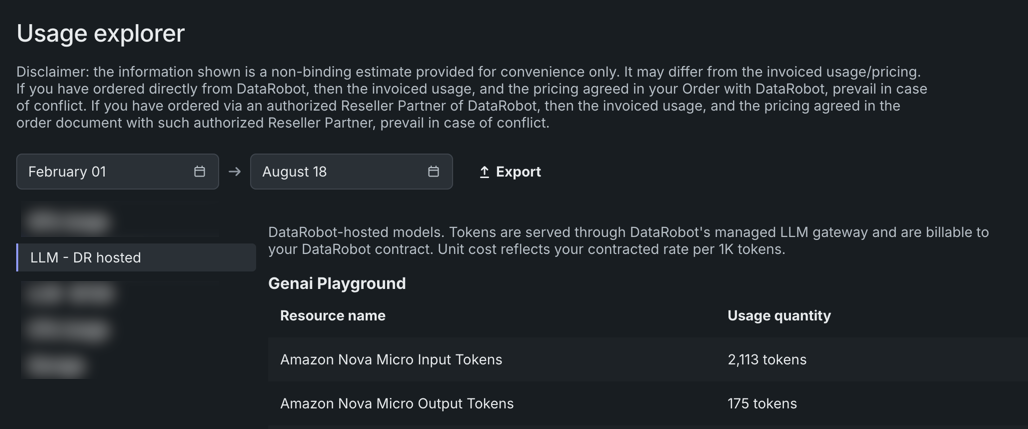
The LLM - DR hosted page reports usage on those LLMs DataRobot hosts; these are the LLMs that DataRobot's own provider access is applied.
LLM BYOK (bring-your-own-key)
本機能の提供について
The LLM bring-your-own-key usage report (LLM - BYOK) is only available for Single-tenant SaaS deployments.
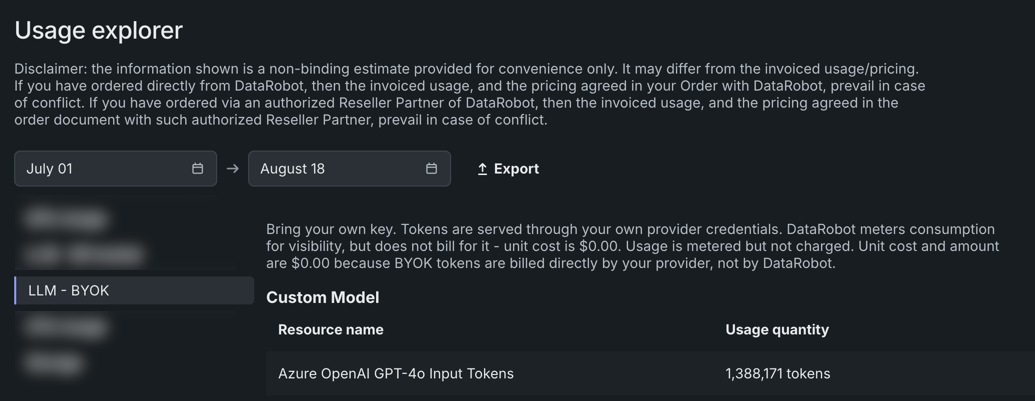
The LLM-BYOK hosted (bring your own key) page reports usage where you supply your own LLM provider key/credentials (e.g., through an OpenAI/Azure/Anthropic account) rather than using hosted access provided by DataRobot.
CPU使用率
The CPU Usage page provides an overview of CPU use, broken down by service. これにより、どのユーザーやサービスがCPUリソースを最も消費しているかを簡単に監視でき、最適化が必要な領域や予算上の懸念事項の特定に役立つ可能性があります。
Click CPU Usage in the Usage explorer to view a table that displays the name of the service using the resources, as well as the following details about each task under that service:
| フィールド | サマリー |
|---|---|
| サービス | CPUを使用したサービス(例:カスタム推論モデル、データ管理など) |
| リソース名 | タスクが使用したプロセッサーの数とRAMの量。 |
| クラウド | リソースを実行しているクラウドプロバイダー。 |
| 地域 | コストが計算されるリージョン。 |
| 単価(1時間あたり) | リソースの1時間あたりの総コスト。 |
| 使用量 | 各タスクがCPUを使用した時間。 |
| 金額 | タスクの現在のコスト。 |
エージェントスパンの使用状況
エージェントスパンのページでは、プラットフォーム全体におけるエージェントスパンの使用状況の概要が表示されます。
Click Agentic Spans in the Usage explorer to view a table that displays the name of the agentic span, as well as the following details about each span:
| フィールド | サマリー |
|---|---|
| サービス | スパンを使用したサービス(例:エージェントオブザーバビリティ)。 |
| リソース名 | 使用されたエージェントスパンの名前。 |
| クラウド | リソースを実行しているクラウドプロバイダー。 |
| 地域 | コストが計算されるリージョン。 |
| 単価(1000スパンあたり) | 1000スパンごとのリソースの総コスト。 |
| 使用量 | 使用されたスパンの総数。 |
| 金額 | 現在の使用コスト。 |
ストレージの使用状況
ストレージページでは、プラットフォーム全体のストレージ使用状況の概要を確認できます。
Click Storage in the Usage explorer to view a table that displays the name of the storage, as well as the following details about each storage:
| フィールド | サマリー |
|---|---|
| サービス | ストレージリソースを使用したサービス(例:予測オブザーバビリティ)。 |
| リソース名 | 使用されたストレージリソースの名前。 |
| クラウド | リソースを実行しているクラウドプロバイダー。 |
| 地域 | コストが計算されるリージョン。 |
| 単価(1ギガバイトあたり) | 1ギガバイトごとのリソースの総コスト。 |
| 使用量 | 使用されたストレージの合計容量(ギガバイト単位)。 |
| 金額 | 現在の使用コスト。 |