Monitor
Premium
DataRobot's Agentic AI capabilities are a premium feature; contact your DataRobot representative for enablement information. Try this functionality for yourself in a limited capacity in the DataRobot trial experience.
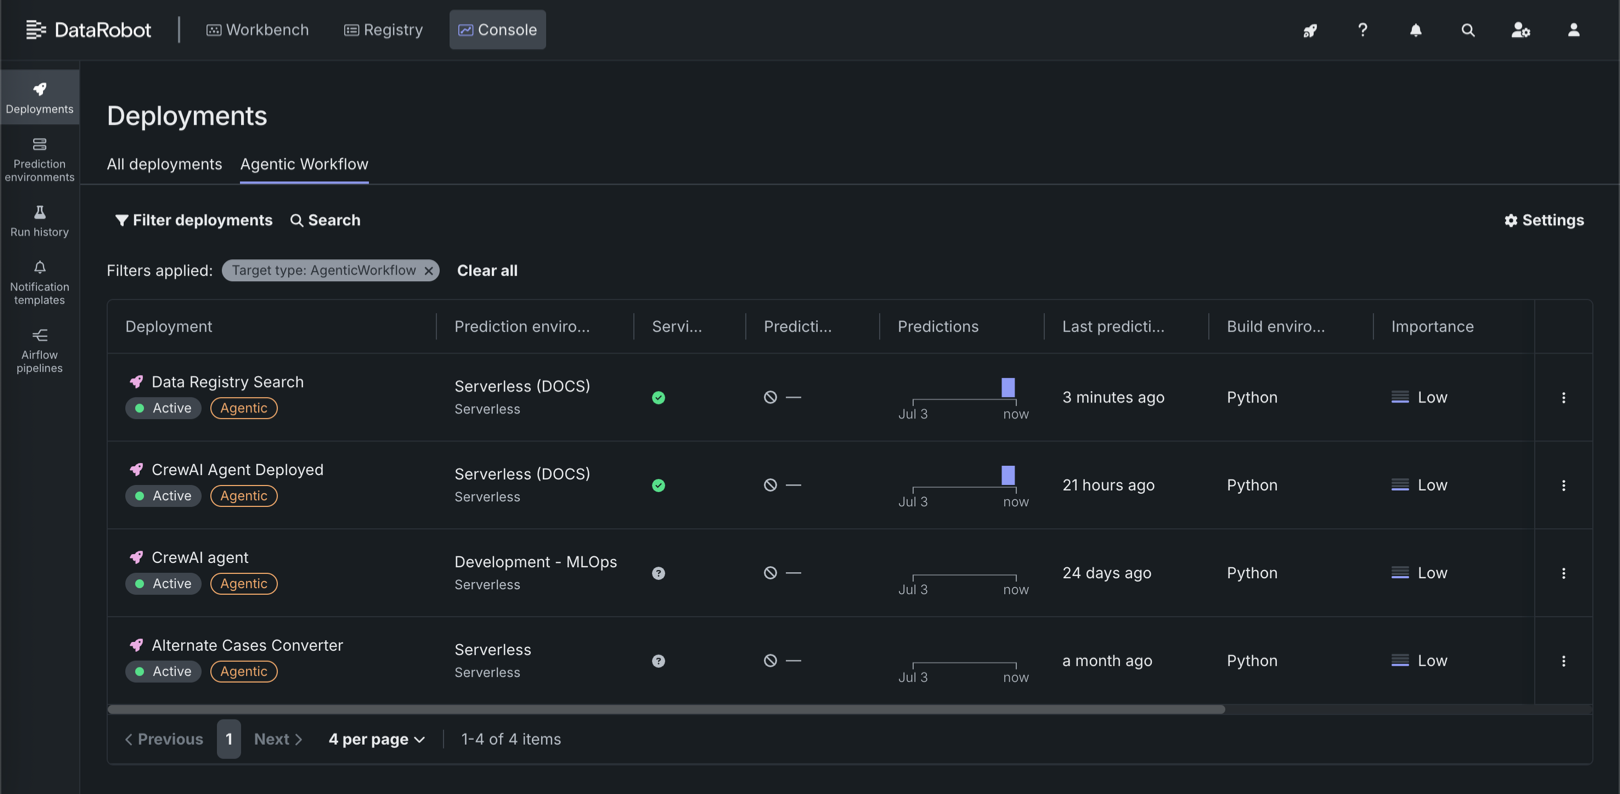
After you've deployed an agentic artifact to Console, monitor the deployment's performance and behavior. In Console, on the Deployments page, click the Agentic Workflow tab to view a list of agentic workflow deployments.
A fully configured agentic workflow deployment has access to the following Console features:
| Feature | Description |
|---|---|
| Overview | |
| Deployment overview | Review deployment details, lineage, tags, runtime parameters, and—when guardrails are configured—evaluation and moderation summary information. |
| Monitoring | |
| Deployment service health | Track model-specific deployment latency, throughput, and error rate. |
| Deployment usage | Track prediction processing progress for use in accuracy, data drift, and predictions over time analysis. For agentic workflow deployments, includes quota usage monitoring segmented by user or agent. |
| Custom metrics | Create and monitor custom business or performance metrics or add pre-made metrics. When you configure evaluation and moderation for the workflow, guard metrics (for example, guard latency and blocked counts) are reported here. |
| Data exploration and tracing | Explore and export stored prediction data, actuals, and training data; assess response quality; and use Tracing to inspect agent traces and timelines. |
| Deployment reports | Generate reports, immediately or on a schedule, to summarize the details of a deployment, such as its owner, how the model was built, the model age, and the humility monitoring status. |
| Resource monitoring | Monitor CPU, memory, and replica utilization for the serverless deployment. |
| OpenTelemetry metrics | Visualize OpenTelemetry metrics from your application alongside DataRobot native metrics. |
| Predictions | |
| Prediction API snippets | Use downloadable snippets to call the deployment's prediction and chat completion APIs from your application (including real-time scoring integrations). |
| Activity log | |
| Standard output logs | View runtime logs from the custom model container to debug scoring and request failures. |
| OpenTelemetry logs | View OpenTelemetry log events for troubleshooting and deeper analysis (span-related logs can also be filtered from Data exploration). |
| Moderation events | When evaluation and moderation guardrails are enabled, review guard-related events to diagnose blocked requests and guard failures. |