How-to: Deploy and govern
This walkthrough shows you how to use DataRobot to predict airline take-off delays of 30 minutes or more. You can learn more about the use case here. You will:
- Register a model.
- Create a deployment.
- Make predictions.
- Review monitoring metrics.
Prerequisites
To deploy and monitor your models, first either:
- Complete the model building walkthrough to create models.
- Open an existing experiment Leaderboard to start the registration process.
1. Register a model
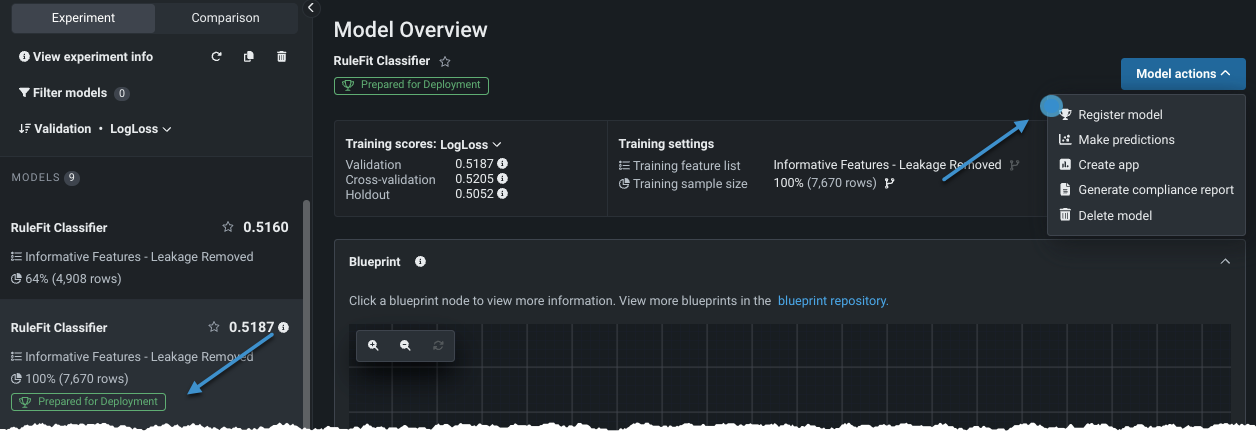
Registering models allows you to create a single source of truth for your entire AI landscape. For example, you can use model versioning to create a model management experience organized by problem type. To register a model, select it on the Leaderboard and choose Model actions > Register model. (The model that is prepared for deployment is a good choice for the walkthrough.)
Read more: DataRobot Registry
2. Configure registration details
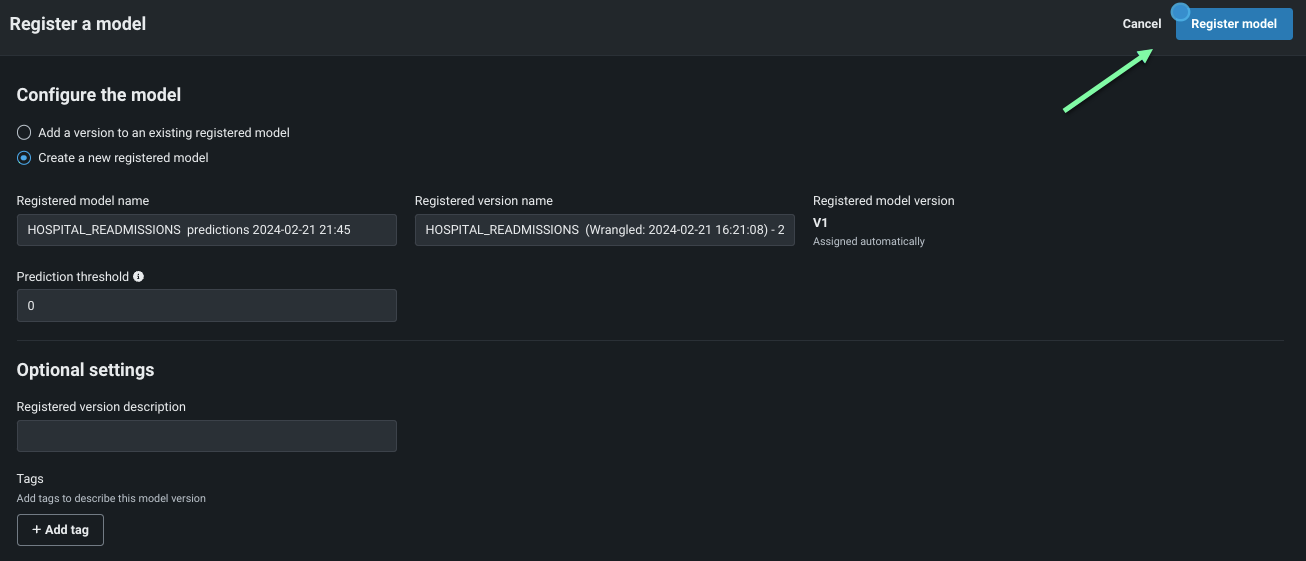
When registering a model, you specify whether to register it as a new model or a version of an existing registered model. For this walkthrough, register as a new model, optionally add a description, and click Register model.
Read more: Register DataRobot models
3. Start deployment creation
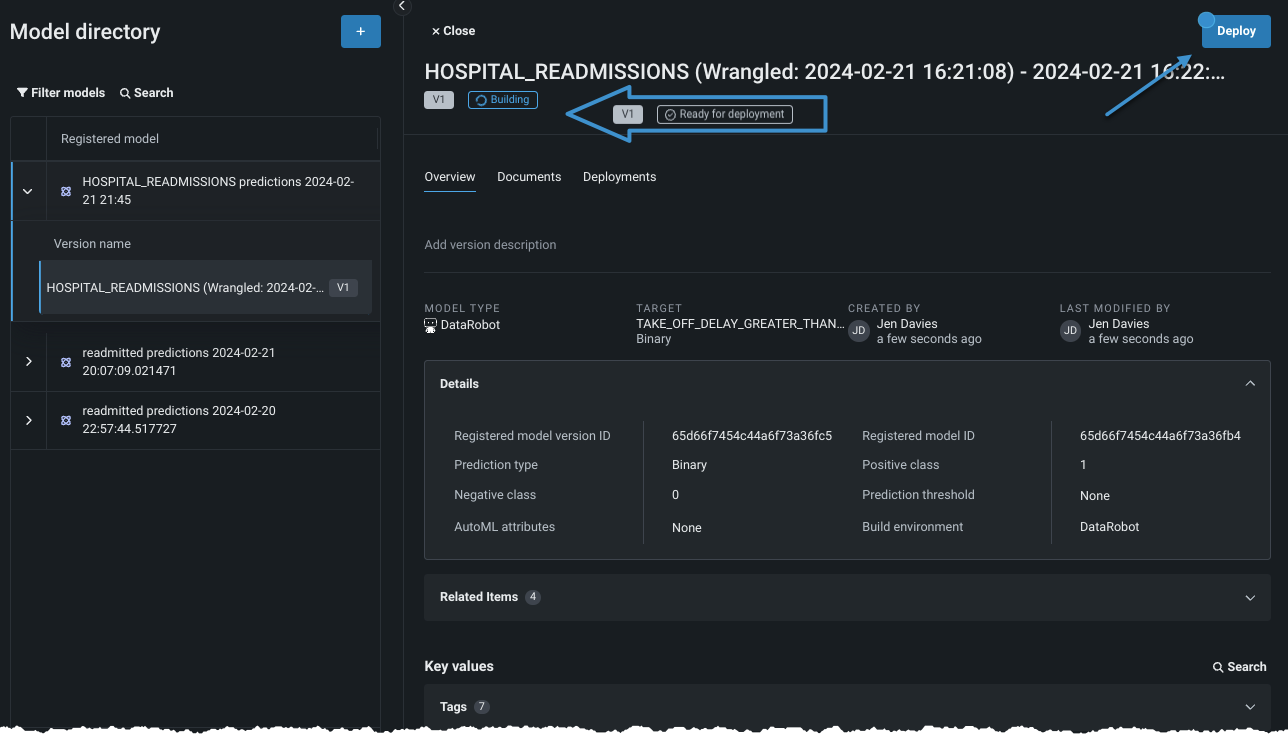
While the registration process is ongoing, you can explore the lineage and metadata that DataRobot displays. This information is crucial for traceability. Click Deploy to proceed.
Read more: Deploy a model from Registry
4. Configure the deployment
Prediction environments provide deployment governance by letting you control accessibility based on where the predictions are being made. Set an environment from this screen (an environment has been created for this trial).
You can configure monitoring capabilities, including data drift (on by default), accuracy, fairness, and others by clicking Show advanced options. To continue, click Deploy model to create the deployment.
Read more: Configure advanced options
5. Create the deployment
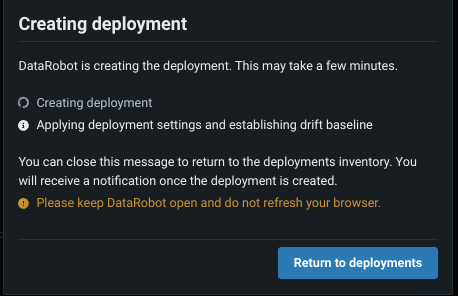
DataRobot provides a status message as it applies your settings and establishes a data drift baseline for monitoring as it creates the deployment. The baseline is the basis of the Data Drift dashboard, which helps you analyze a model’s performance after it has been deployed. Once the deployment is ready, you will automatically be forwarded to the Console overview.
Read more: Console overview
6. Make predictions
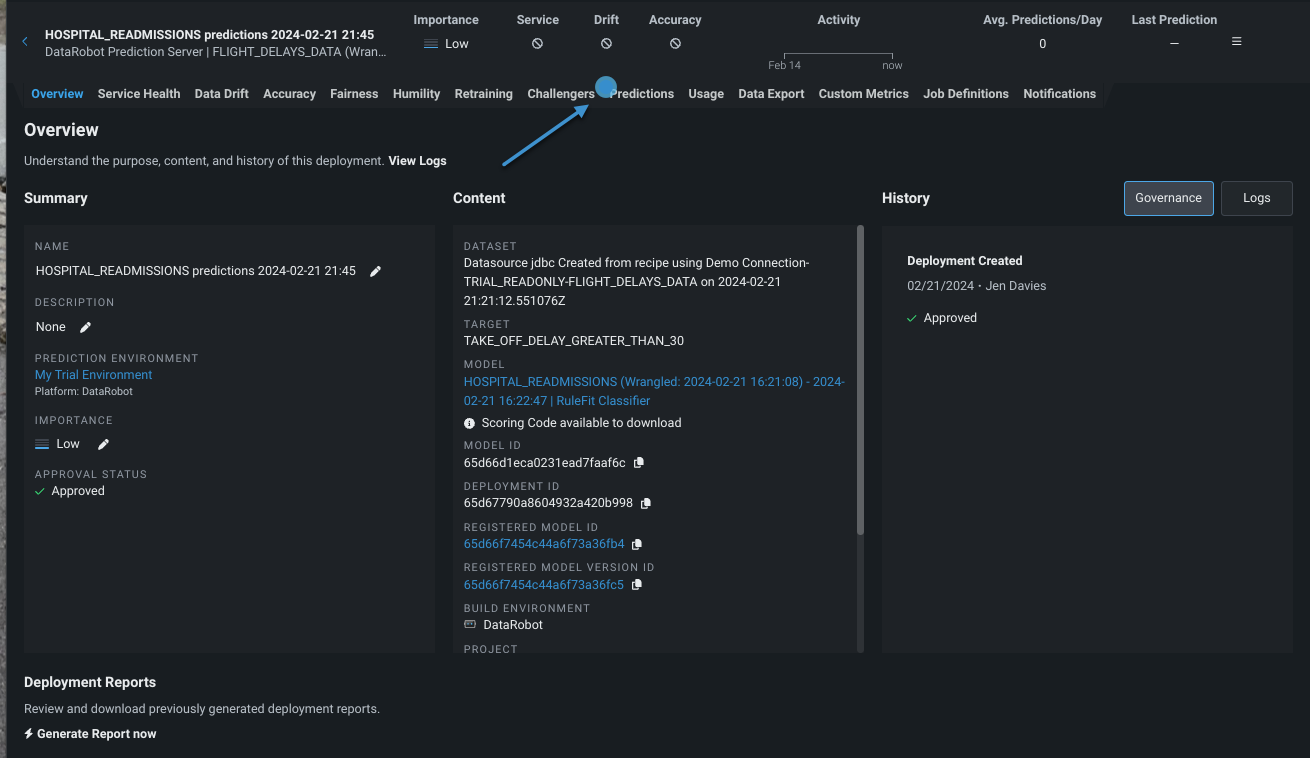
The Console overview provides a wealth of general information about the deployment. The other tabs at the top of the page configure and report on the settings that are critical to deploy, run, monitor, and optimize deployed models. Click the Predictions tab to make a one-time batch prediction.
Read more: Prediction options
7. Upload prediction data
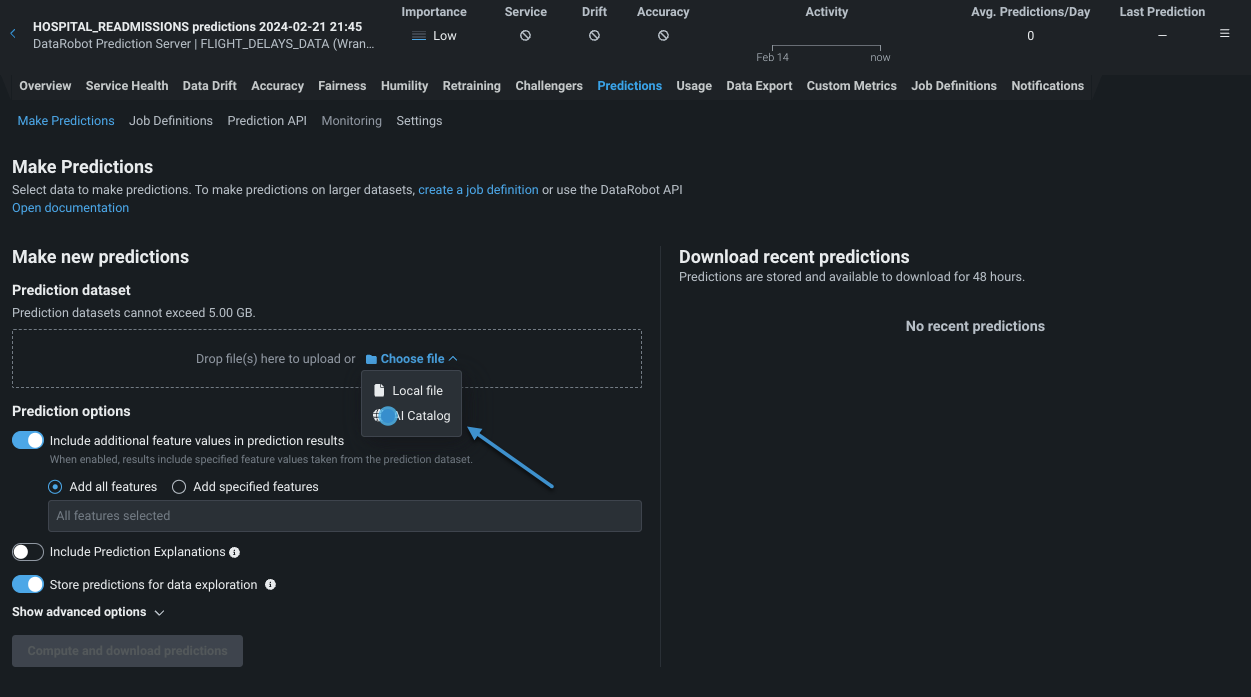
To make a batch prediction, upload a prediction dataset. If you were to upload your own scoring data, it would be automatically stored in the Data Registry. Trial users have a provided dataset that has been pre-registered. Open the Choose file dropdown and select AI Catalog as the upload origin.
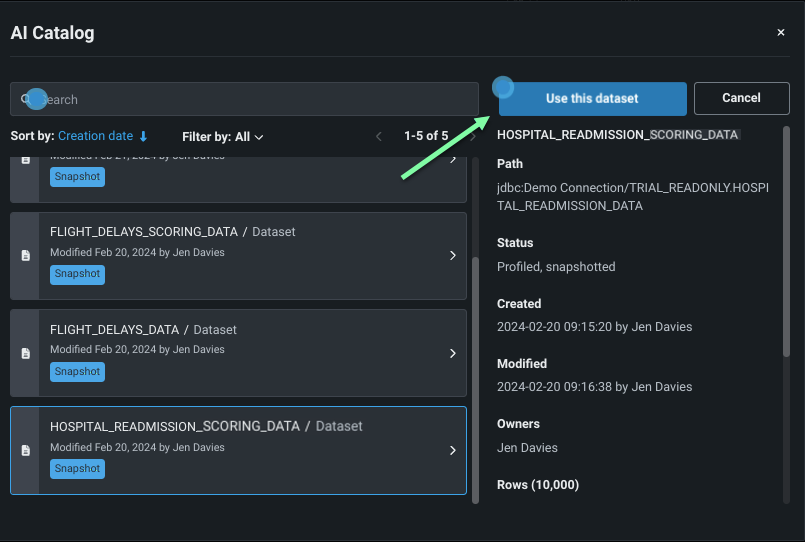
From the catalog, locate and select the prediction dataset HOSPITAL_READMISSIONS_SOCRING_DATA. Click the dataset to select it, review the dataset metadata, and when ready, click Use this dataset.
Read more: Make one-time predictions
8. Compute predictions
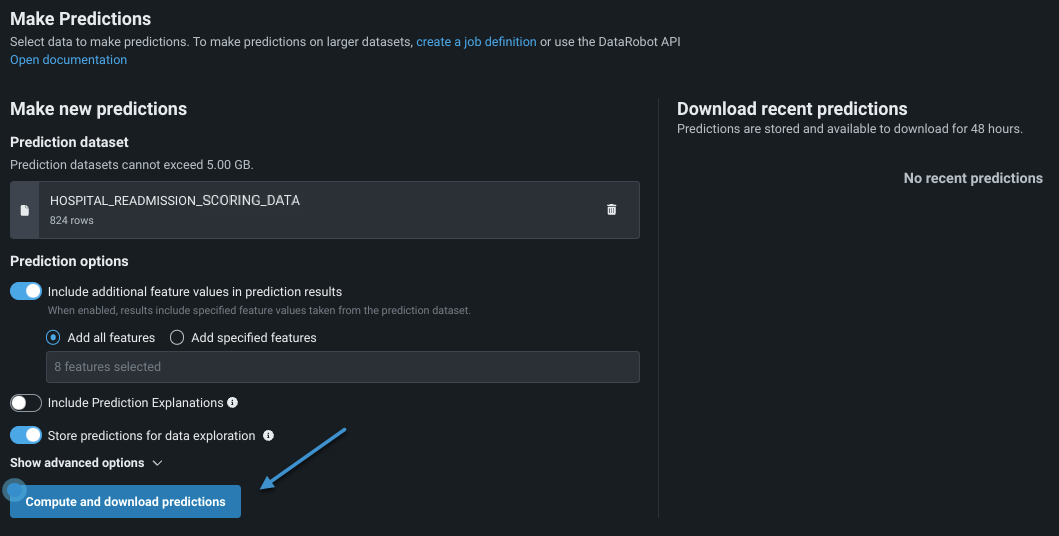
Prediction options, both basic and advanced, allow you to fine-tune model output. Explore the controls, but for this walkthrough, stick with the defaults. Scroll to the bottom of the screen and click Compute and download predictions. After computing, DataRobot lists the entry in the recent predictions section.
Read more: Make predictions from a deployment
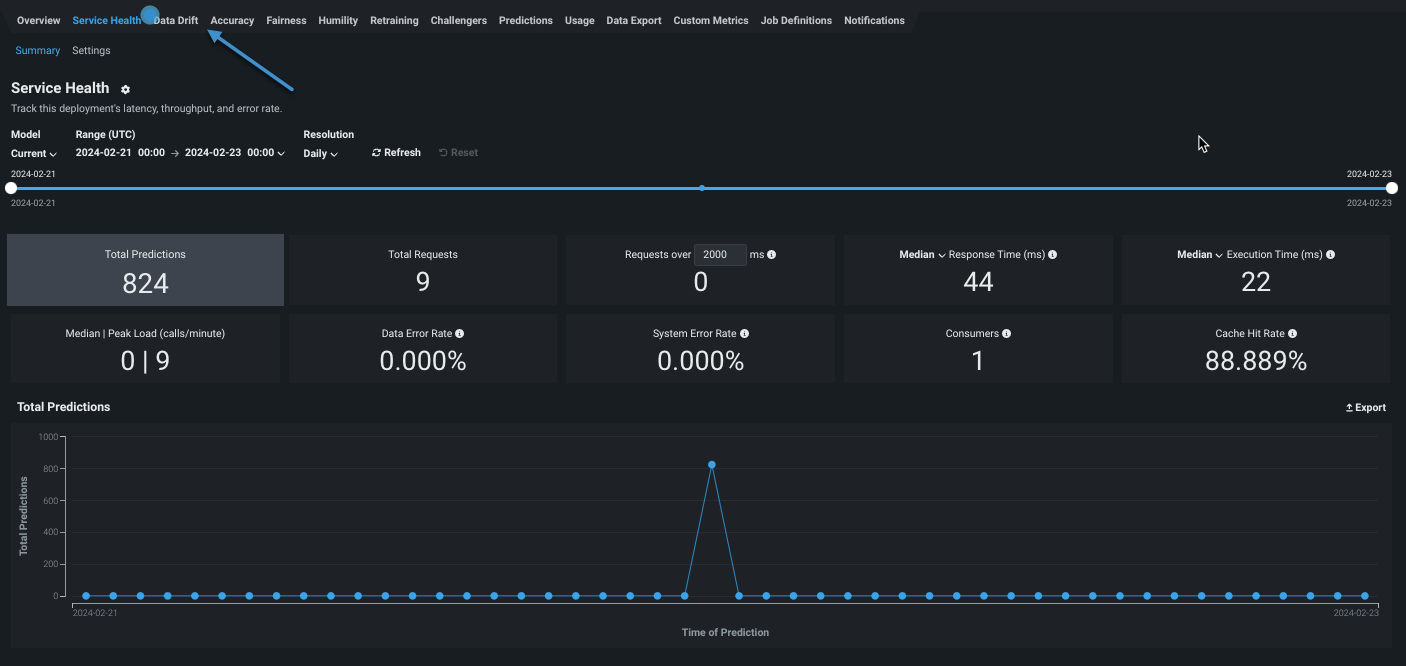
9. Review Service Health
The Service Health tab reports the deployed model’s operational health. Service Health tracks metrics about a deployment’s ability to respond to prediction requests quickly and reliably, helping to identify bottlenecks and assess capacity, which is critical to proper provisioning.
Check total predictions, total requests, response time, and other service health metrics to evaluate model operational health. Then click Data Drift to check model performance.
Read more: Service health
10. Review Data Drift
As real world conditions change, the data distribution of the prediction data drifts away from the baseline set in the training data. By leveraging the training data and prediction data (also known as inference data) that is added to your deployment, the dashboard on Data drift tab helps you analyze a model's performance after it has been deployed.
Read more: Data drift
