How-to: Time series forecasting with code
This walkthrough, a continuation of part 1, showcases a car sales forecasting example to learn about DataRobot time series. Watch the full video of this use case on YouTube.
The dataset includes month-by-month sales for many makes and models of vehicles. You will create an experiment and build models in the UI and then import a Jupyter-formatted notebook to view more detailed segment analysis using DataRobot insights.
Before proceeding with the workflow, review the [API quickstart guide]api-quickstart{ target=_blank } to get familiar with common API tasks and configuration.
Assets for download
Download the following car sales-related assets—a shorter version of the data (FAST), a fuller version with more segments (_Segments) and a Python notebook (_Model_Factory.ipynb):
1: Upload the notebook
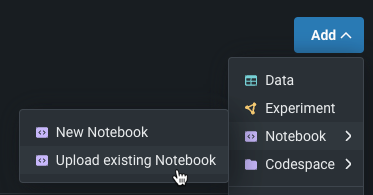
From the Notebooks tab of the Use Case folder, select Upload Notebook and navigate to the notebook file that provided with this walkthrough. Then click Import.
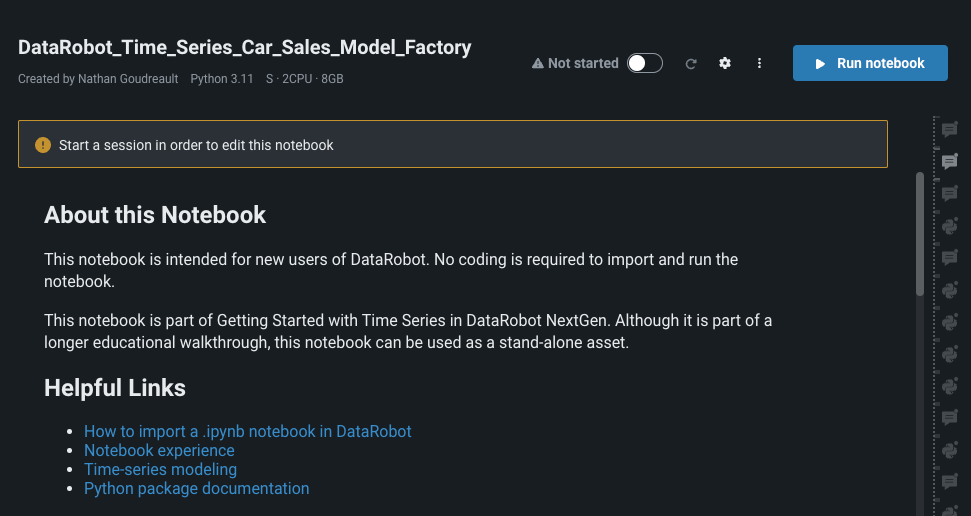
Once uploaded, the accelerator will open in DataRobot Notebooks as part of the Use Case.
Read more:
2: Configure the notebook environment
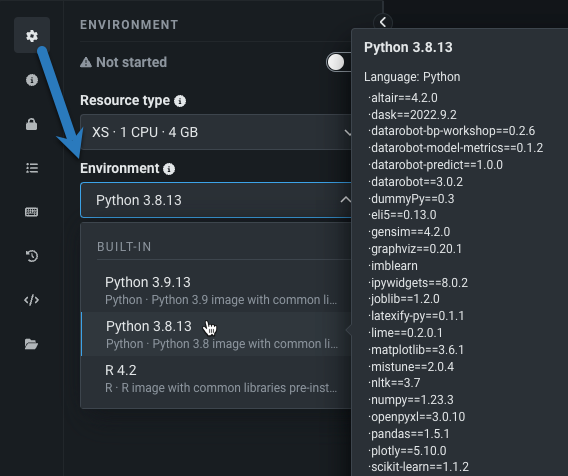
To edit, create, or run the code in the accelerator, you must first configure and then run the notebook environment. The environment image determines the coding language, dependencies, and open-source libraries used in the notebook. To see the list of all packages available in the image, hover over it in the Environment tab:
Review the available environments, and, for this walkthrough, select the Python 3.9.18 image and select the default environment settings.
Read more: Notebook environment management
3: Run the environment
To begin working with the accelerator, start the environment by toggling it on in the toolbar.
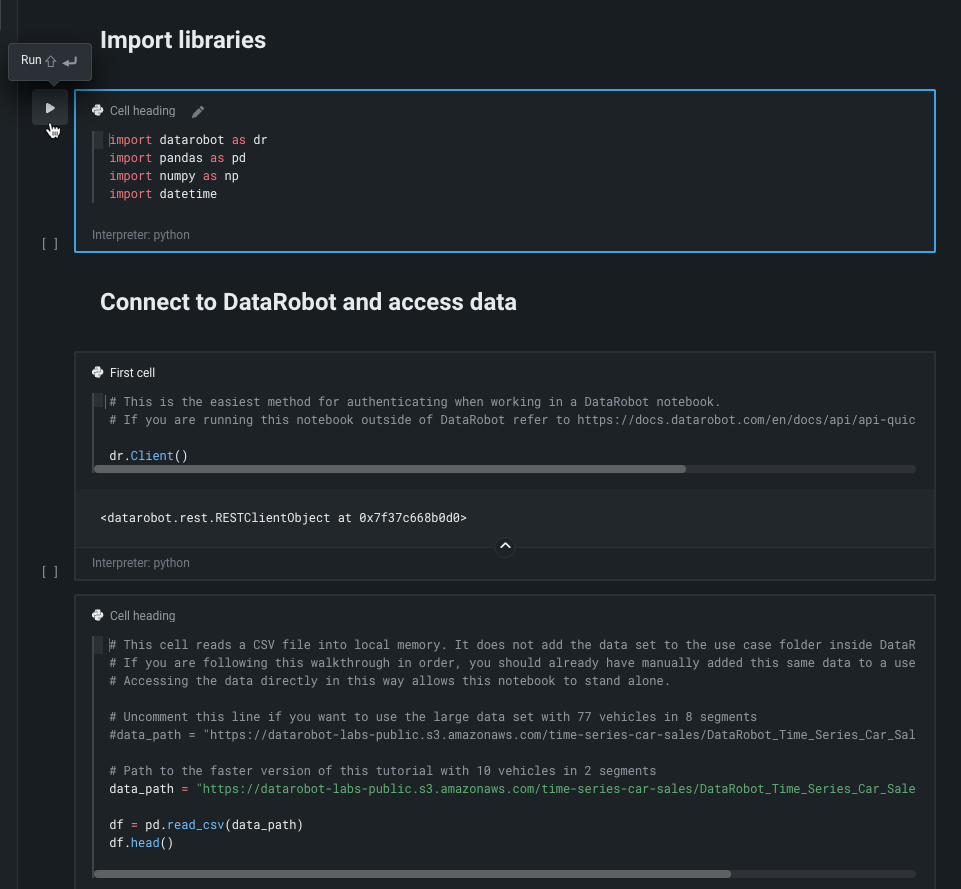
Wait a moment for the environment to initialize, and once it displays the Started status, you can begin executing code. To execute code, select the play button next to a cell.
Read more: Create and execute cells documentation
4: Import libraries and data
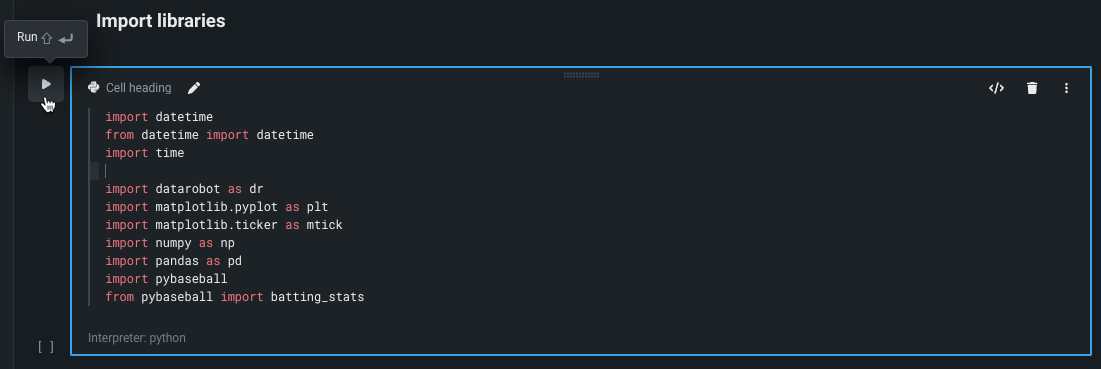
With the environment running, run the cells to import the required libraries, connect to DataRobot, and import the dataset. This walkthrough uses the fast version of the dataset, containing fewer vehicles and segments. To use a dataset with all vehicles, uncomment and use the alternative dataset path provided in the cell instead.
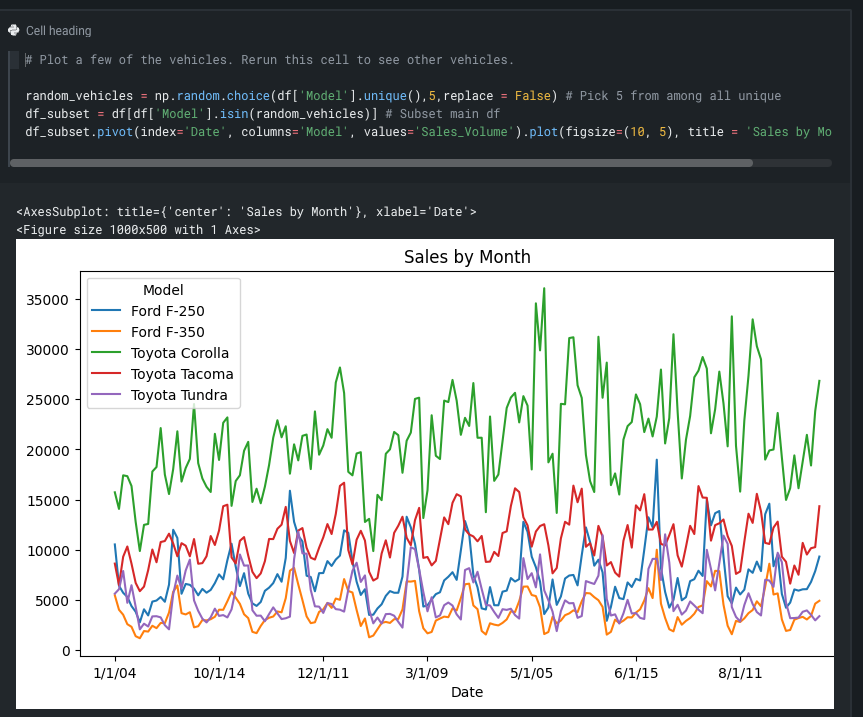
After importing the data, reviewing the contents of the Pandas Dataframe. The proceeding cell selects five of the ten vehicle segments at random and plots them to display the shape of the data.
5: Configure the time series experiment
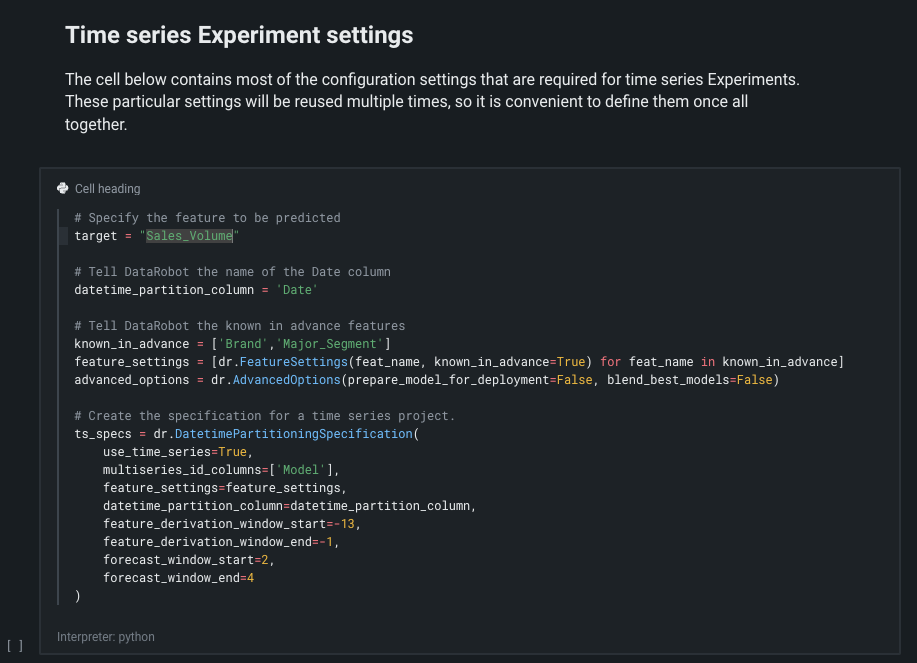
Run the cell that defines the experiment settings (matching the configuration done in the DataRobot UI). This cell creates a time series experiment using all of the vehicles in the data frame. DataRobot will create an experiment for each vehicle segment. Reference some information about the features below:
- The target is
Sales_Volume. - The date feature is
date. - The known in advance features are
BrandandMajor_Segment. - The multiseries column ID is
Model. - The feature derivation window is from
-13to-1. - The forecast window is from 2 to 4 months in the future.
Read more:
- Time series framework
- Multiseries modeling
- Enable time-aware modeling
- Set backtest partitions
- Time series modeling data
6: Run the experiment
Next, create an experiment using all of the data in the Pandas Dataframe. This cell initiates DataRobot Autopilot for modeling. Allow some time for Autopilot to complete and build the experiment. You can reference the DataRobot GUI to monitor Autopilot's progress.
7: Create experiments for each segment
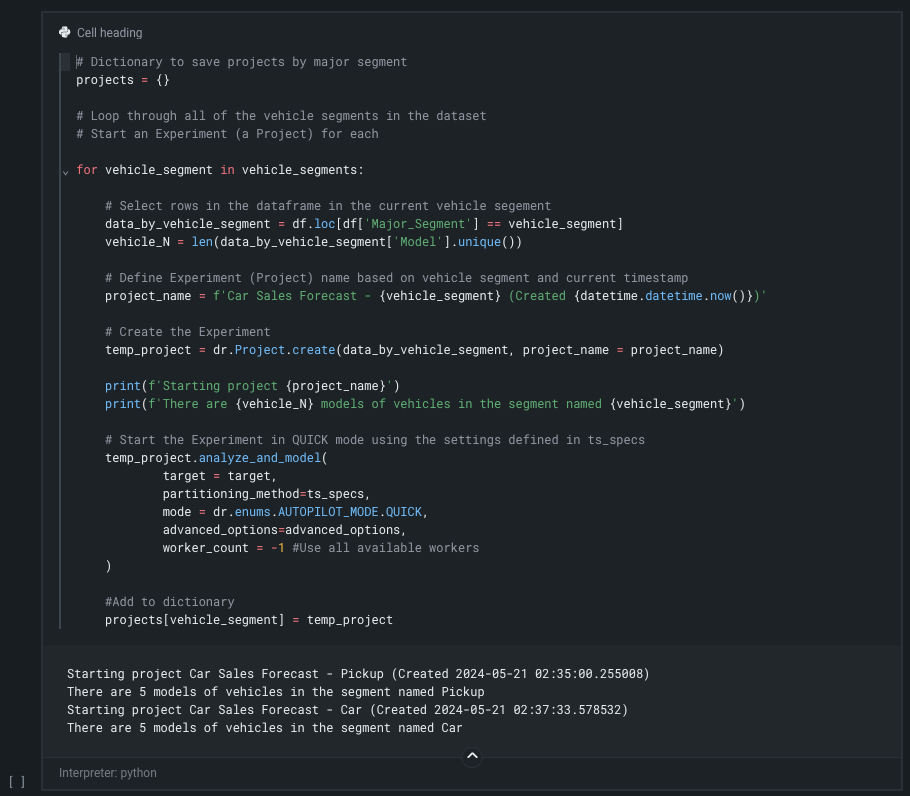
The proceeding cells creates and an experiment for each unique value of Major_Segment in the Dataframe. In this walkthrough, you will create an experiment for the Car and Pickup segments. To do so, first subset the data by the segment. Then you will assign a name for each experiment created based on the vehicle segment. These experiments will leverage the time series settings specified in previous steps. Then, you will run Autopilot again for these experiments. This cell includes a print statement to inform you of which experiment DataRobot is currently building.
Next steps
When Autopilot completes, you will have a set of experiments for the major segments. This walkthrough demonstrates DataRobot's ability to automate experimentation using Python loops to accomplish exploratory work quickly. In addition to looping by segment, you can loop for individual models, individual forecast distance, or for different feature derivation windows. Reference the model factory code example for more information.
From here, you can also:
