How-to: Time series forecasting in the GUI
This walkthrough showcases a car sales forecasting example to learn about DataRobot time series. The dataset includes month-by-month sales for many makes and models of vehicles. On this page you will create an experiment and build models in the UI. Complete the second part of this walkthrough using a code-first approach with the DataRobot Python client. In part 2, you create the same type of experiment but use Python loops to accomplish more modeling work, faster. Watch the full video of this use case on YouTube.
Learn more
Read about time series forecasting in the time series reference section; read more about creating time-aware modeling experiments in Workbench in the NextGen documentation.
Assets for download
Download the following car sales-related assets—a shorter version of the data (FAST), a fuller version with more segments (_Segments), and a Python notebook (_Model_Factory.ipynb):
1: Create a Use Case
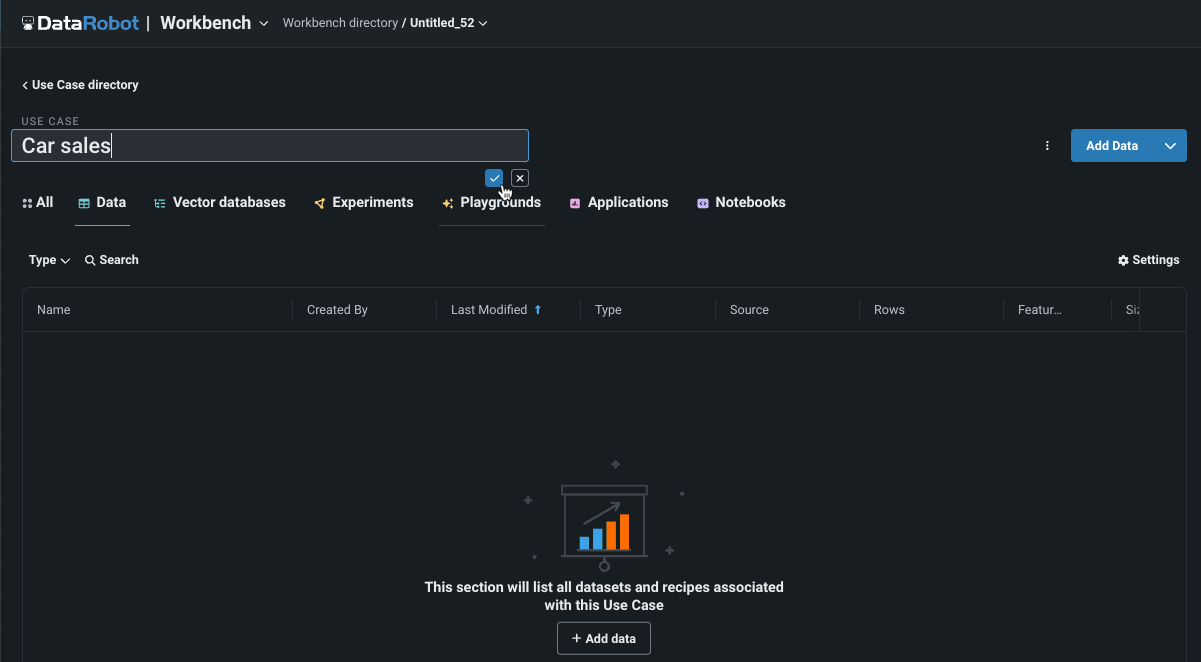
From the Workbench directory, click Create Use Case in the upper right: and name it Car sales.
Read more: Working with Use Cases
2: Upload data
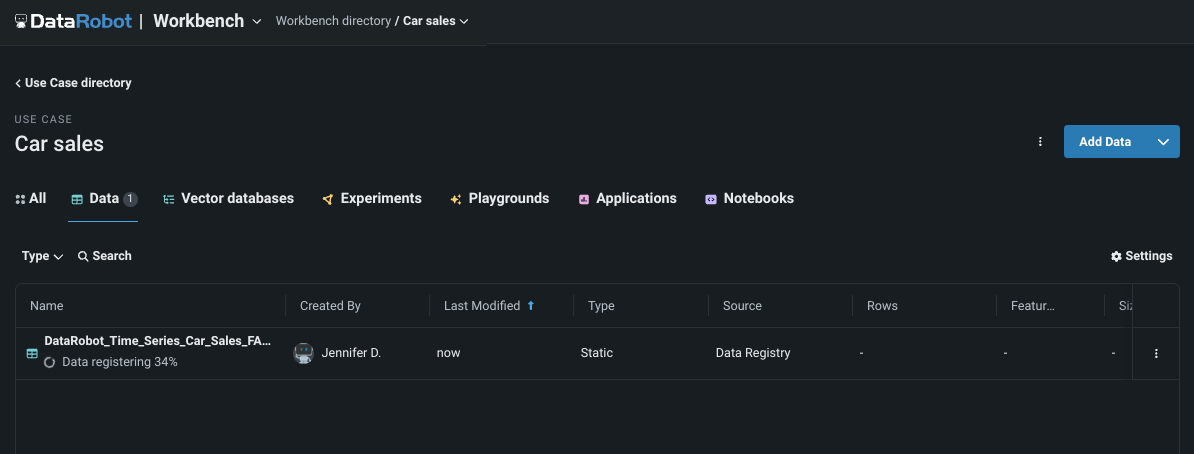
Click Add data > Upload to add the _FAST dataset (included in the assets you downloaded to start) to your Use Case via local file.
While a dataset is being registered in Workbench, DataRobot performs EDA1—analyzing and profiling every feature to detect feature types, automatically transform date-type features, and assess feature quality. Once registration is complete, you can see what was uncovered while computing EDA1.
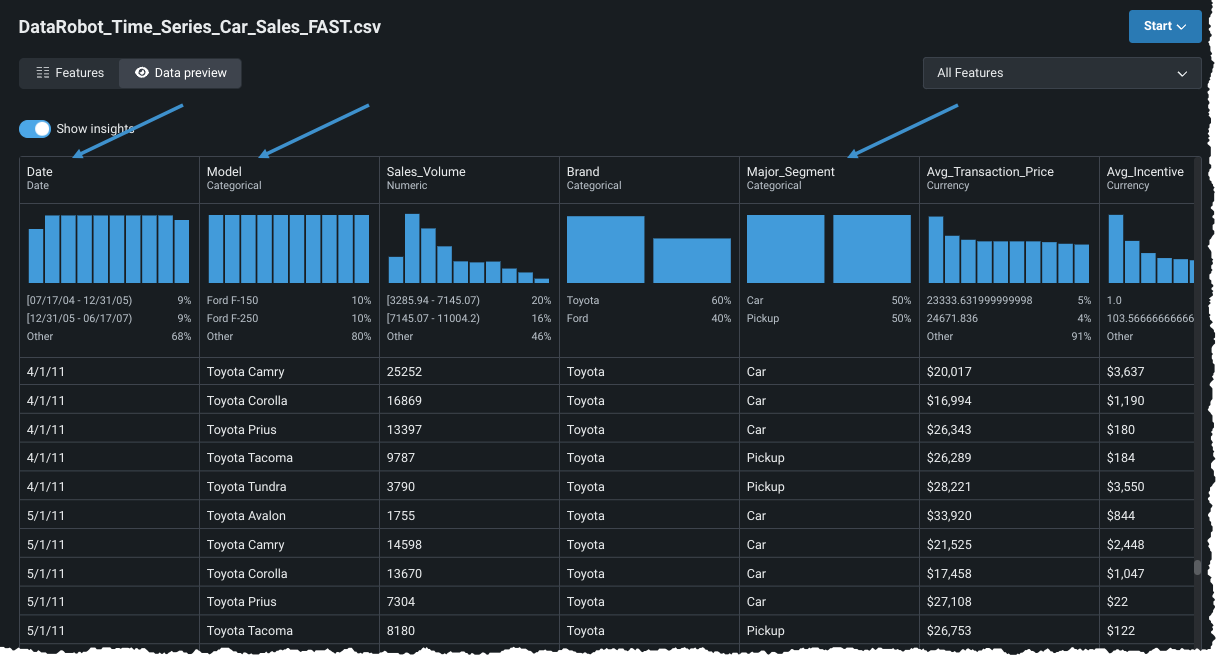
After DataRobot finishes registering the dataset, click the dataset name to explore. Notice the following:
| Characteristic | Supporting column |
|---|---|
| The time step in this time series dataset is monthly. | Date |
| The target value you will forecast is the monthly sales volume. | Sales_Volume |
| The dataset has ten models of cars in two major segments. | Model, Major_Segment |
Additionally, there are five columns of contextual information, the average price and average dealer incentive, and three economic indicators.
Read more:
3: Set basic modeling config
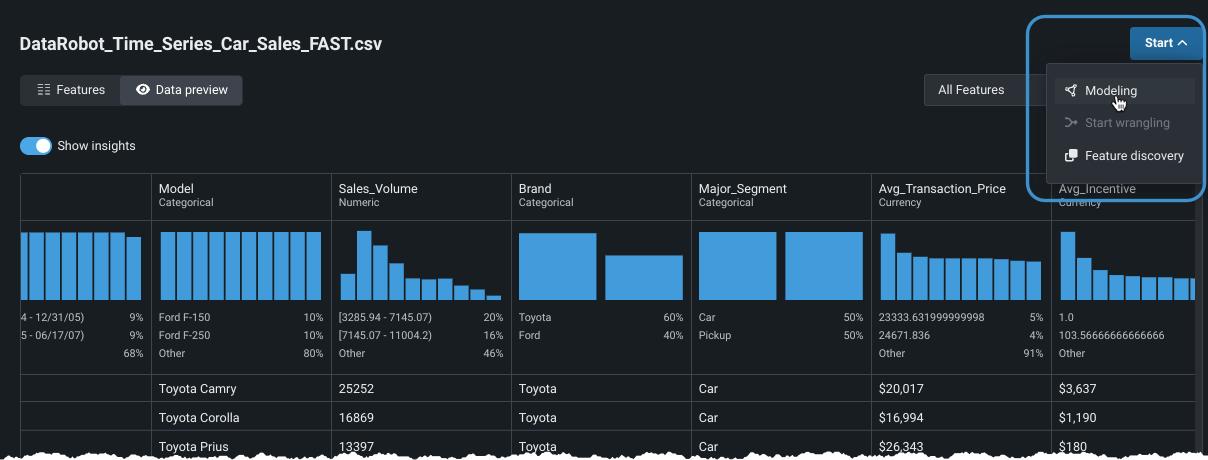
After exploring, click Start > Modeling to build an experiment using the car sales data.
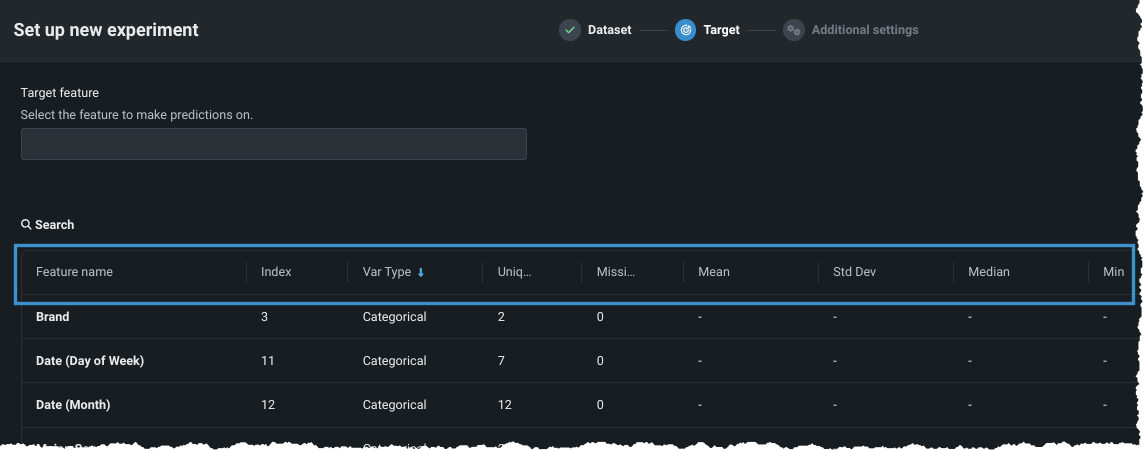
Once the data is processed for modeling, review the information provided for a quick data quality check, such as the number of unique and missing values.
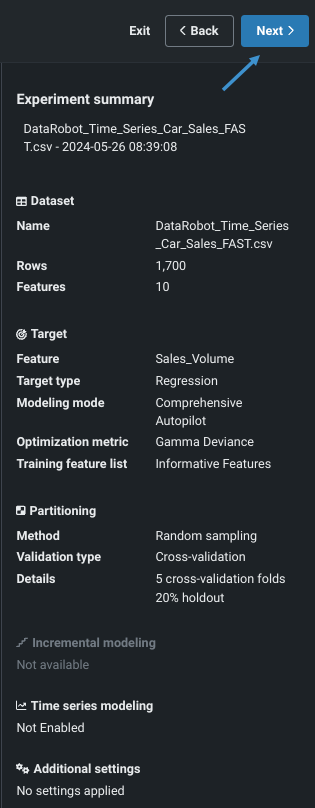
Configure the following basic settings:
| Field | Setting |
|---|---|
| Target | Sales Volume |
| Modeling mode | Comprehensive Autopilot |
| Optimization metric | Recommended (Gamma Deviance) |
Until you start modeling, the configuration can be changed. Review the configuration so far in the experiment summary on the right:
Click Next to continue configuring the experiment.
Read more:
4: Configure time series modeling
Time-aware modeling is used when data must be kept in date order. This is true for all types of forecasting and also for certain classification and regression problems where out-of-time validation is used. To continue the configuration:
-
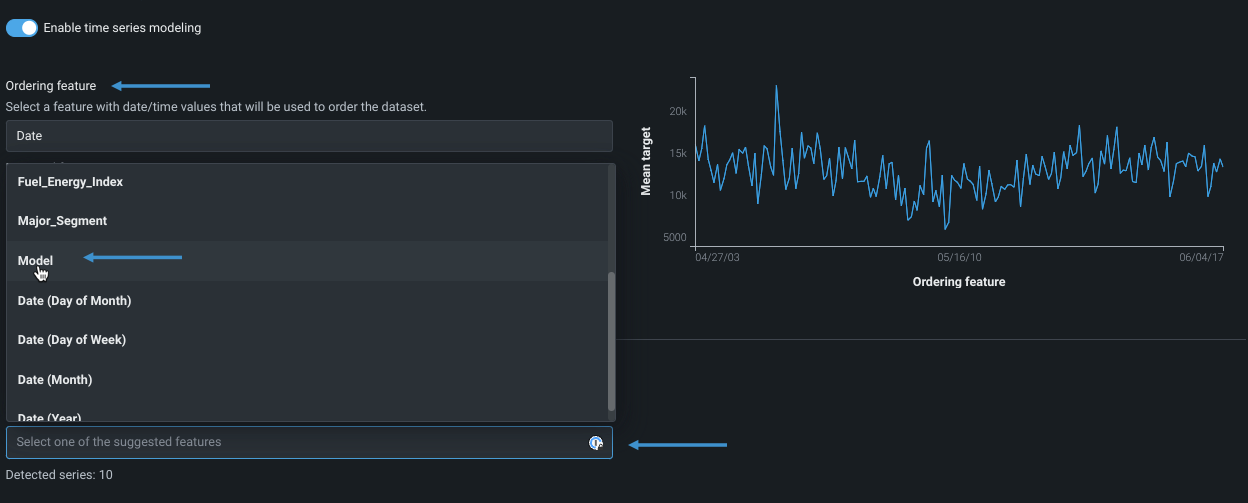
Select the Time series modeling tab and toggle on time series modeling:
-
Set the ordering feature and series identifier:
In this example there is only one ordering feature—
Date. In your experiments you may have to set this manually if there is more than one. DataRobot has also correctly detected the series identifier, which you confirm from the dropdown list. Alternatively you can choose another identifier. -
Scroll down to configure window settings. Set the following values and note that the illustration to the right updates as you add values. Note that DataRobot automatically detected a monthly time step.
Window setting Value Description Feature derivation window values 13 (left), 1 (right) Configures the periods of data that DataRobot uses to derive features for the modeling dataset. In this example, features are derived from data that is 13 months to 1 month prior to the forecast point. Forecast window 2 (left), 3 (right) Defines the range (the forecast distance) of future predictions; DataRobot optimizes models for that range and ranks them on the Leaderboard on the average across that range. In this example, models will predict two, three, and four months into the future. The recommended model will be the one that minimizes the error for all makes and models of cars for all forecast distances. -
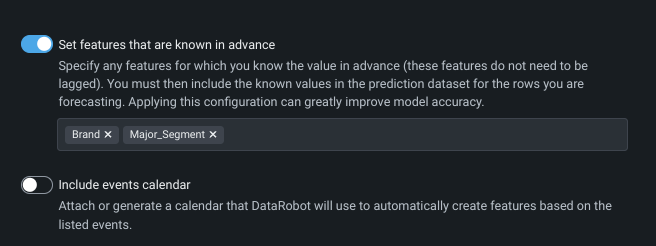
Set features that are known in advance—features that do not vary with time and are known at prediction time. In this example,
BrandandMajor_Segment.
Note
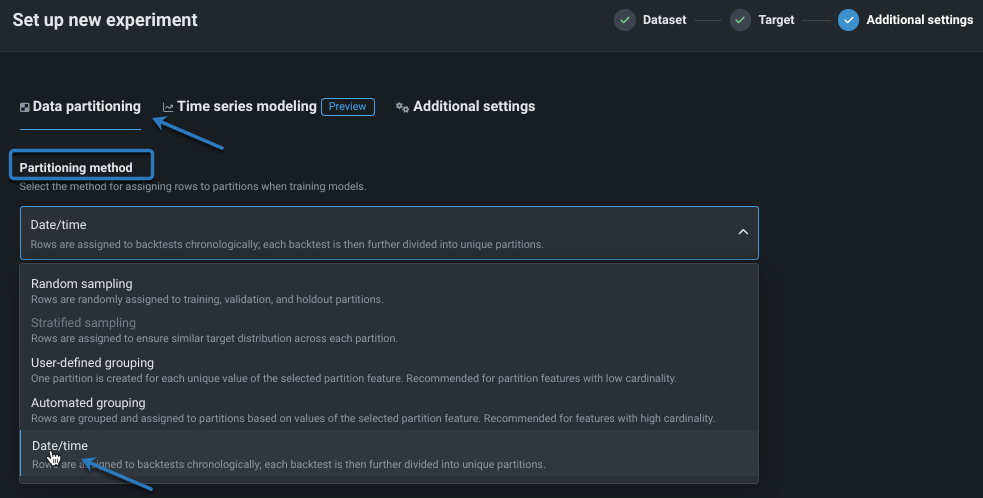
When you toggle on time series modeling, DataRobot automatically enables date/time partitioning and configures backtest settings based on your dataset. You could do both of these tasks manually—for example if you want different backtest settings—from the Data partitioning tab. Click the tab to explore, if you choose.
All settings are now complete (see the updated experiment summary); click Start modeling to begin training models. DataRobot automation will derive time series features, apply other preprocessing to the data, select algorithms to test, and then start testing them on each appropriate model.
Read more:
- Time series framework
- Multiseries modeling
- Enable time-aware modeling
- Set backtest partitions
- Time series modeling data
5: Explore the Leaderboard
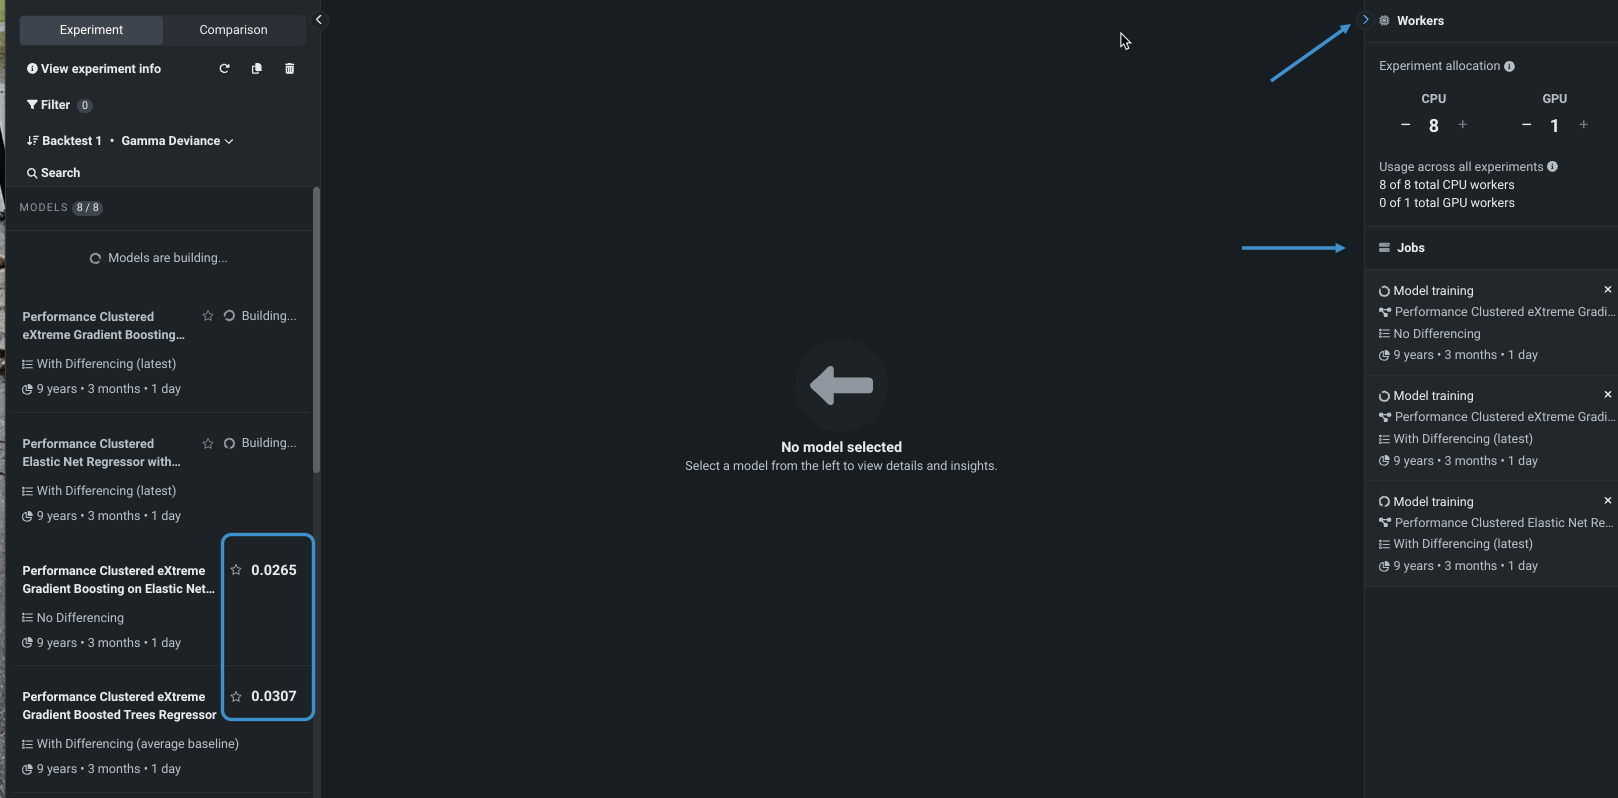
As training commences, DataRobot populates the Leaderboard with models in the building and completed states—completed models display an accuracy score. The time required to finish training all models depends on the size of the starting data as well as the number of concurrent jobs your account allows. Expand the Jobs queue to see the status and queued models for your experiment.
Once a model completes, click on it in the Leaderboard to begin exploring. You can star a model for easier identification later (for example, to find the model you ran computations on). For this walkthrough, star, and then select "Per Series Elastic Net Regressor with Forecast Distance Modeling."
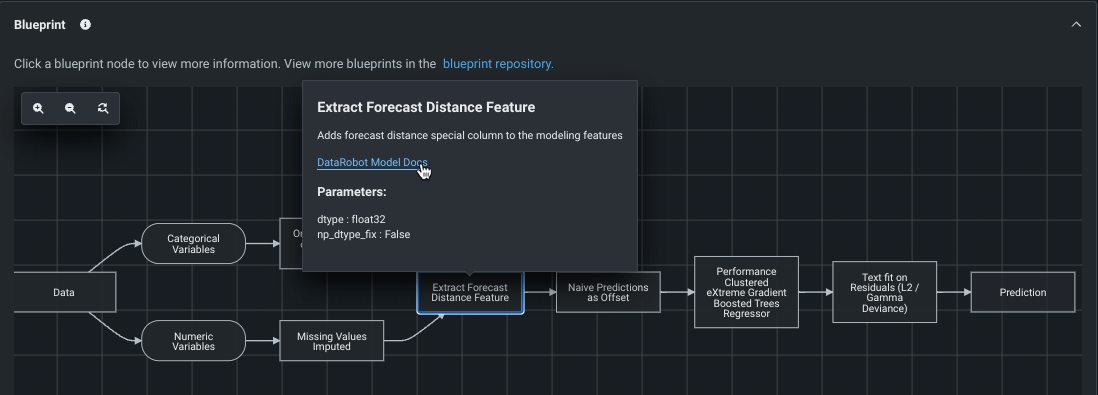
Click the Blueprint to see a graphical representation of the pipeline of preprocessing steps, modeling algorithms, and post-processing steps that go into building a model. Click a task to access the reference documentation for that task.
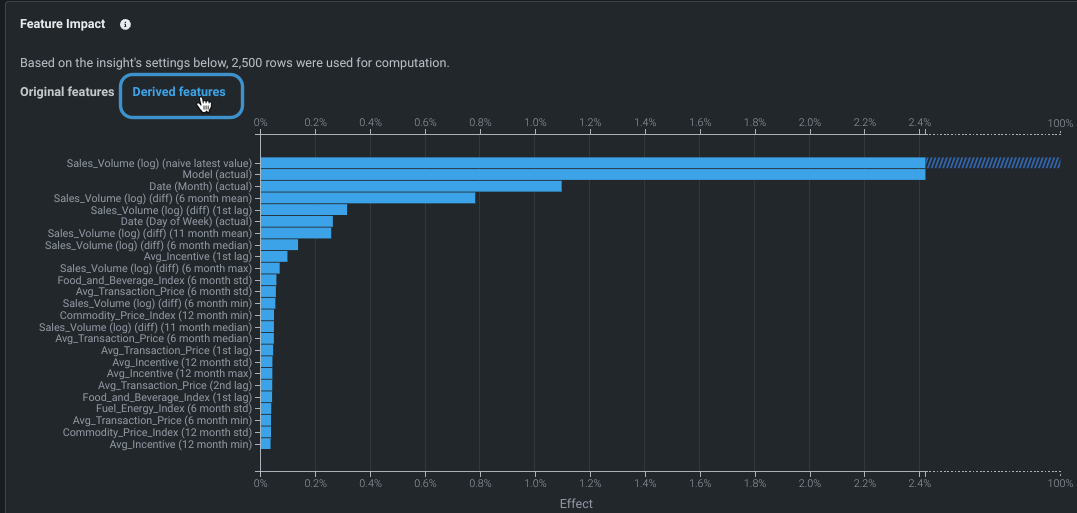
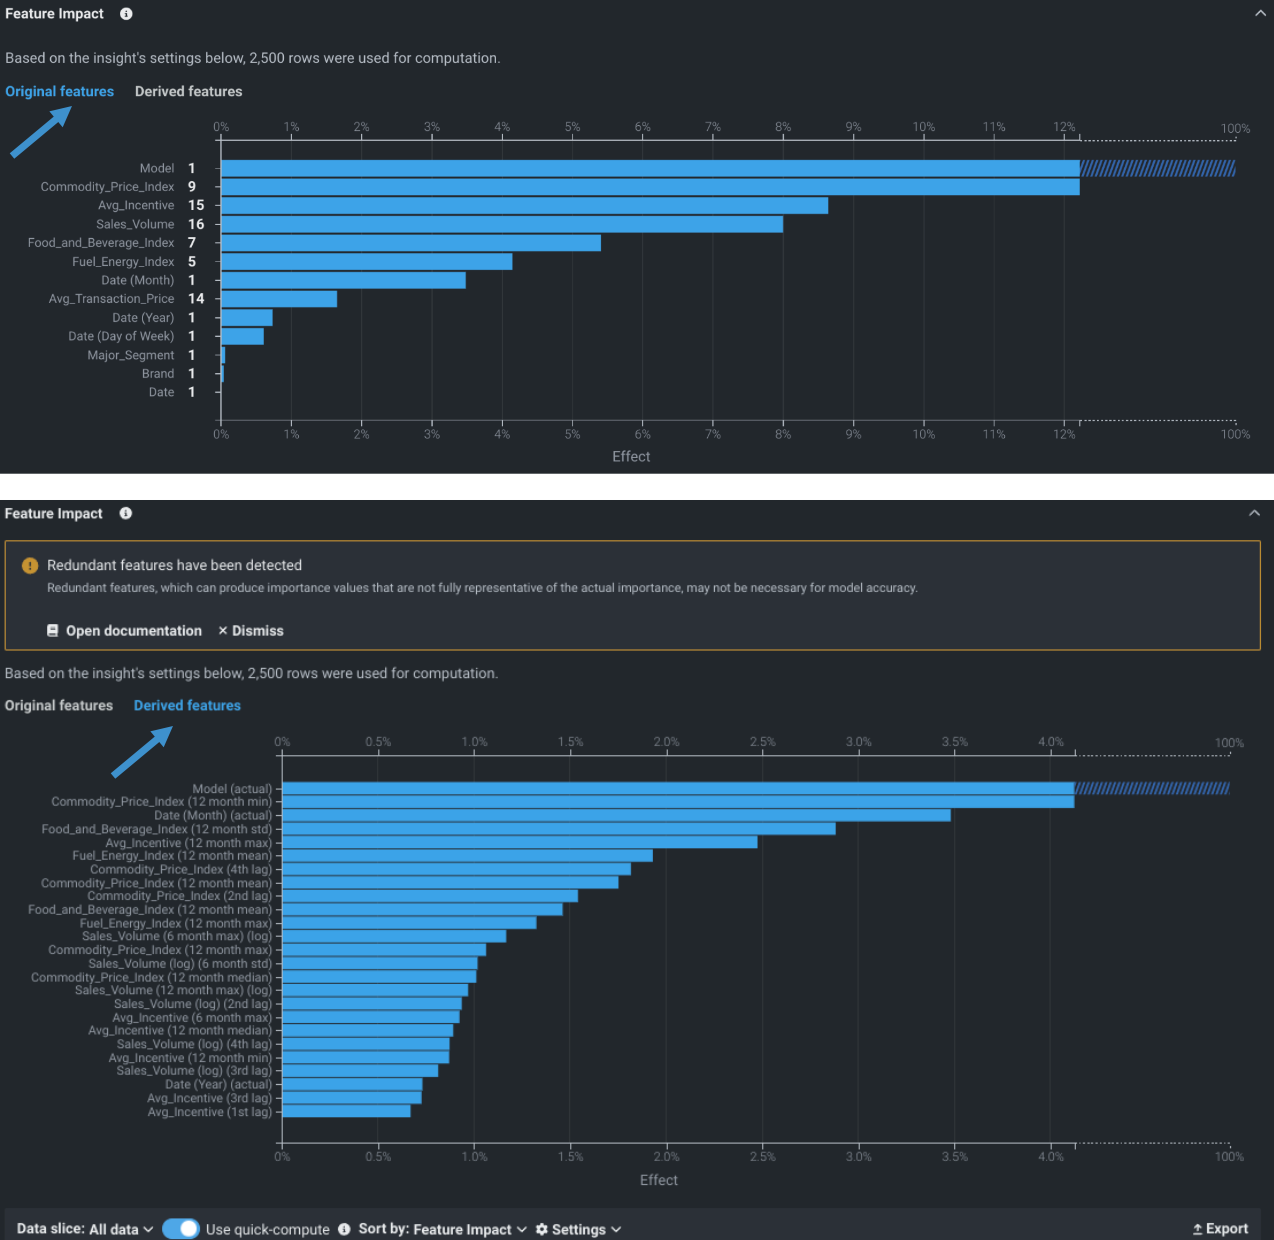
Click Feature Impact for a high-level visualization that identifies which features are most strongly driving model decisions. Click to compute the insight, if prompted. The calculation is added to the queue. When calculations complete, click the Derived features tab.
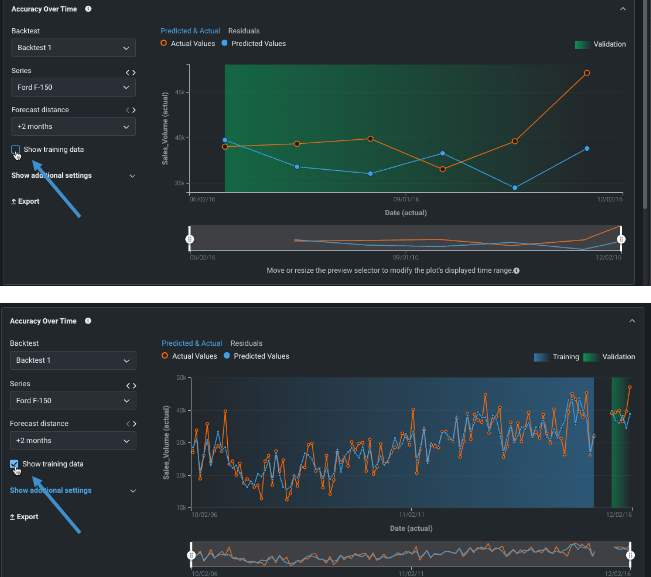
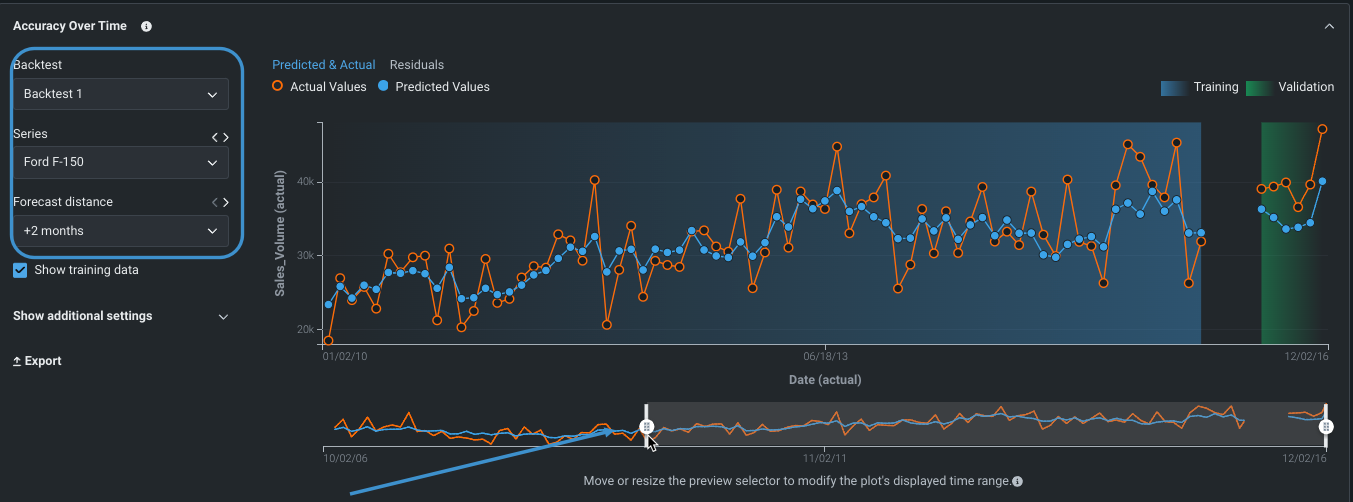
Investigate Accuracy Over Time by first clicking Compute for training. You can change backtest, series, forecast distance, and resolution. Notice the difference when training data is shown and hidden:
Because this is a multiseries experiment, you can use Series Insights to view series-specific information. Compute accuracy scores to see beyond the first 1000 series; experiment with the dropdown settings to better understand the insight as the changes will help with interpreting the display.
Read more:
6: View experiment information
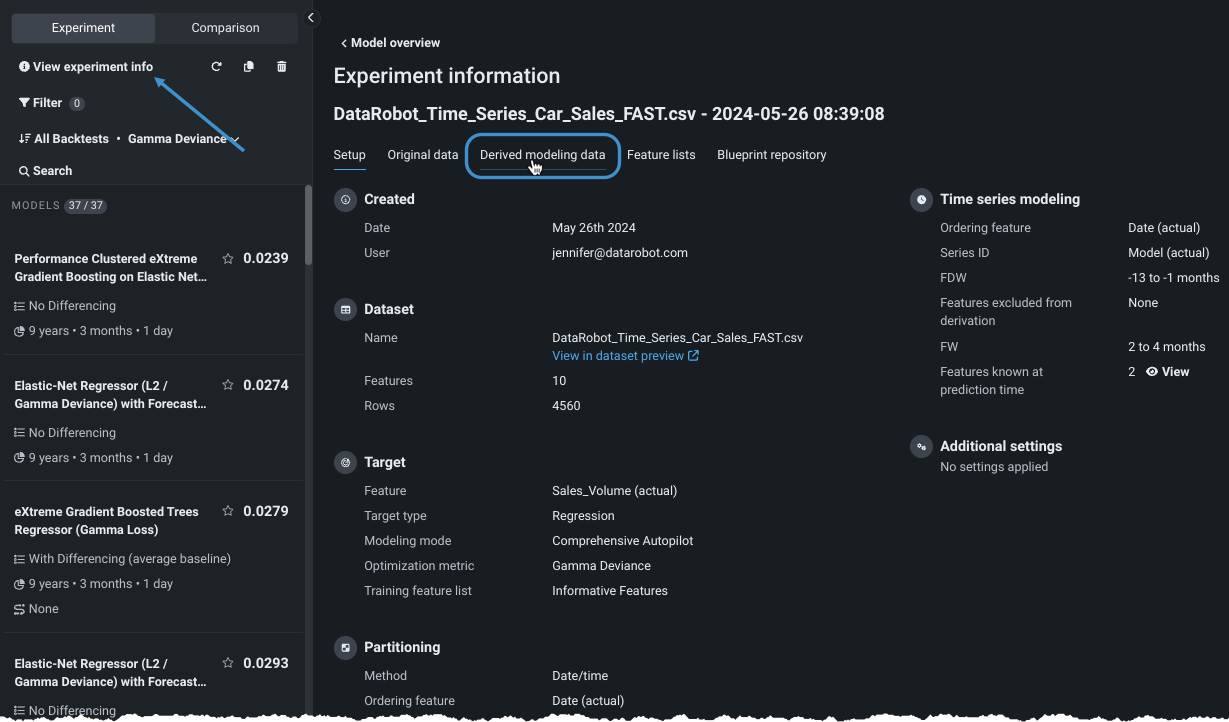
At any point after model training, click View experiment information to see summary information including the derived data, to view and create features lists, and to access the blueprint repository (where you can access additional blueprints to train). Explore the tabs while insight calculations complete.
The initial display, the Setup tab, provides summary information about the experiment.
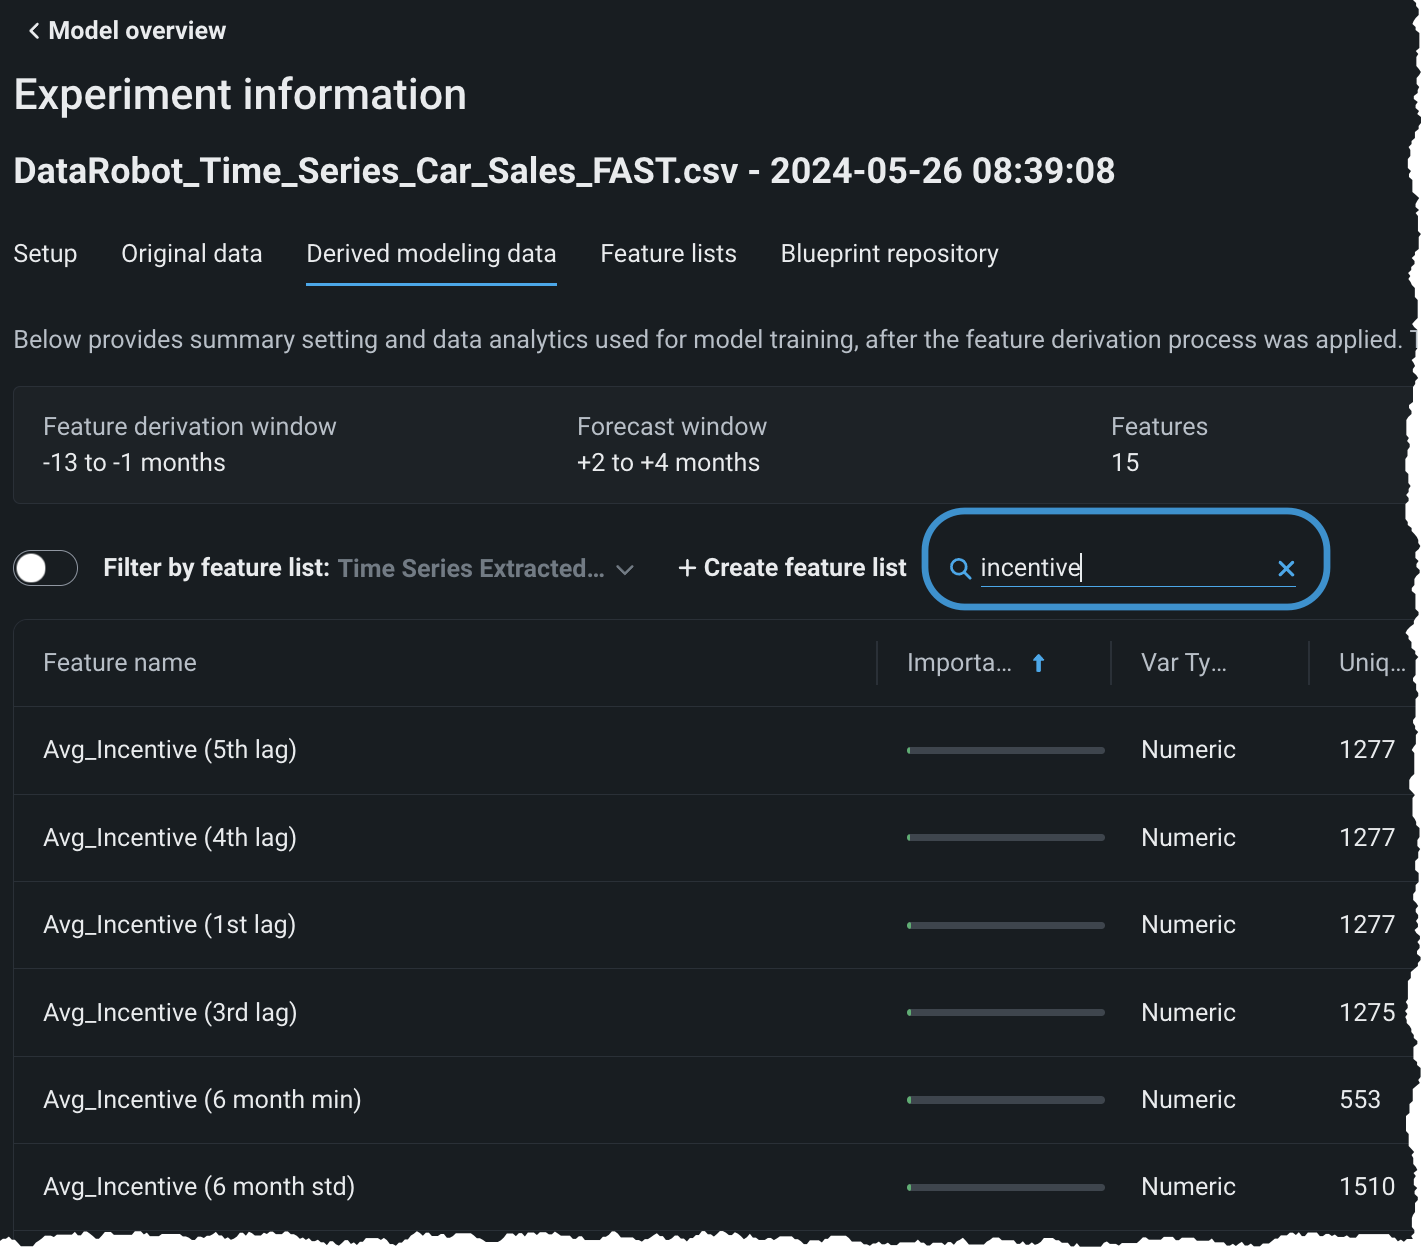
Click the Derived modeling data tab to see the data used for model training, after the feature derivation process was applied. Notice that the dataset has gone from 10 features, as shown in the Original data tab, to 107 features. You can also preview the derivation log or download the complete transformation record.
DataRobot automatically creates time series feature—lags, average/max/median, rolling, and more—based on the characteristics of the data and configured windows. For example, in the car sales dataset DataRobot has created a number of lagged (and other) features based on average incentive`:
Read more: Time series feature derivation
7: Explore feature lists and blueprints
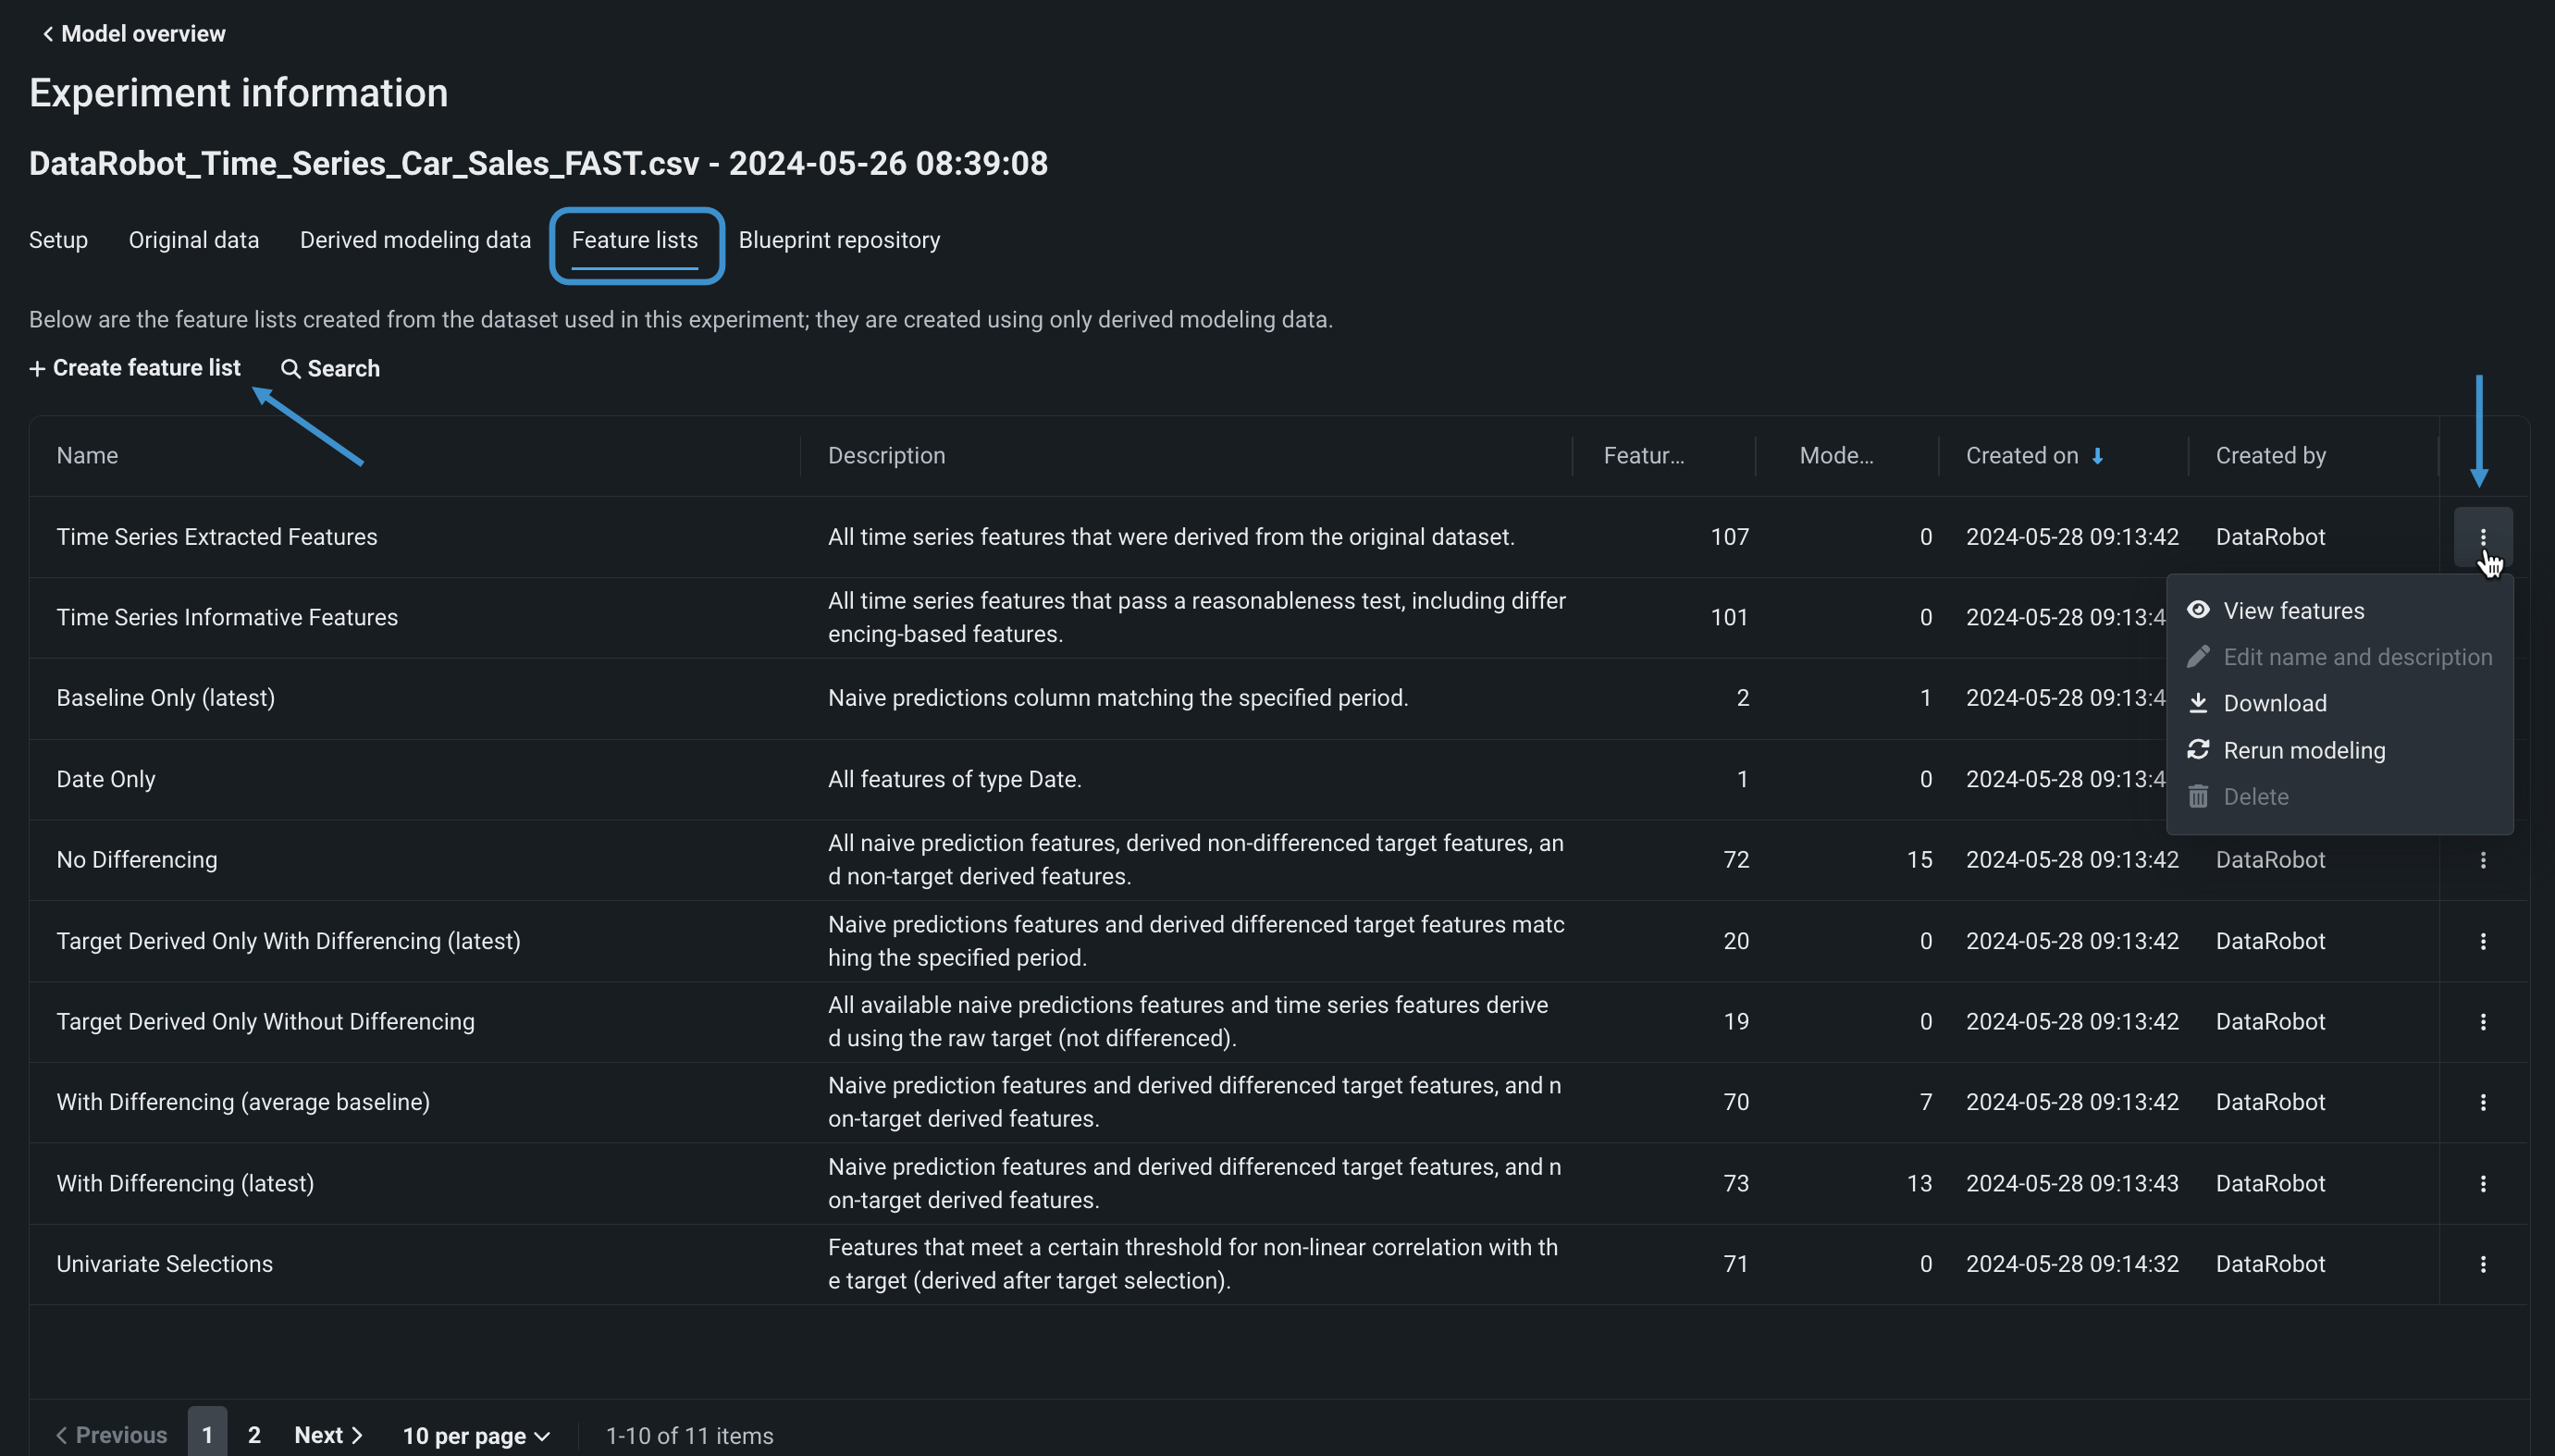
After constructing time series features for the data, DataRobot automatically creates multiple feature lists, which are shown on the Feature lists tab. The initial selection of automatically created lists are, again, those most appropriate to your data. For example, DataRobot knows which algorithms require differencing and which do not, and creates appropriate lists containing those features. You can take a variety of actions for each list, as well as create your own feature lists.
When creating a custom list, select features individually or use bulk actions; be sure to include the ordering feature. Provide a name, and optionally, description of your list. This walkthrough uses an automatically created list.
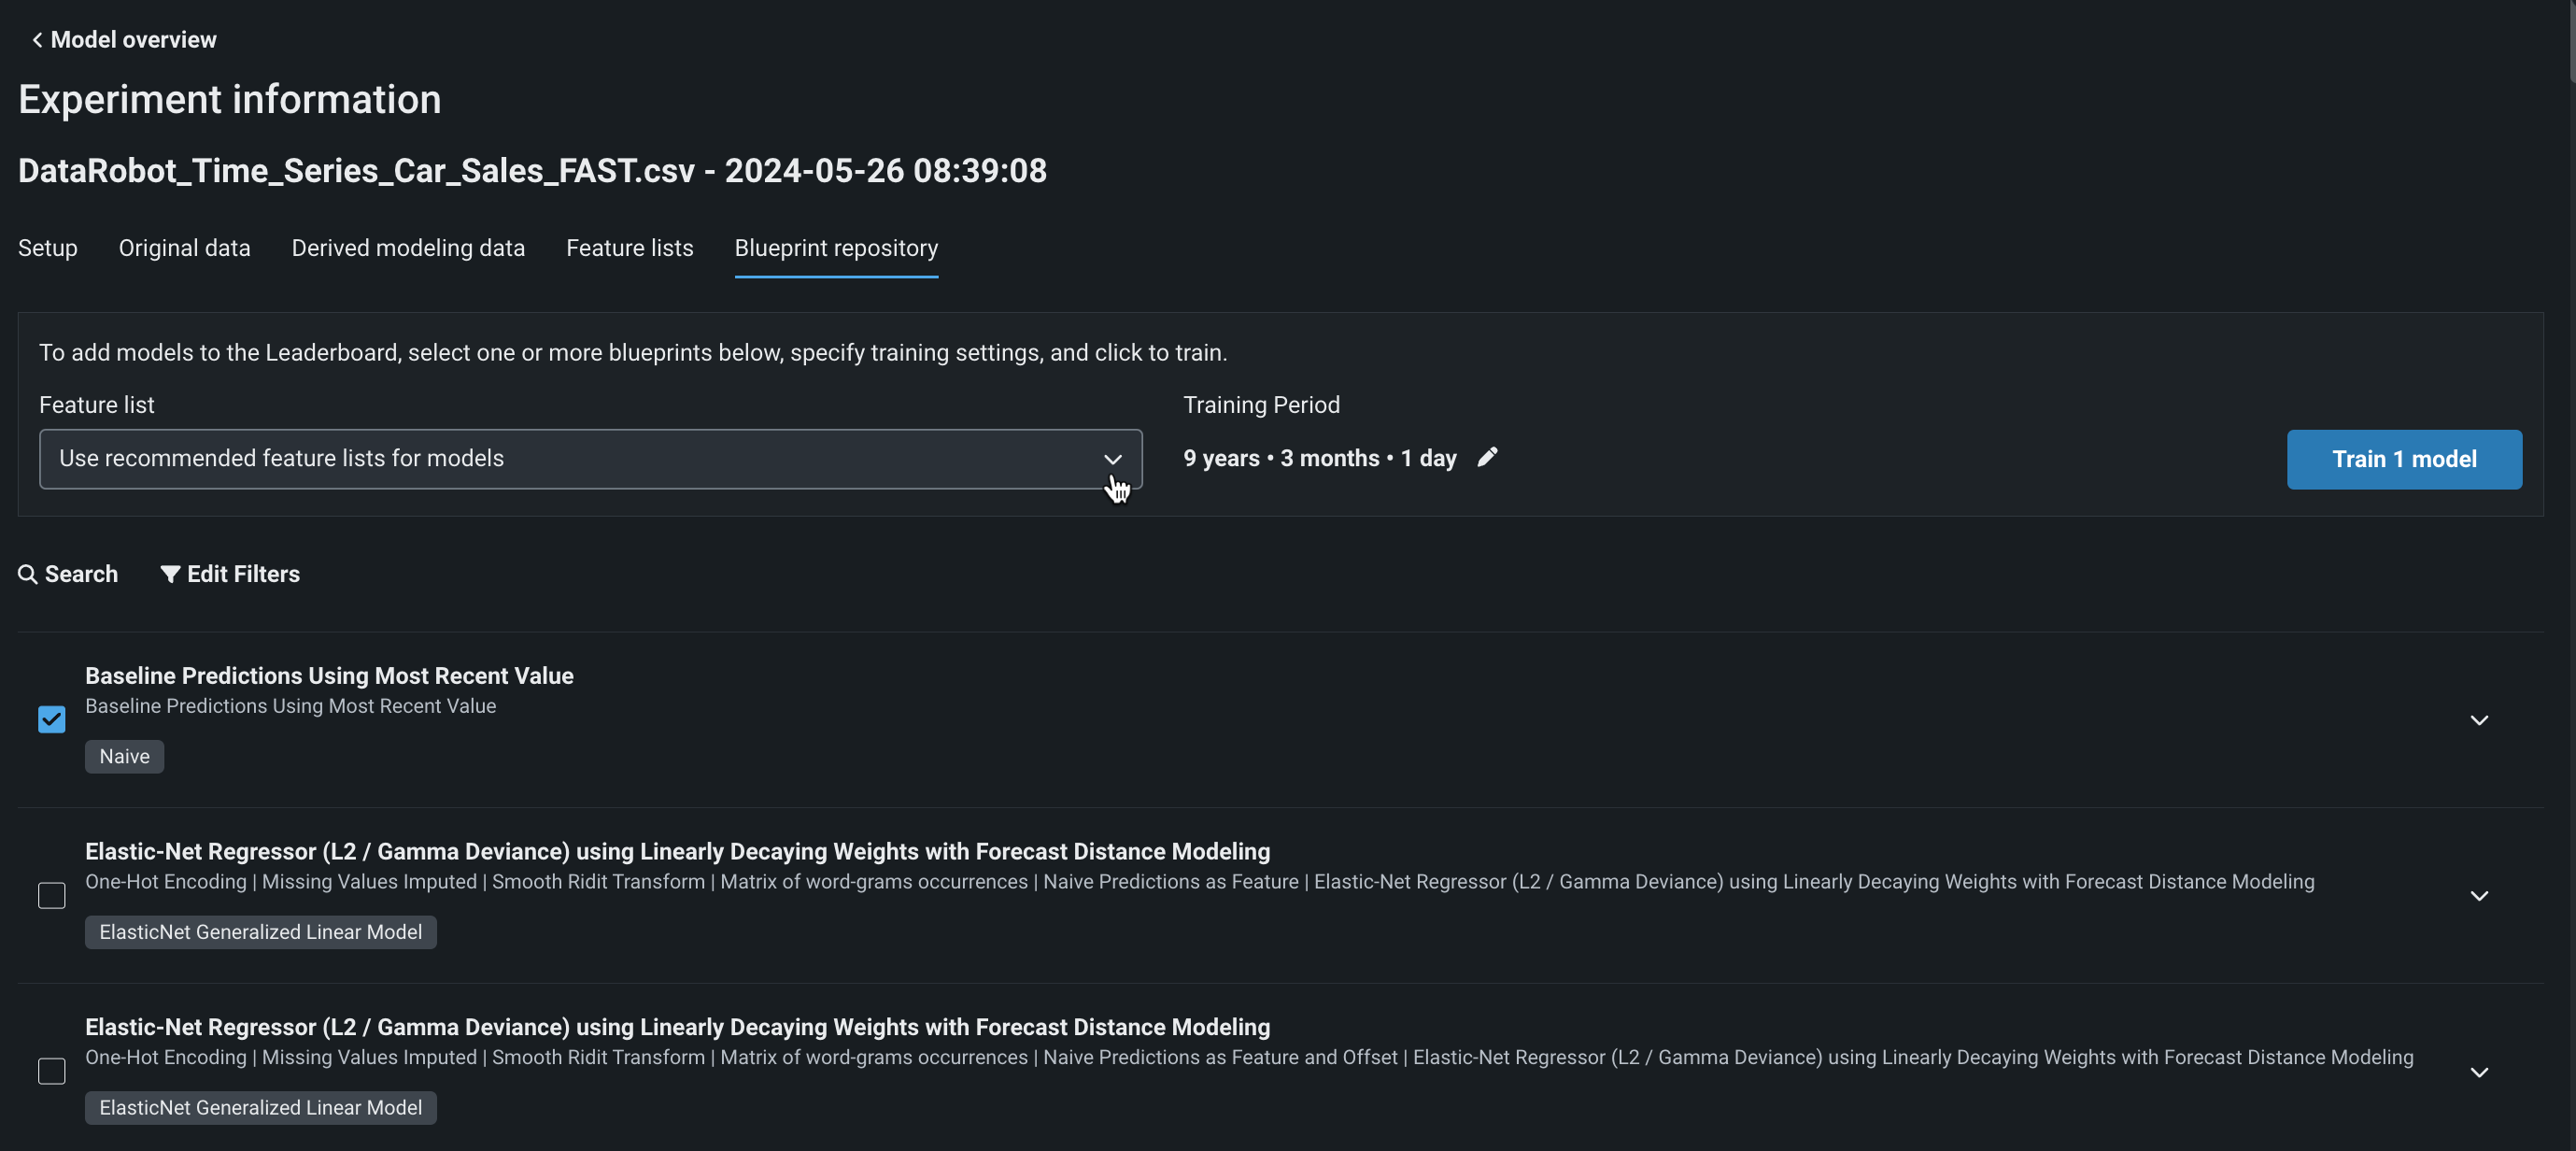
The Blueprint repository tab provides a library of modeling blueprints available and relevant for a selected experiment. You can search for blueprints, change feature lists, and train one or more models from the repository.
Read more:
8: View and slice calculated insights
Return to the Leaderboard, and your starred model, to view the view the insights you ran calculations for.
-
First, expand Feature Impact, which shows the relative contribution of features, both original and derived.
By default the insight shows relative importance for all ten makes and models of cars in both identified segments.
-
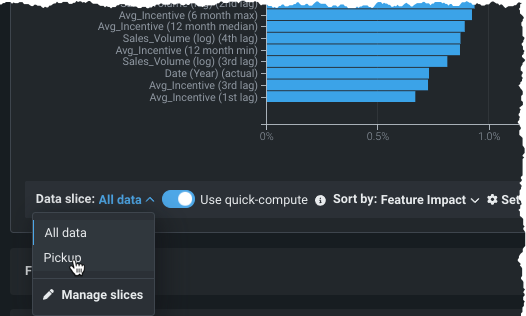
Create a data slice for a finer-grained view. From the Data slice dropdown in the bottom left of the insight, choose + Create slice. Complete the modal as follows:
Field Setting Slice name PickupFilter feature Major_Segment (actual)Operator =Value PickupClick Save slice. From the Data slice dropdown, select the slice
Pickup; you will be prompted to recompute the insight using the configured subpopulation of a model data. -
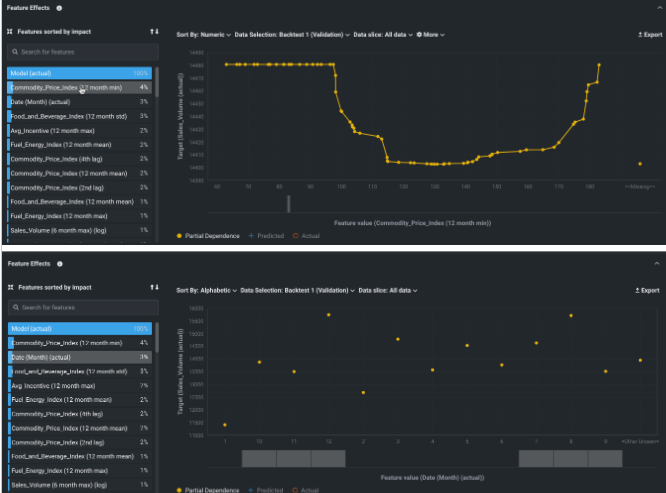
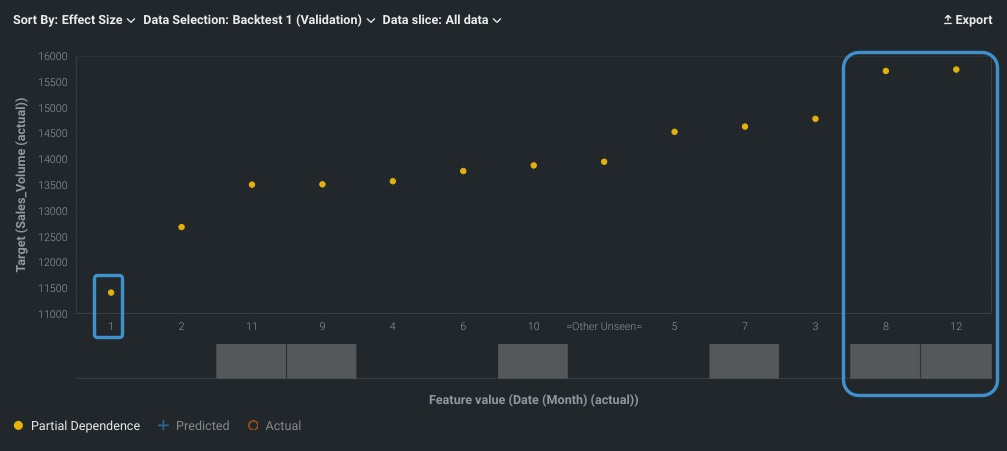
Open the Feature Effects insight, which shows the effect of changes in a feature's value. The insight is communicated in terms of partial dependence, an illustration of how changing a feature's value, while keeping all other features as they were, impacts a model's predictions.
For example, you can view how a the commodity price index affects sales volume or view by the month of the year.
If you change the Sort by criteria to order by effect size, you can see that the fewest cars are sold in January, while the most are sold in August and December.
You can change the display to show only the features identified by the
Pickupdata slice, but changing the slice will require recomputing. -
Next, scroll down to Accuracy Over Time. Predicted values are shown in blue and actual values in orange for the training (shaded blue) and validation (shaded green) periods. Use the controls to select change the series displayed, backtest or forecast distance. Use the preview selector at the bottom of the insight to zoom in on a specific time period.
-
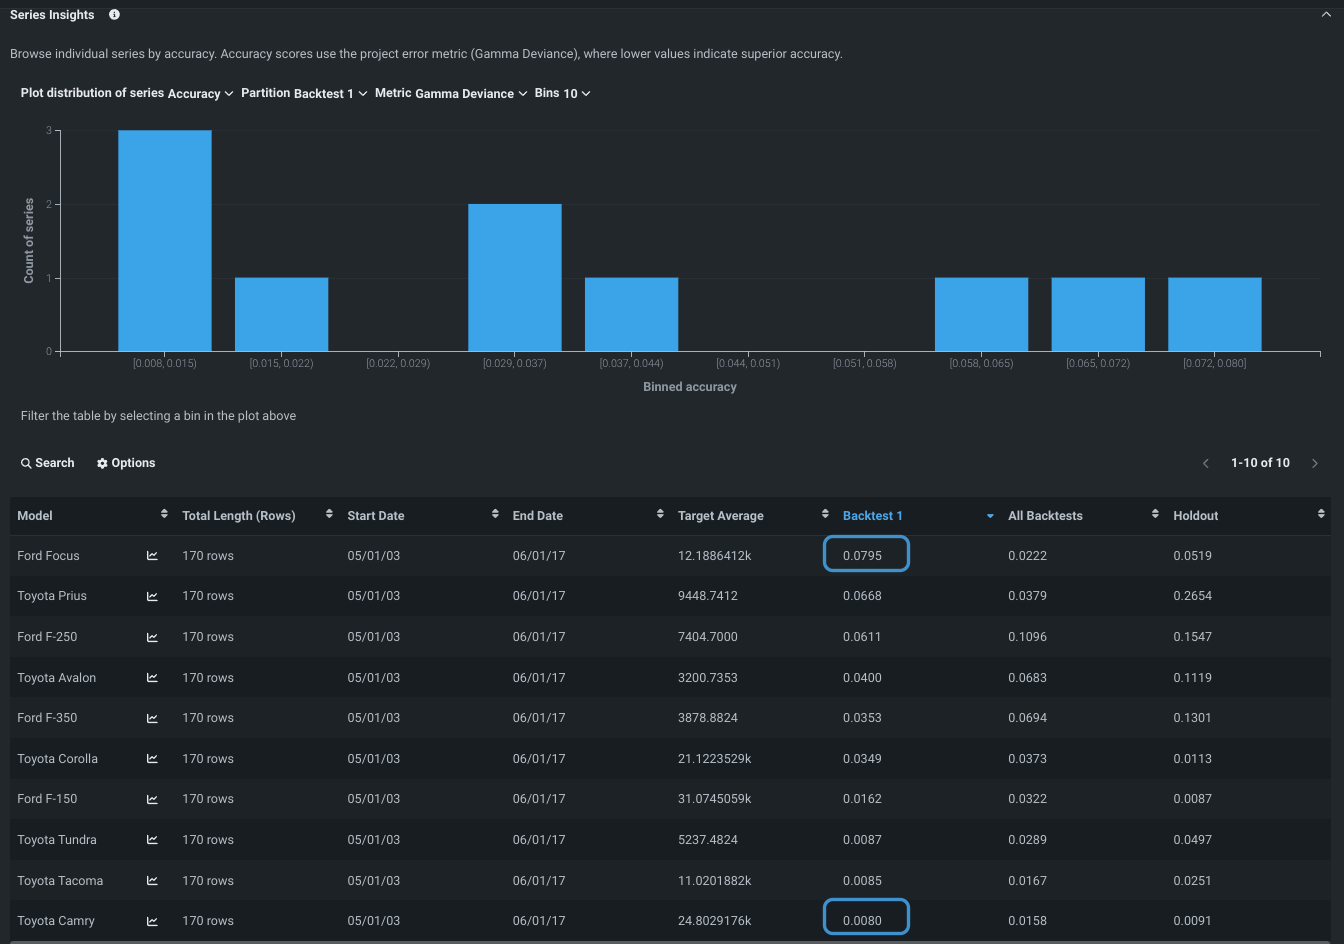
Finally, look at Series Insights. The tab shows a histogram and table of information specific to a selected, or all, series.
Look at the Backtest column, which shows the error for each series. You can see that the error is lowest for the Toyota Camry and highest for the Ford Focus.
It's helpful to put errors in context with the actual sales volume—the target feature. Sort the Target average column. If the vehicles with very high sales volumes are among the ones with the lower errors, it's a good indication that you may have found a suitable model. Conversely, if the errors are high for the high sales volume car, you would discard that model as a contender.
Read more:
- See the tip in step 5
- Sliced data
- Feature Effects
9: Re-evaluate the Leaderboard
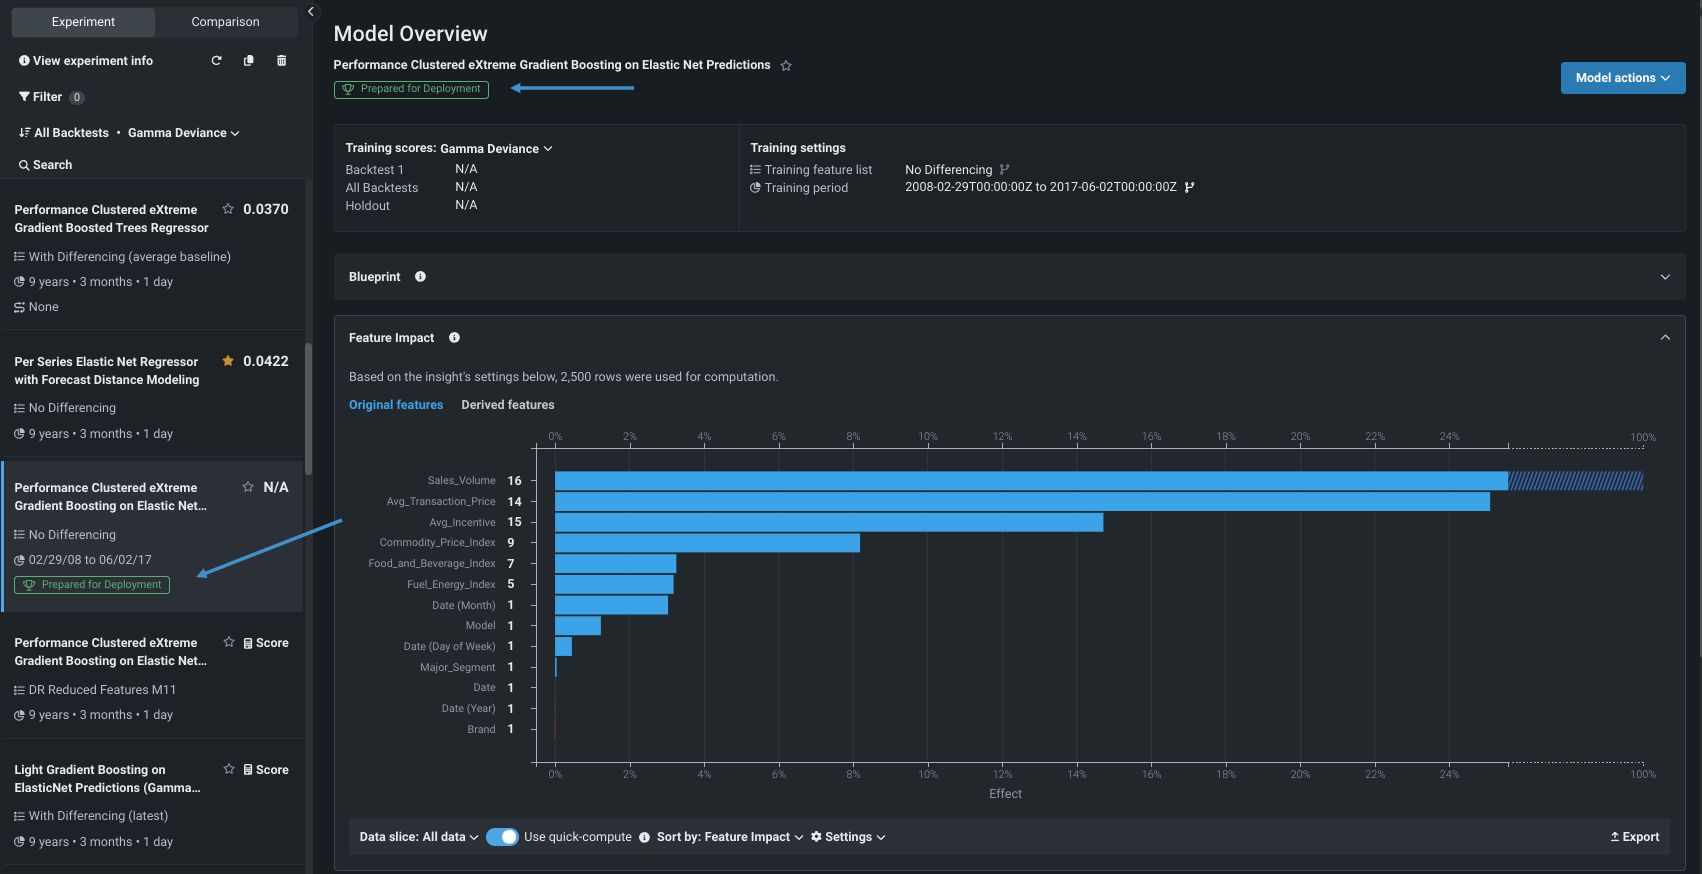
To allow early investigation during this walkthrough, computations were run on a model selected before model building completed. Now, return to the Leaderboard and see the re-ordering that has occurred. If model building finished, DataRobot selected the most accurate individual, non-blender model and prepared it for deployment. That model is marked with a badge and the Feature Impact calculation has been run.
Note that you can leave the Leaderboard, for example to work in other Use Cases or experiments, and return to this experiment at any time.
Read more:
Next steps
After you have built a model in the UI, you can move onto part 2 of the walkthrough to use a code-first approach with the DataRobot Python client. Alternatively, to explore additional actions in the UI, reference the resources below:
- Make predictions to test accuracy.
- Register the model and ultimately deploy it.
