Time series feature lists
DataRobot automatically constructs time series features based on the characteristics of the data (e.g., stationarity and periodicities). Multiple periodicities can result in several possibilities when it comes to constructing the features—both “Sales (7 day diff) (1st lag)” or “Sales (24 hour diff) (1st lag)” can make sense, for example. In some cases, it is better to perform no transforming of the target by differencing. The choice that yields the optimal accuracy often depends on the data.
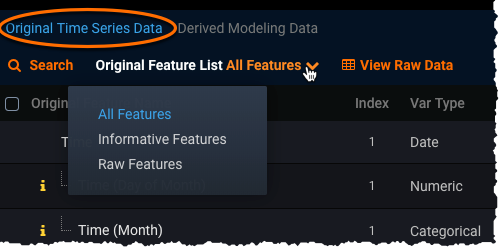
After constructing time series features for the data, DataRobot creates multiple feature lists (the target is automatically included in each). Then, at project start, DataRobot automatically runs blueprints using multiple feature lists, selecting the list that best suits the model type. With non-time series projects, by contrast, blueprints run on a single feature list, typically Informative Features).
Time series feature lists can be viewed from the Data > Derived Modeling Data page, for example:
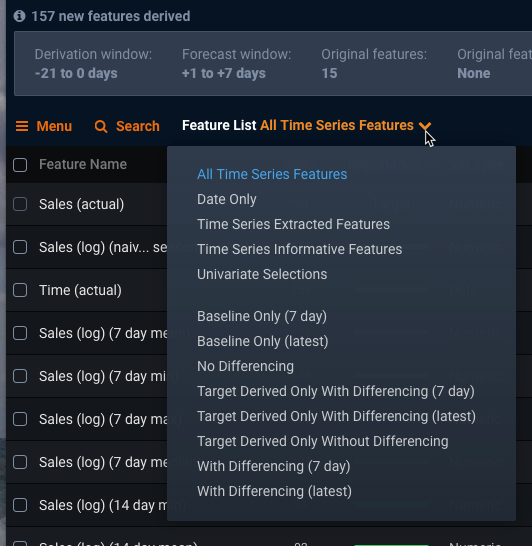
These lists are different, and more targeted, than those created by non-time series projects.
Exclude features from feature lists
There are times when you cannot exclude features from derivation because other features rely on those features. Instead, you can exclude them from a feature list. In that way, they are still used in initial feature derivation but are excluded from modeling.
Note the following behavior that results from excluding certain special features from feature lists:
-
Target column: DataRobot will not derive target-derived features.
-
Primary date/time column: DataRobot will not derive calendar and duration features. Also, the feature list without the date/time column will not be available for modeling.
Info
You may still want to create a list that excludes the primary date/time feature for use with monotonic modeling.
-
Series ID column: DataRobot will not generate any models that depend on the series ID, including per-series, series-level effects, or hierarchical models.
MASE and baseline models
The baseline model is a model that uses the most recent value that matches the longest periodicity. That is, while a project could have multiple different naïve predictions with different periodicity, DataRobot uses the longest naïve predictions to compute the MASE score. MASE is a measure of the accuracy of forecasts, and is a comparison of one model to a naïve baseline model—the simple ratio of the MAE of a model over the baseline model.
On the Leaderboard, DataRobot identifies the model being used as the baseline model using a BASELINE indicator.
No baseline model on the Leaderboard?
To generate the baseline model by default, use comprehensive Autopilot mode. If you run in Quick Autopilot mode, you won't see the baseline model on the Leaderboard; however, DataRobot generates a blueprint of the baseline model in the background. To build a baseline model from the Repository, search for Baseline Predictions Using Most Recent Value and train it on the Baseline Only feature list that has the longest seasonality.

Automatically created feature lists
The following table describes the feature lists automatically created for time series modeling available from the Feature List dropdown:
| Feature list | Description |
|---|---|
| All Time Series Features | Not actually a feature list, this is the dropdown setting that displays all derived features. |
| Baseline Only (<period>) | Naïve predictions column matching the period; used for Baseline Predictions blueprints. |
| Date Only | All features of type Date; used for trend models that only depend on the date. |
| No differencing |
|
| Target Derived Only With Differencing |
|
| Target Derived Only Without Differencing (<period>) |
|
| Time Series Extracted Features | A feature list version of All Time Series Features; that is, all derived features. |
| Time Series Informative Features* | All time series features that are considered informative (includes features based on all differencing periods). |
| Time Series Retraining Features | A copy of the feature list used by the original model, to ensure that the retrained model is as close to origin as possible. |
| Univariate Selections | Features that meet a certain threshold for non-linear correlation with the selected target; same as non-time series projects. |
| With Differencing (<period>) |
|
| With Differencing (average baseline) |
|
| With Differencing (EWMA baseline) |
|
| With Differencing (intra-month seasonality detection) | Multiple feature list options to leverage detected seasonalities (see below). |
| With Differencing (nonzero average baseline) |
|
* The Time Series Informative Features list is not optimal. Preferably, select one of the “with differencing” or the “no differencing” feature lists.
Feature lists for unsupervised time series projects
The following table describes the feature lists automatically created for time series projects that use unsupervised mode (anomaly detection). See the referenced section for details on how DataRobot manages these lists for point anomalies and anomaly windows detection:
| Feature list | Description |
|---|---|
| Time Series Extracted Features | A feature list version of All Time Series Features; that is, all derived features. |
| Time Series Informative Features | All time series features that are considered informative for time series anomaly detection. For example, DataRobot excludes features it determines are low information or redundant, such as duplicate columns or a column containing empty values. |
| Actual Values and Rolling Statistics | Actual values of the dataset together with the derived statistical information (e.g., mean, median, etc.) of the corresponding feature derivation windows. These features are selected from time series anomaly detection and are applicable to both point anomalies and anomaly windows. |
| Robust z-score Only | Selected rolling statistics from time series derived features but containing only the derived robust z-score values. These features are useful for evaluating point anomalies. |
| SHAP-based Reduced Features | A subset of features based on the Isolation Forest SHAP value scores. |
| Actual Values Only | Selected actual values from the dataset. These features are useful for evaluating point anomalies. |
| Rolling Statistics Only | Selected rolling statistics from time series derived features. These features are useful for evaluating anomaly windows. |
Feature lists for Repository blueprints
When building models from the Repository, you can select a specific feature list to run—either the default lists or any lists you created. However, because some blueprints require specific features be present in the feature list, using a feature list without those features can cause model build failure. This may happen, for example, if you created a feature list independent of the model type. To prevent this type of failure, DataRobot checks feature list and blueprint compatibility before starting the model build and returns an error message if appropriate.
Additionally, because DataRobot can identify a preferable feature list type for some blueprints, it suggests that list by default. See the time series considerations for a list of applicable blueprints.
Zero-inflated models
When the project target is positive and has at least one zero value, DataRobot always creates a nonzero average baseline feature list and uses it to build optimized zero-inflated models to reflect the data. These models may provide higher accuracy because the specialized algorithms model the zero and count distributions separately.
The nonzero average baseline feature list, with differencing, appends (nonzero) or (is zero) to the target name. Specifically:
- For (nonzero): features are derived by treating any zero target value as an instance of a missing value.
- For (is zero): features are derived by substituting target values with a boolean flag (whether the target is zero or not).
The transformed target values ("<target> (nonzero)" and "<target> (is zero)" are not used in modeling. To avoid target leakage during modeling, DataRobot only uses derived transformed target values (lags and statistics). In addition, the "With Differencing (nonzero average baseline)" feature list is only used for zero-inflated model blueprints, which are prefixed with "Zero-Inflated" (for example, Zero-Inflated eXtreme Gradient Boosted Trees Regressor). Note that not all model types have a zero-inflated counterpart.
Zero-inflated modeling considerations
When working with the zero-inflated model and/or feature list, keep the following in mind:
-
You can use the zero-inflated feature list to train on nonzero-inflated models and expect decent (if not optimum) performance.
-
If you use a different feature list to retrain a zero-inflated model, model performance may be poor since the model expects the target derived features in log scale.
Intra-month seasonality detection
Intra-month seasonality is the periodic variation that repeats in the same day/week number or weekday/week number each month. Detecting patterns in seasonality is important for building accurate models—how do you define the date needed from the previous month? Are you counting up from the beginning of the month or down from the end?
Some examples:
| Repeat patterns | Time unit | Example |
|---|---|---|
| Same day of month | Day | A payment is due on a specific day of the month— "payment due on the 15th." |
| Same week of month and day of week | Day | Payday is on a certain position within the month—"payday is the second Friday." |
| Week of month | Week | High sales for a retail dataset the last week of each month—"sales quota for the month is calculated on the last day." |
To provide better handling of seasonality, DataRobot detects and generates appropriate feature lists and then resulting features. These additions are based on whether, when executing the feature engineering that creates the modeling dataset, DataRobot detects intra-month seasonality and a Feature Derivation Window greater than a certain threshold. The feature lists run by Autopilot are based on the characteristics of the data, as described in the table below.
Note
"FDW covers at least X days" is equal to fdw_end - fdw_start >= X.
| Condition | Description | Example |
|---|---|---|
| With Differencing (monthly) | ||
| Detected intra-month seasonality and feature derivation window covers at least 31 days |
|
Use the first Nth day of the previous month target value as the prediction of the first Nth day of current month—March 5th will use the target value of Feb 5th. Or, in the case of March 30th, the list will use the value of Feb 28 (the last day of February). |
| With Differencing (monthly, same day from end) | ||
| Detected intra-month seasonality and minimum feature derivation window covers at least 31 days |
|
|
| With Differencing (monthly, same day of week, same week from start) | ||
| Detected intra-month seasonality, FDW start ≥ 35, FDW end ≤ 21, FDW window covers at least 29 days |
|
Use the target of the first X-day of last month as the prediction of the first X-day of the current month—March 5th (Monday) will use the target value of the February Monday that falls between February 1-7. |
| With Differencing (monthly, same day of week, same week from end) | ||
| Detected intra-month seasonality, FDW start ≥ 35, FDW end ≤ 21, FDW window covers at least 29 days |
|
Use the target of the last X-day of last month as the prediction of the last X-day of current month—March 31st (Tuesday) will use the target value of the February Tuesday that falls between February 22-28. |
| With Differencing (monthly, average of previous month) | ||
| Detected intra-month seasonality, FDW start ≥ 62, FDW end ≤ 21, FDW window covers at least 29 days |
|
Use the average target value of the previous month as the naïve prediction of days in the next month—June 7 will use May 1-30 or the average target value of February as the naïve prediction of days in March. (Requires a longer FDW.) |
| With Differencing (monthly, average of same week of previous month) | ||
| Detected intra-month seasonality, FDW start ≥ 37, FDW end ≤ 21, FDW window covers at least 29 days |
|
Use the first week average of last month as the predictions of the first week of the current month--see below for detail. |
| With Differencing (monthly, average of nonzero values of previous month) | ||
| Detected intra-month seasonality, FDW start ≥ 62, FDW end ≤ 21, FDW window covers at least 29 days with minimum target value of 0 |
|
Use the average nonzero target value of February as the naïve prediction of days in March. |
| With Differencing (previous week of the month nonzero values average baseline) | ||
| Detected intra-month seasonality, minimum FDW start ≥ 37, maximum FDW end ≤ 21, FDW window covers at least 29 days with minimum target value of 0 |
|
Use weekly nonzero average of previous month--see below for detail. |
Monthly, average of same week from start of previous month
The following details calculations for naïve prediction for March:
-
Compute the weekly average from the start of the month:
- March 1-7 uses the average value of February 1-7...March 22-31 (last day of month) uses the average value of February 22-28. This feature is called
y (last month weekly average).
- March 1-7 uses the average value of February 1-7...March 22-31 (last day of month) uses the average value of February 22-28. This feature is called
-
Compute the weekly average from the end of the month:
- March 25-31 uses the average value of February 22-28...March 1-10 uses the average value of February 1-7. This feature is called
y (match end of the month) (last month weekly average).
- March 25-31 uses the average value of February 22-28...March 1-10 uses the average value of February 1-7. This feature is called
-
Compute the average of the above two features to calculate the naïve predictions of the current month:
- 0.5 *
y (last month weekly average)+ 0.5 *y (match end of the month) (last month weekly average)
- 0.5 *
Monthly, average nonzero values in same week from start
The following details calculations for naïve prediction for March for nonzero values:
-
Compute the weekly nonzero average from the start of the month:
- March 1-7 uses the nonzero average value of February 1-7...March 22-31 (last day of month) uses the nonzero average value of February 22-28. This feature is called
y (nonzero)(last month weekly average).
- March 1-7 uses the nonzero average value of February 1-7...March 22-31 (last day of month) uses the nonzero average value of February 22-28. This feature is called
-
Compute the weekly nonzero average from the end of the month:
- March 25-31 uses the nonzero average value of February 22-28...March 1-10 uses the nonzero average value of February 1-7. This feature is called
y (nonzero)(match end of the month) (last month weekly average).
- March 25-31 uses the nonzero average value of February 22-28...March 1-10 uses the nonzero average value of February 1-7. This feature is called
-
Compute the average of the above two features to compute the naïve predictions of the current month:
- 0.5 *
y (nonzero)(last month weekly average)+ 0.5 *y (nonzero)(match end of the month) (last month weekly average)
- 0.5 *