Multilabel modeling
Availability information
Availability of multilabel modeling is dependent on your DataRobot package. If it is not enabled for your organization, contact your DataRobot representative for more information.
Multilabel modeling is a kind of classification task that, while similar to multiclass modeling, provides more flexibility. In multilabel modeling, each row in a dataset is associated with one, several, or zero labels. One common multilabel classification problem is text categorization (e.g., a movie description can include both "Crime" and "Drama"):
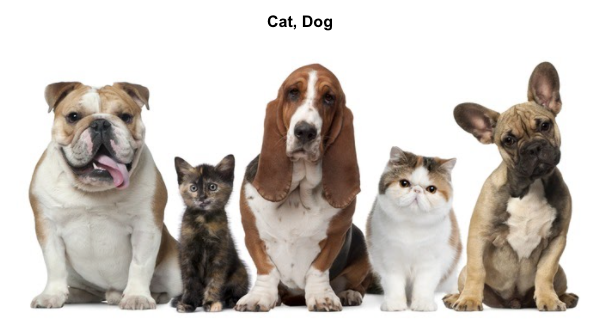
Another common multilabel classification problem is image categorization, where the image can fit into one, multiple, or none of the categories (cat, dog, bear).
See the considerations for working with multilabel modeling.
Deep dive: Supported data types for multivariate modeling
DataRobot supports the following strategies for multivariate modeling:
-
Multiclass: An extension to binary classification, it allows multiple classes for a feature, but only one can be applied at a time ("Am I looking at a cat? A dog?"). Predictions report probability for each class individually ("90% probability it's a dog but it could be a small bear"). Predictions for a row sum to 1.
-
Multilabel: A generalization of multiclass that provides greater flexibility. Each observation can be associated with 0, 1, or several labels ("Am I looking at a cat? A dog? A cat and a dog? At neither a cat nor a dog?"). Predictions report probability for each label in an observation and don't necessarily sum to 1.
-
Summarized categorical: A variable type used for features that host a collection of categories (for example, the count of a product by category or department). It aggregates categorical data and, while typically used for Feature Discovery, allows you to create the type in your dataset and use the unique visualizations.
The following table summarizes the feature types that support multivariate modeling:
| Data type | Description | Allowed as target? | Project type |
|---|---|---|---|
| Categorical | Single category per row, mutually exclusive | Yes | Multiclass |
| Multicategorical | Multiple categories per row, non-exclusive | Yes | Multilabel |
| Summarized categorical | Multiple categories per row, multiple instances of each category allowed | No | Multiregression* |
* Not currently supported
Create the dataset
To create a training dataset that can be used for multilabel modeling, include one multicategorical column. Note the following:
-
Multicategorical features are only supported when selected as the target. All others multicategorical features are ignored.
-
DataRobot supports creation of projects with any number of unique labels, using up to 1,000 labels in each multicategorical feature. There is no need to remove extraneous labels from the dataset as DataRobot will ignore them. Use the Feature Constraints advanced option to configured how labels are trimmed for modeling.
-
Label names must be strings of up to 60 ASCII characters; unicode characters of up to 60 bytes are supported.
-
Multiple occurrences of the same label are allowed, but the repeated label value is treated as a single occurrence (for example,
crime, drama, dramais treated ascrime, drama). -
When working with images and Visual AI, follow the guidelines for creating an image dataset and adding a categorical column for the multilabel feature.
Multicategorical row format
The format of a multicategorical row is a list of label names. The following table provides examples of valid and invalid multicategorical values:
| Example | Reason |
|---|---|
| Valid multicategorical values | |
[“label_1”, “label_2”] |
String format, with 2 relevant labels |
[“label_1”] |
String format, with 1 relevant label |
[] |
Label set for one row with no relevant labels |
| Invalid multicategorical values | |
[‘label_1’, ‘label_2’] |
Not a valid JSON list |
[1, 2] |
Label names are not strings |
When creating a CSV file with multicategorical features, be sure to properly escape special characters. Note that the comma (,) is the default delimiter; the double quotes symbol (“) is the default escape character. Additionally:
- Multicategorical values must be enclosed by double quotes in CSV files.
- Double quotes enclosing label names must be escaped by double quotes.
A valid representation of a multicategorical feature in a CSV file looks as follows:
“[“”label_1””, “”label_2””]”
The double quotes outside the list brackets escape the actual value, so the comma within the list is not interpreted as a delimiter. Additionally, double quotes around “label_1” and “label_2” are needed to escape the double quotes following them.
The recommended way to generate CSVs with multicategorical features using Python is to create a pandas DataFrame, in which multicategorical feature values are represented by lists of strings (i.e., one multicategorical row is a list of label names represented by strings). Then, JSON-encode the multicategorical column and use pandas DataFrame.to_csv to generate the CSV file. Pandas will take care of proper escaping when generating the CSV.
Code snippet: create a four-row dataset
The following code snippet shows how to create a four-row dataset with numeric and multicategorical features:
import json

import pandas as pd

multicategorical_values = [["A", "B"], ["A"], ["A", "C"], ["B", "C"]]

df = pd.DataFrame(
    {
        "numeric_feature": [1, 2, 3, 4],
        "multicategorical_feature": multicategorical_values,
    }
)

df["multicategorical_feature"] = df["multicategorical_feature"].apply(json.dumps)

df.to_csv("dataset.csv", index=False)
Multicategorical feature validation
DataRobot runs feature validation at multiple stages to ensure correct row format:
-
EDA1: If a feature is detected as potentially multicategorical (meaning at least one row has the right multicategorical format), DataRobot runs multicategorical format validation on a sample of rows. Any invalid multicategorical rows are reported as multicategorical format errors in the Data Quality Assessment tool.
-
EDA2: If the feature passes EDA1 without multicategorical format errors and is selected as the target, DataRobot runs target validation on all rows. If any format errors are detected, a project creation error modal appears and the project is cancelled. Expand the Details link in the modal to see the format issues and required corrections. Once you fix the errors, re-upload the data and try again.
How could it pass EDA1 and fail EDA2?
If the dataset is over 500MB, DataRobot runs EDA1 on a sample (this is not specific to multilabel). From the EDA sample, DataRobot then randomly samples 100 rows and checks for anything meeting the multicategorical format. If there is at least one valid multicategorical feature, DataRobot checks the entire EDA sample. During target validation, DataRobot checks the entire dataset. As a result, it is possible that an invalid feature can pass EDA1 and then error when the entire dataset is evaluated.
How DataRobot detects multilabel
All labels in a row comprise a "label set" for that row. The objective of multilabel classification is to accurately predict label sets, given new observations. When, during EDA1, DataRobot detects a data column consisting of label sets in its rows, it assigns that feature the variable type multicategorical. When you use a multicategorical feature as the target, DataRobot performs multilabel classification.
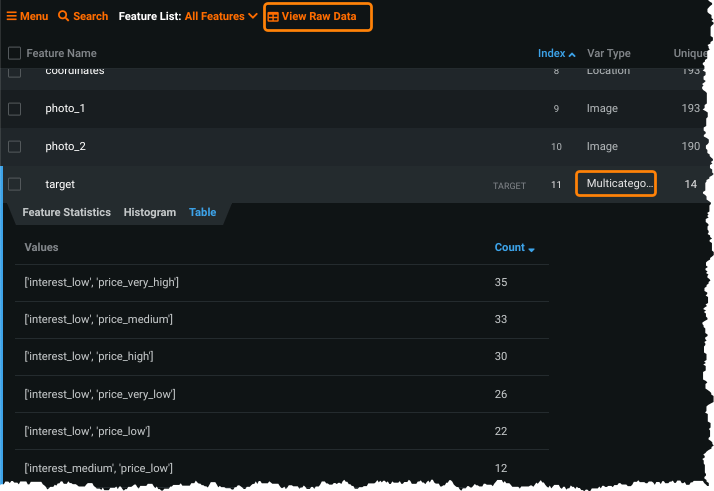
Labels are not mutually exclusive; each row can have many labels, and many rows can have the same labels. From the Data page, view the top 30 unique label sets in a multicategorical feature:
To see the label sets in the context of the dataset, use the View Raw Data button.
Once you have uploaded the dataset and EDA1 has finished, scroll to the feature list and expand a feature showing the variable type Multicategorical to see details. The associated tabs, which provide insights about label distribution and interactions, are described below.
Feature Statistics tab
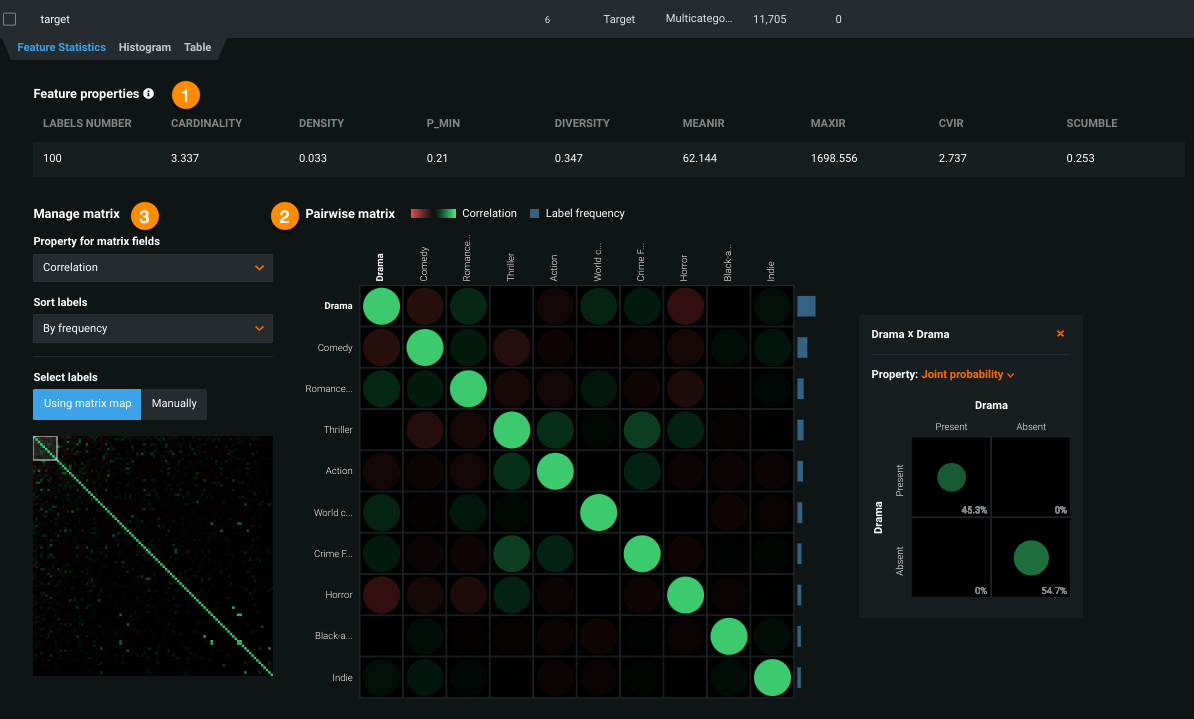
The Feature Statistics tab, available for multicategorical-type features, is comprised of several parts, described in the table below.
| Element | Description | |
|---|---|---|
| 1 | Feature properties | Provides overall multilabel dataset characteristics. |
| 2 | Pairwise matrix | Shows pairwise statistics for pairs of labels. |
| 3 | Matrix management | Provides filters for controlling the matrix display. |
Note that the statistics in the Feature Statistics tab are not exact—they only reflect the dataset properties of the sample used for EDA.
Feature properties
The Feature Properties statistics report provides overall multilabel dataset characteristics.
| Field | Description | From the example |
|---|---|---|
| Labels number | Number of unique labels in the target. | 100 unique labels |
| Cardinality | Average number of labels in each row. | On average, each row has 3 labels |
| Density | Percentage of all unique labels present, on average, in each row. | Roughly 3% of the total labels are present, on average, in each row |
| P_min | Fraction of rows with only 1 label. | 21% of rows have only 1 label |
| Diversity | Fraction of unique label sets with respect to the max possible. | Only roughly 35% of all possible label sets are present in the data |
| MeanIR (Mean Imbalance Ratio)* | Average label imbalance compared to the most frequent label. The higher the value, the more imbalanced are the labels, on average, compared to the most frequent label. | On average, labels are highly imbalanced |
| MaxIR (Max Imbalance Ratio)* | Highest label imbalance across all labels. | Some extremely imbalanced labels present |
| CVIR (Coefficient of Variation for Average Imbalance Ratio)* | Label imbalance variability. Indicates whether a label imbalance is concentrated around its mean or has significant variability. | Imbalance varies significantly across labels |
| SCUMBLE** | Measure of concurrence between frequent and rare labels. A high scumble means the dataset is harder to learn. | Concurrence is high |
* The imbalance measures follow Charte, F., Rivera, A.J., del Jesus, M.J., Herrera, F.: Addressing imbalance in multilabel classification: Measures and random resampling algorithms. Neurocomputing 163, 3–16 (2015).
** SCUMBLE follows the definition in Francisco Charte, Antonio J. Rivera, Maria J. del Jesus, Francisco Herrera: Dealing with Difficult Minority Labels in Imbalanced Multilabel Data Sets.
Pairwise matrix
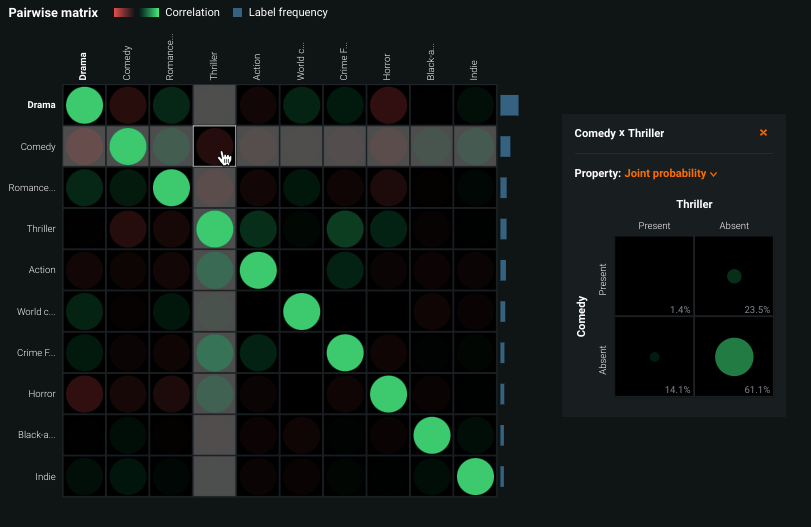
The pairwise matrix shows pairwise statistics for pairs of labels and the occurrence percentage of each label in the dataset. From here you can:
- Check individual label frequencies.
- Visualize pairwise correlation.
- Visualize pairwise joint probability.
- Visualize pairwise conditional probability.
The larger matrix provides an overview of every label pair found for the selected target; the mini-matrix to the right shows additional detail for the selected label pair. The matrix is a table, showing the relationships between labels. The variables in the mini-matrix are two labels—one label whose state (present, absent) varies along the X-axis and the other whose state varies along the Y-axis. For the full matrix, the state does not vary (always present); only the labels vary.
Matrix management
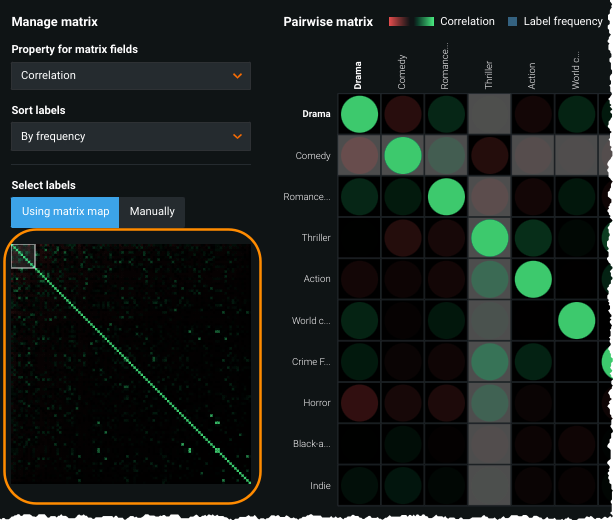
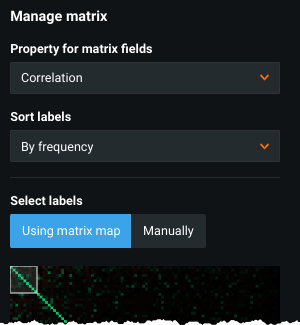
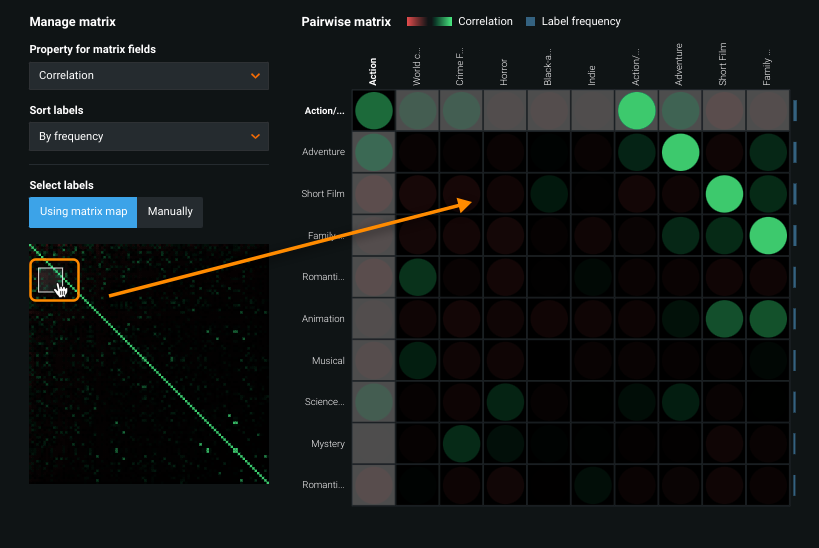
In datasets with more than 20 labels, an additional matrix map displays to the left of the main matrix. Click any point in the map to refocus the main matrix to that area (where the labels you want to investigate converge). The mini-matrix changes to provide more detailed information about the pair. Or, use the dropdowns, described below, to control the matrix display.
Color indicates the value of the property selected in the Property for matrix fields dropdown. For example, if you select "correlation", the color of a matrix cell represents the correlation between the label pair for the selected cell—red represents negative values, green represents positive values. Of the three properties that can be selected (correlation, joint probability, and conditional probability), only correlation can have negative values (red circles can never occur for joint or conditional probability). The blue bars that border the right side of the matrix represent numeric frequency of the label in the corresponding row.
You can change the order of labels in the matrix using one of the sort tools on the left:
| Sort option | Description |
|---|---|
| Property for matrix fields | Sets the property to be displayed in the matrix: correlation, joint probability, or conditional probability. (See descriptions below.) |
| Sort labels | Changes the label ordering to be based alphabetically, by frequency, or by imbalance. |
| Label selection | Select label names either by map or manually. |
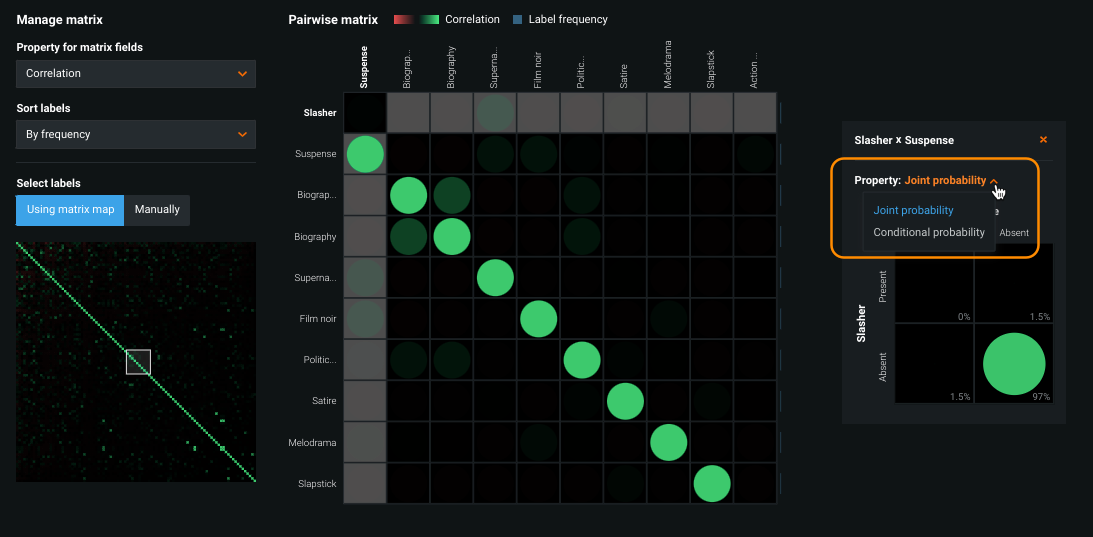
In the mini-matrix on the right, set the Property dropdown to view measures of joint probability or conditional probability:
See the Confusion Matrix documentation for a general description of working with this type of matrix.
Additionally, you can select a label name—either using the map or manually to highlight the label in the main matrix.
Select labels by map
You can modify the labels displayed in the pairwise matrix based on the matrix map. Simply click at any point in the map and the main and mini-matrix update to reflect your selection. The square marked in the map shows what the larger matrix represents:
Select labels manually
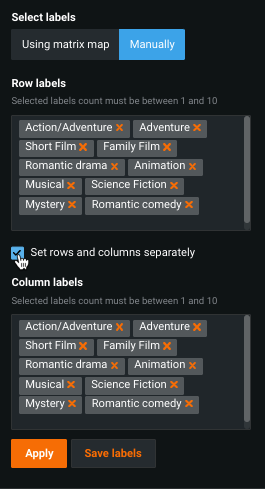
You can manually set the labels that display in the pairwise matrix to match whatever combinations are of interest. You can also save the combinations as a named list to apply and compare after experimentation.
To select labels:
-
Under Select labels, choose Manually.
-
Check or uncheck the box to set rows and columns separately.
-
Each row or column input field defaults to the top 10 labels, determined by label frequency. Add or remove labels as desired, making sure to have between 1 and 10 labels for each option.
- To add, begin typing characters and any matching labels not already present are available for selection.
- To remove, click the x next to the label name.
-
Once you created the matrix as desired, click Save labels to save the label selection for reuse.
-
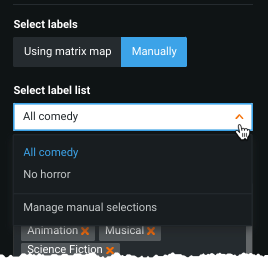
If any label lists have been saved, an additional dropdown becomes available allowing you to select a list:
-
To manage saved lists, select Manage manual selections from the dropdown. From there you can edit the list name or remove the list.
Matrix display selectors
The following describes joint probability of two labels, conditional probability of two labels, and correlation.
This selection answers the question "How frequent are the different configurations of the co-occurrence of the labels?"
For example, given two labels A and B, there are four different configurations of their co-occurrence in the data rows:
Ais present,Bis presentAis present,Bis absentAis absent,Bis presentAis absent,Bis absent.
The joint probability is the probability of each of those events. For example, if the probability that A is present and B is absent is reported at 0.25, it means that in 25% of all rows in the dataset, A is present and B is absent.
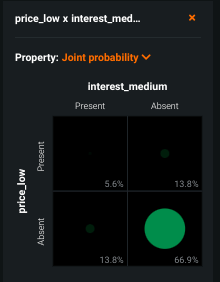
The pairwise statistics insight in the main matrix shows only the joint probability of both selected labels being present. In the mini-matrix, the cells show the joint probability of each co-occurrence configuration. For example, in the following:
The probability of interest_medium being present and price_low being absent is 13.8%, which means that in 13.8% of all rows, interest_medium is absent and price_low is present simultaneously.
A dataset has labels A and B. Consider all rows in the dataset in which B is present. In some of them, A is present, in others, A is absent. For example, the dataset may have rows:
[A, B]
[B]
[A]
[A]
There are two rows containing B. In one of the rows, A is also present. This defines the conditional probability of A given that ("on the condition that") B is present:
P(A present | B present)
In the case above, the probability is 0.5: Out of two rows with B, A is in one row. B being present is the base condition, A being present is the event whose conditional probability, given the condition, you are interested in.
In this example, there can be four different configurations of (event, condition):
P(A present | B present)
P(A present | B absent)
P(A absent | B present)
P(A absent | B absent)
The main matrix shows only P(A present | B present); the mini-matrix shows all configurations in the correspondent cells.
Correlation, in general, is a measure of linear dependence between two random variables. In this case, the variables are the labels—A and B. Think of each label as a binary variable, where "0 = label is absent" (a "low" value) and "1 = label is present" (a "high" value). Correlation between A and B then shows the relation between the respective high and low values of A and high and low values of B.
What is the trend in simultaneous appearances of 1s in A and 1s in B (or 0s in A and 0s in B)? If the greater number of rows have A=1 and B=1 or A=0 and B=0, then A and B have a positive correlation.
Examples:
- If label
Ais 1 (present) in all rows whereBis 1 (present), and 0 (absent) in all rows whereBis 0 (absent), then correlation between them is 1 (the highest possible value of correlation). In other words, if in the greater number of rows A=1 and B=1 (or A=0 and B=0), then A and B have a positive correlation. - If
Ais 0 in the rows whereBis 1, andAis 1 in the rows whereBis 0, then correlation is -1 (the lowest possible value). That is, the trend is the opposite of positive correlation (high values ofAcorrespond to low values ofB), then correlation is negative. - If there is no trend, then correlation is 0.
Between these extremes, correlation shows how the high ("1") and low ("0") values of A come together with high/low values of B.
In the case of binary variables, correlation is similar to joint probability but is more easily interpretable. (It can be easily calculated from the joint probability of both labels being 1 and the expectation of both labels being 1, but is not the same.) Note that there is no 2x2 matrix for correlation. This is because correlation of two variables results in a single number that summarizes information from all four configurations (low-low, low-high, high-low, high-high). The 2x2 matrix, however, shows properties that require four numbers to fully describe them.
Histogram tab
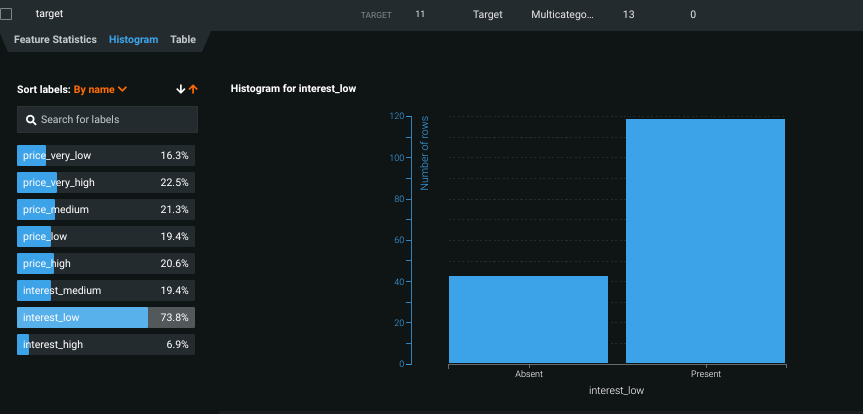
The Histogram provides a bar plot that indicates, for the selected label, the frequency (by number of rows) with which the label is present or absent in the data. Use the histogram to detect imbalanced labels.
Select a label from the list to display its histogram. You can sort labels by name, frequency, or imbalance. Use the imbalance option, for example, to find the most imbalanced label in your dataset.
See documentation for the Histogram for a general description of working with histograms.
Table tab
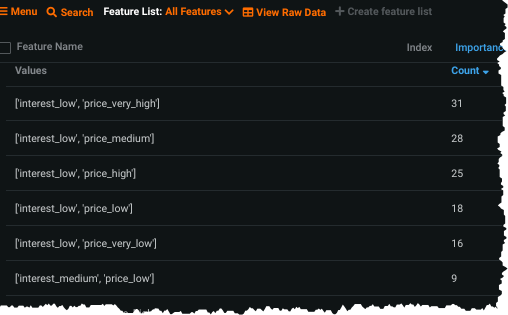
The Table tab lists up to the 30 most frequent label sets:
Building and investigating models
Building multilabel models uses the standard DataRobot build process:
- Upload a properly prepared dataset (or open from the AI Catalog).
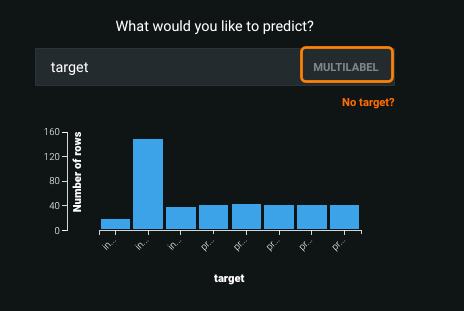
- From the Data page, find a multicategorical feature (search if necessary) and select it as the target.
- Open the Advanced options > Additional tab and choose a metric, either LogLoss (default), AUC, AUPRC or their weighted versions. Set any other selections.
- Select a mode—Autopilot, Quick, or Manual—and begin modeling.
Leaderboard tabs
Multilabel-specific modeling insights are available from the following Leaderboard tabs:
- Evaluate:
- Understand:
Additionally, you can use Feature Impact to understand which features drive model decisions.
Per-Label Metrics
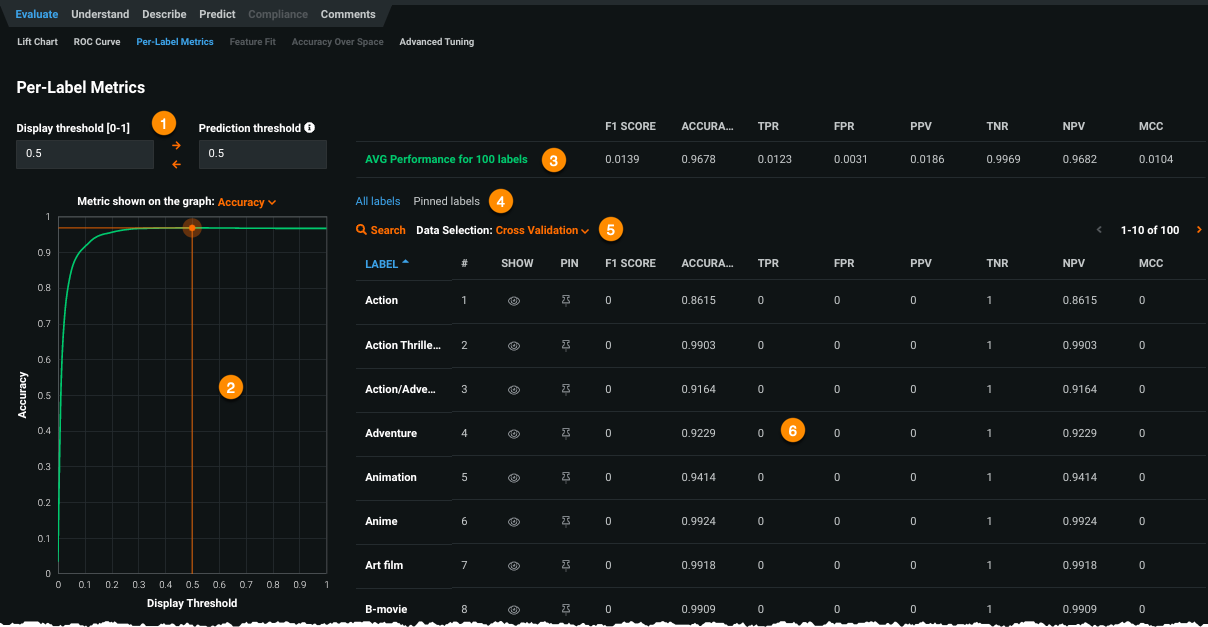
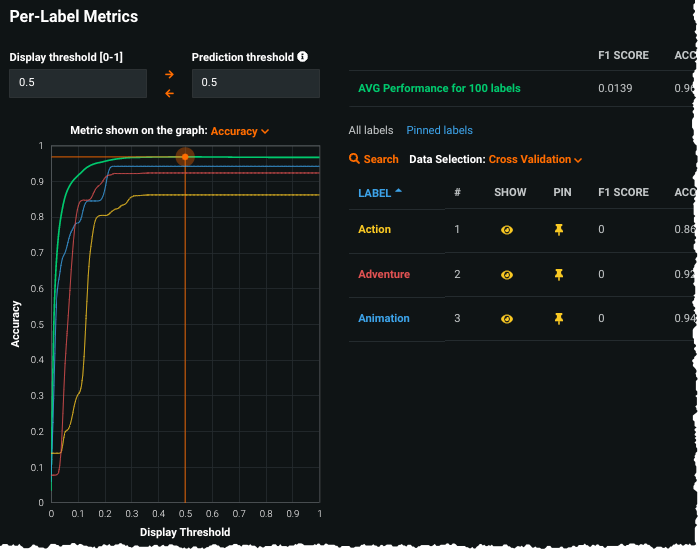
Multilabel: Per-Label Metrics is a visualization designed specifically for multilabel models. It helps to evaluate a model by summarizing performance across the labels for different values of the prediction threshold (which can be set from the visualization page). The chart depicts binary performance metrics, treating each label as a binary feature. Specifically it:
- Displays average and per-label model performance, based on the prediction threshold, for a selectable metric.
- Helps to assess the number of labels performing well versus the number of labels performing badly. You can see detailed description of the metrics depicted here under ROC Curve Metrics.
| Component | Description | |
|---|---|---|
| 1 | Threshold selector | Sets prediction and display thresholds settings. |
| 2 | Metric value chart and metric selector | Displays graphed results based on the set display threshold; provides a dropdown to select the binary performance metric. |
| 3 | Average performance report | The macro-averaged model performance over all labels. |
| 4 | Label selector | Sets the display to all or pinned labels. |
| 5 | Data selector | Chooses the data partition to report per-label values for. |
| 6 | Metric value table | Displays model performance for each target label. |
Metric value table
The metric value table reports a model's performance for each target label (considered as a binary feature). You can work with the table as follows:
-
The metrics in the table correspond to the Display threshold; change the threshold value to view label metrics at different threshold values.
-
Click on a column header to change the sort order of labels in the table.
-
Click the eye icon (
 ) in the SHOW column to include (and remove) a label from the metric value chart.
 -
Use the search field to search for particular labels in the table.
-
The ID column (#) is static and allows you to assess, together with sorting, the labels for which the metric of interest is above or below a given value.
For example, consider a project with 100 labels. If measuring for accuracy above 0.7, sort by accuracy and look at the row index with the last accuracy value above 0.7. You can determine the percentage of labels with that accuracy or above from the row index with relation to the total number of rows.
Metric value chart
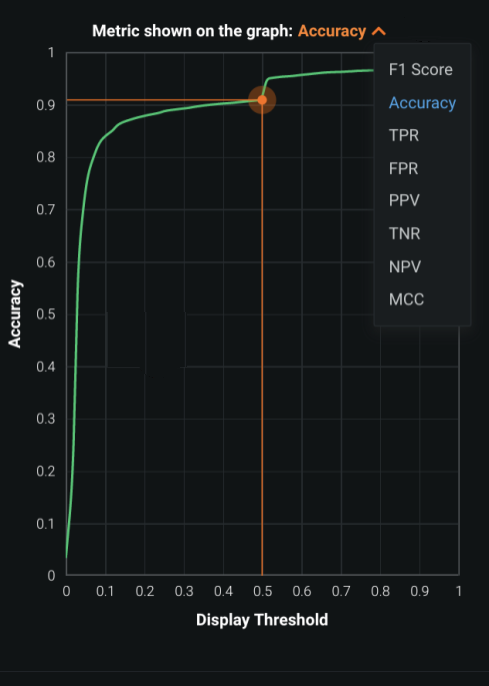
The chart consists of a graphed results and a metric selector:
The X-axis in the diagram represents different values of the prediction threshold. The Y-axis plots values for the selected metric. Overall, the diagram illustrates the average model performance curve, based on the selected metric, as a bold green curve. The threshold value set in the Display threshold is highlighted as a vertical orange line.
Set label display
You can change the display to reflect labels of particular importance ("pinned" labels) by clicking the checkbox to the left of the label name:
The Pinned labels tab shows all labels you have selected to be of particular importance. If no labels have been pinned, you are prompted to return to All labels where you can click to pin labels.
To pin a label, select the pin icon (![]() ) in the PIN column. Each pinned label is added to the metric value chart. Note the following:
) in the PIN column. Each pinned label is added to the metric value chart. Note the following:
- The color of the label name changes to match its line entry in the chart.
- You can remove a label from the chart by clicking the eye icon (
 ) in the SHOW column.
As labels are added, they become available under the Pinned labels tab:
Threshold selector
The threshold section provides a point for inputting both a Display threshold and a Prediction threshold.
| Use | To |
|---|---|
| Display threshold | Set the threshold level. Changes to the value both update the display and the metric value table to the right, which shows average model performance. |
| Prediction threshold | Set the model prediction threshold, which is applied when making predictions. |
| Arrows | Swap values for the current display and prediction thresholds. |
Data selector
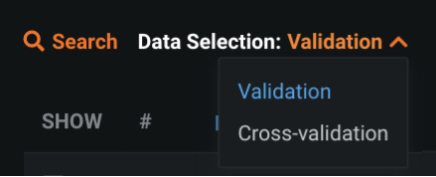
Select the dataset partition—validation, cross validation, or holdout (if unlocked)—that the metrics and curves in the chart and table are based on.
ROC Curve
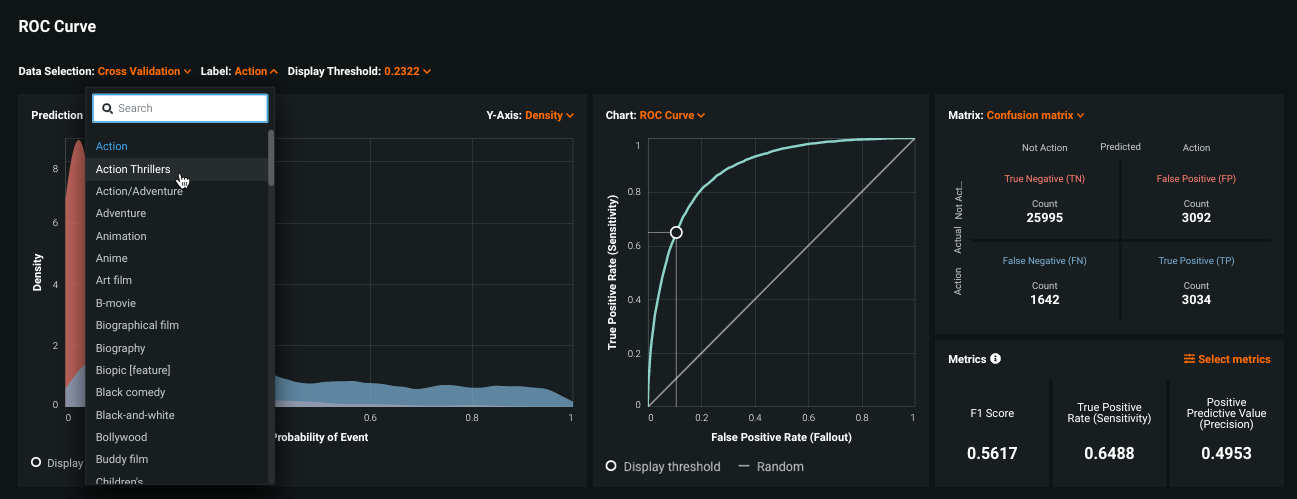
Functions of the ROC Curve are the same for binary classification and multilabel projects. For binary, the tab provides insight for the binary target. With multilabel projects, using a Label dropdown, you can view insights for the target label separately.
Changing the label updates the page elements, including the graphs, the summary statistics, and confusion matrix.
Prediction thresholds can be set manually or can be set to maximize F1 or MCC. The selected threshold is applied to all labels; there is no individual per-label application.
Lift Chart
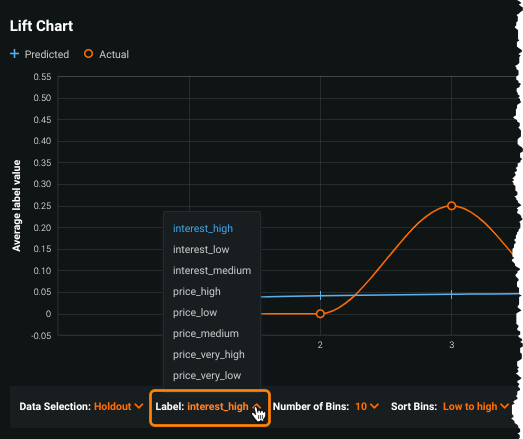
Use the Lift Chart to compare predicted versus actual values of the multilabel target. It functions and provides the same selectors as the binary Lift Chart, with the addition of the ability to select the desired label:
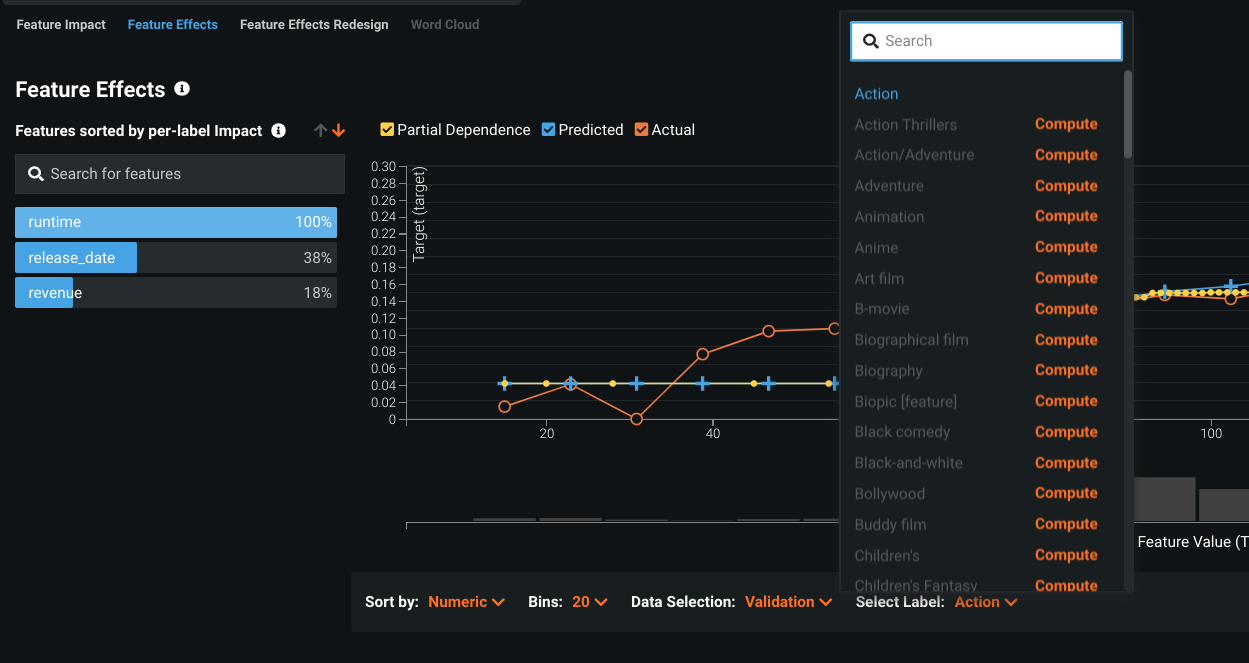
Feature Effects
Feature Effects ranks dataset features based on their feature impact score. With multilabel modeling, all standard Feature Effects options are available as well as some additional functionality. Clicking Compute Feature Effects causes DataRobot to first compute Feature Impact (if not already computed for the project) and then run the Feature Effects calculations for the model:
After computation completes, select a label to view partial dependence as well as predicted and actual values. These views are available for all calculated numeric and categorical features.
For labels that were not computed as part of the initial calculations, use Select label to individually compute them.
Making predictions
Deploy multilabel classifiers with one click, as usual, and integrate predictions to your workflow via the real-time deployment API. Additionally, you can download the output to see the results for each label in the dataset. That is, for each row, output shows both the prediction of the labels being relevant in that row and each label's score for that row.
Feature considerations
Consider the following when working with multilabel models:
-
Time-aware (time series and OTV) modeling is not supported.
-
DataRobot supports the creation of projects with any number of unique labels, using 2-1,000 labels in each multicategorical feature. Multilabel insights reflect only the 100 (after trimming settings are applied) most frequent labels.
-
Multicategorical features are only supported as the target feature. To use a multicategorical as a non-target modeling feature, convert the values to summarized categorical before uploading the dataset.
-
Because the size of predictions is proportional to the number of labels, the number of rows that can be used for real-time predictions decreases with the number of labels.
-
Target drift and accuracy tracking is not supported for multicategorical targets.
-
The following model types are available:
- Decision Tree Classifier
- Ridge Classifier
- Random Forest Classifier
- Extra Trees Classifier
- Multilabel kNN
- One-vs-all LGBM
- Selected Keras models
- Majority Class Classifier
-
The following are not supported:
- Scoring Code
- Challenger models
- Image augmentation
- Agents
- Prediction Explanations
- Stratified partitioning
- Monotonic constraints
- Offsets
- Currency data types
- Export of ROC charts
- External holdout
- Compliance documentation generation

