Text Prediction Explanations
DataRobot has several visualizations that help to understand which features are most predictive. While this is sufficient for most variable types, text features are more complex. With text, you need to understand not only the text feature that is impactful, but also which specific words within a feature are impactful.
Text Prediction Explanations help to understand, at the word level, the text and its influence on the model—which data points within those text features are actually important.
Text Prediction Explanations evaluate n-grams (contiguous sequences of n-items from a text sample—phonemes, syllables, letters, or words). With detailed n-gram-based importances available to explore after model building (as well as after deploying a model), you can understand what causes a negative or positive prediction. You can also confirm that the model is learning from the right information, does not contain undesired bias, and is not overfitting on spurious details in the text data.
Consider a movie review. Each row in the dataset includes a review of the movie, but the review column contains a varying number of words and symbols. Instead of saying simply that the review, in general, is why DataRobot made a prediction, with Text Prediction Explanations you can identify on a more granular level which words in the review led to the prediction.
Text Prediction Explanations are available for both XEMP and SHAP. While the Leaderboard insight displays quantitative indicators in a different visual format, based on different calculation methodologies, the specific explanation modal is largely consistent (and is described below).
Access text explanations
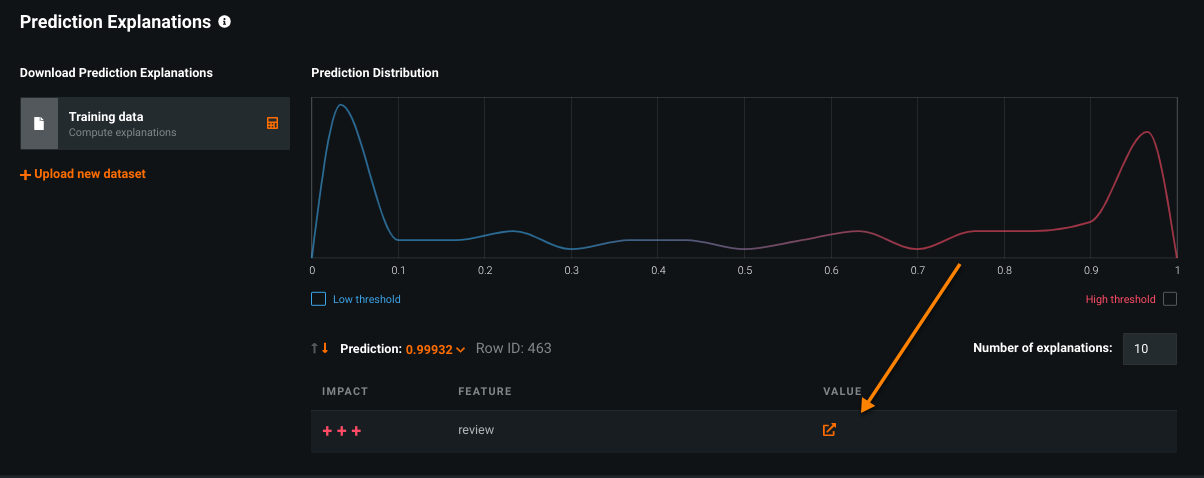
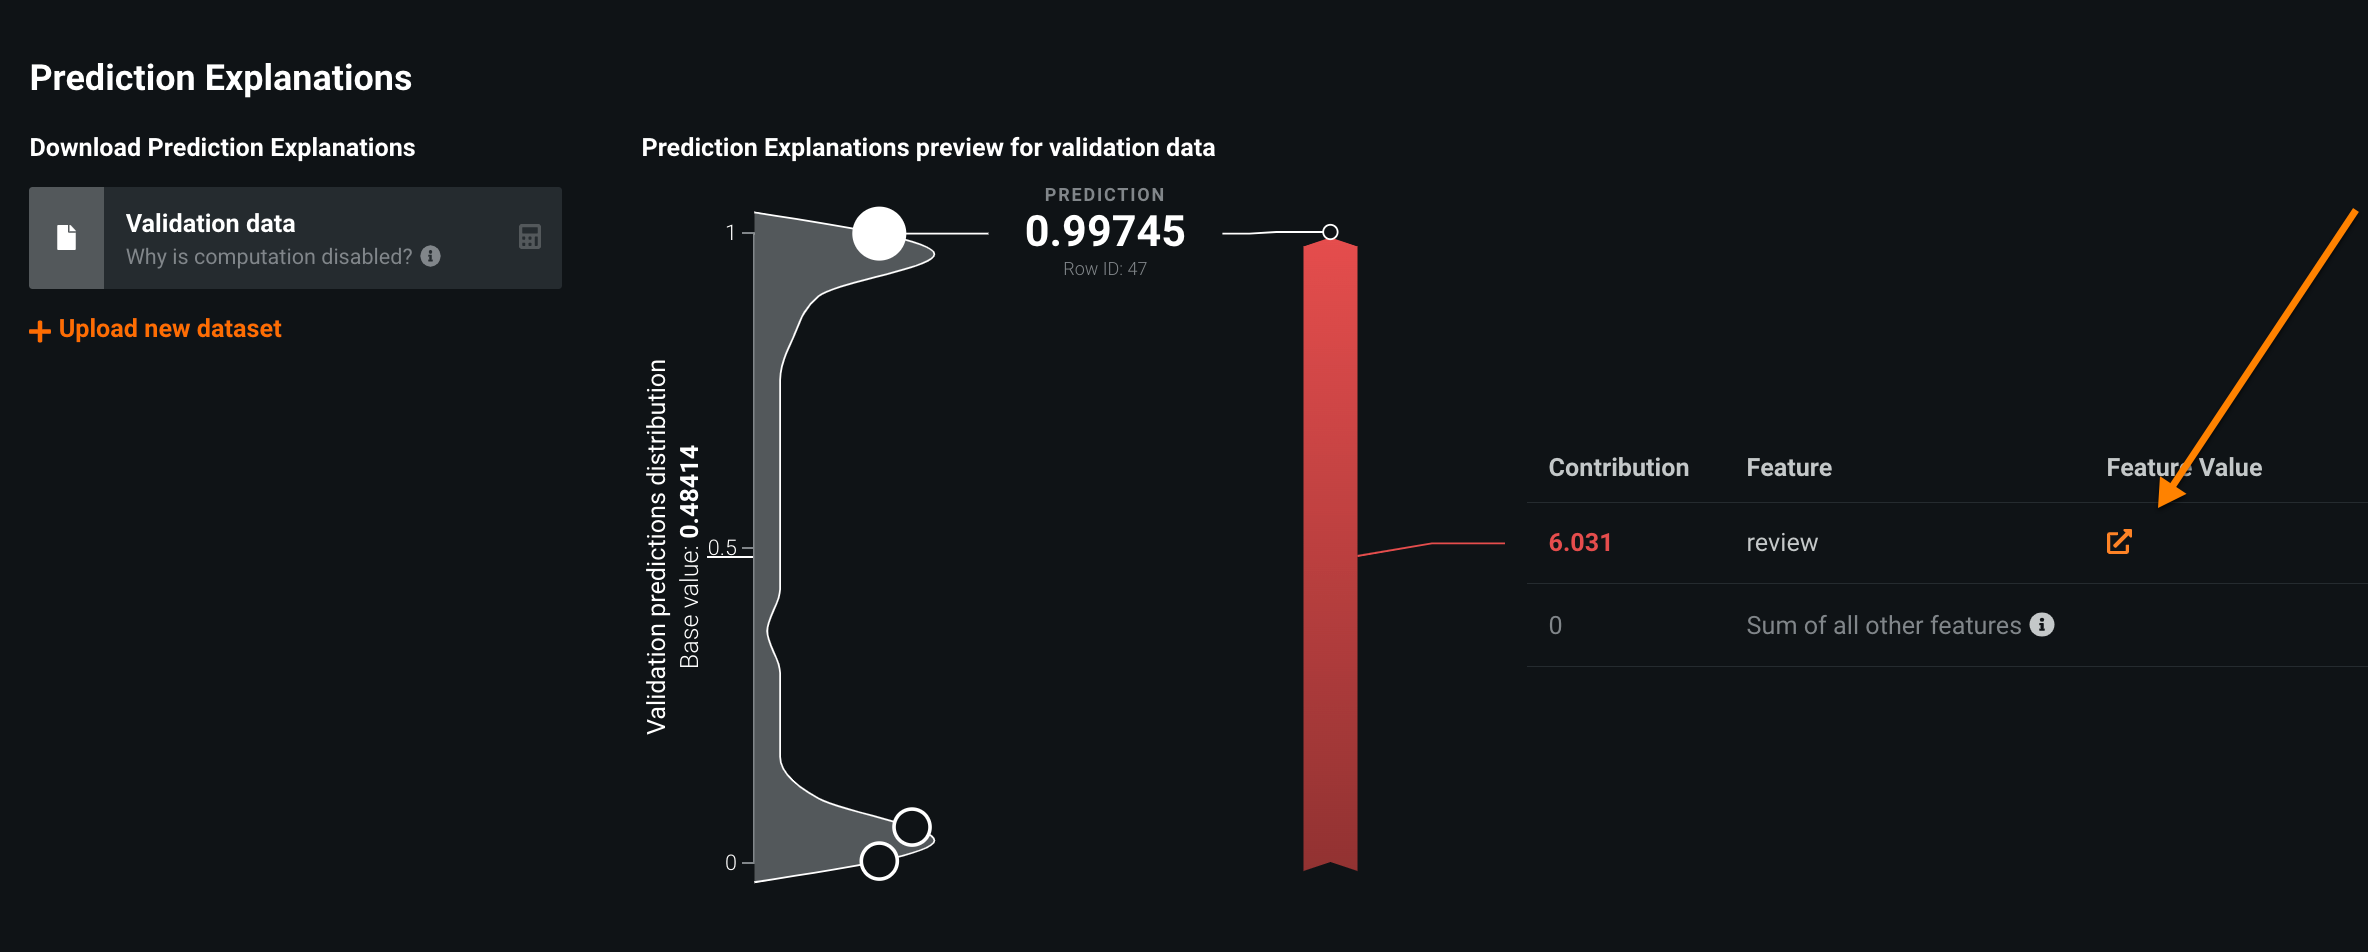
Access either XEMP-based or SHAP Prediction Explanations from a Leaderboard model's Understand > Prediction Explanations tab. Functionality is generally the same as for non-text explanations. However, instead of showing the raw text in the value column, you can click the open (![]() ) icon to access a modal with deeper text explanations.
) icon to access a modal with deeper text explanations.
For XEMP:
For SHAP:
View text explanations
Once the modal is open, the information provided is the same for both methodologies, with the exception of one value:
- XEMP reports an impact of the explanation’s strength using
+and-symbols. - SHAP reports the contribution (how much is the feature responsible for pushing the target away from the average?).
Understand the output
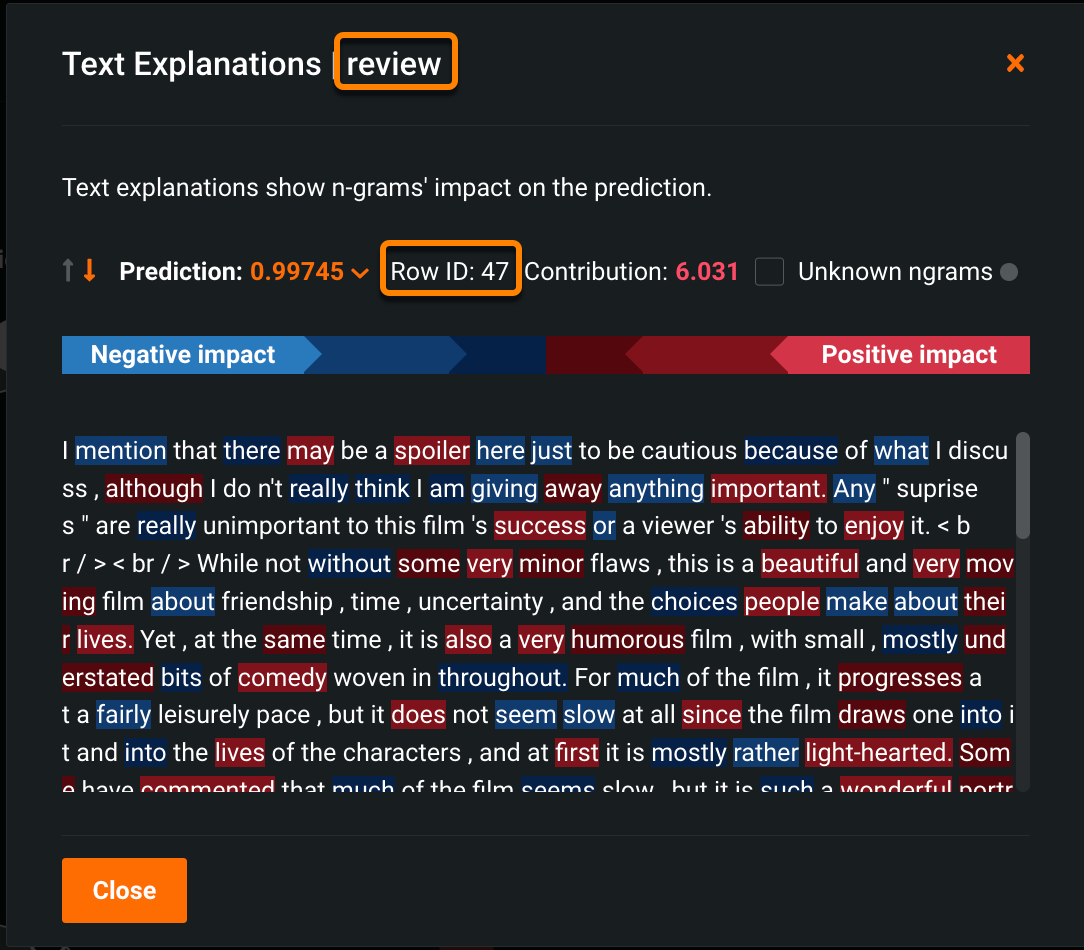
Text Explanations help to visualize the impact of different n-grams by color (the n-gram impact scores). The brighter the color, the higher the impact, whether positive or negative. The color palette is the same as the spectrum used for the Word Cloud insight, where blue represents a negative impact and red indicates a positive impact. In the example below, the text shown represents the content of one row (row 47) in the feature column "review."
Hover on an n-gram and notice that the color is emphasized on the color bar. Use the scroll bar to view all text for the row and feature.
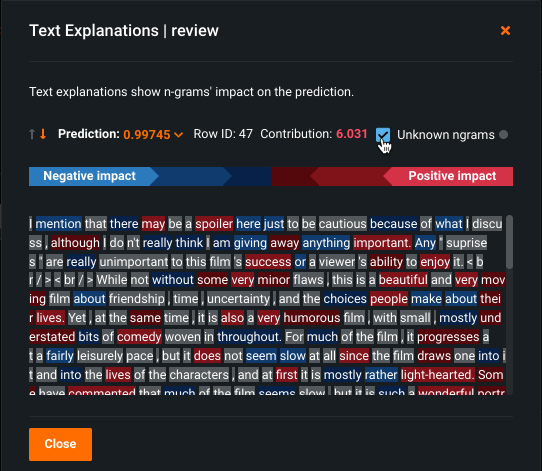
Check the Unknown ngrams box to easily determine (via gray highlight) those n-grams not recognized by the model (most likely because they were not seen during training). In other words, the gray-highlighted n-grams were not fed into the modeler for the blueprint.
Showing Unknown ngrams helps prevent the misinterpretation of a model's usefulness in cases where tokens are shown to be neutrally attributed when they are expected to have either a strong positive attribute or a strong negative attribute. The reason for that is, again, because the model did not see them during training.
Note
Text is shown in its original format, without modification by a tokenizer. This is because a tokenizer can distort the original text when run through preprocessing. These modifications can render the explanation distorted as well. Additionally, for Text Prediction Explanations downloads and API responses, DataRobot provides the location of each ngram token using starting and ending indexes with reference to the text data. This allows you to replicate the same view externally, if required. In Python, when data is text, use (text[starting_index: ending_index]) to return the referenced text ngram token.
Compute and download predictions
Compute explanations as you would with standard Prediction Explanations. You can upload additional data using the same model, calculate explanations, and then download a CSV of results. The output for XEMP and SHAP differs slightly.
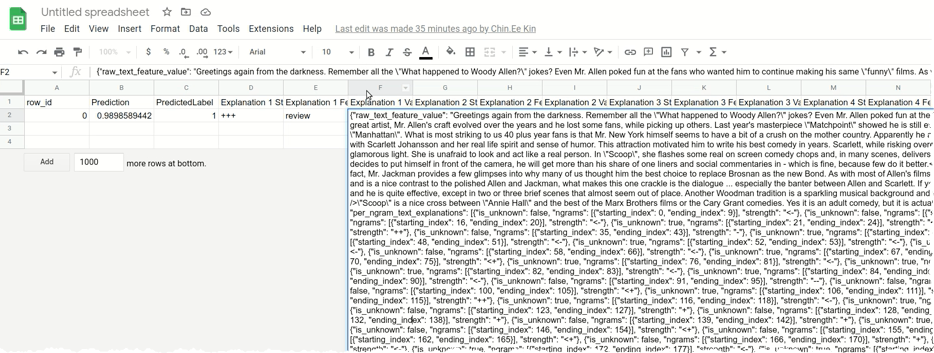
XEMP Text Explanations downloaded
After computing, you can download a CSV that looks similar to:
The JSON-encoded output of the per-n-gram explanation contains all the information needed to recreate what was visible in the UI—attribution scores, impact symbols—according to starting and ending indexes. The original text is included as well.
View the XEMP compute and download documentation for more detail.
SHAP Text Explanations downloaded
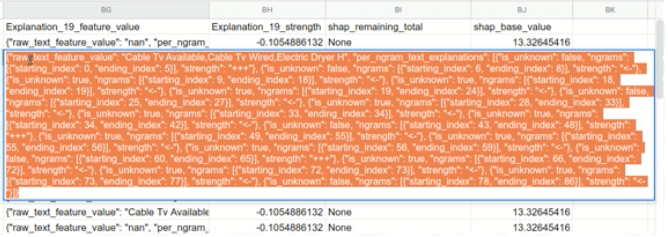
Download SHAP text explanations also show the information described above for XEMP downloads. When there is a row with no value, Text Explanations returns:
Compare this to a row with JSON-encoded data:
View the SHAP compute and download documentation for more detail.
Explanations from a deployment
When you calculate predictions from a deployment (Deployments > Predictions > Make Predictions), you:
- Upload the dataset.
- Toggle on Include prediction explanations.
- Check the Number of ngrams explanations box to make available CSV output that includes Text Explanations.
From the Prediction API tab, you can generate text Explanations for using scripting code from any of the interface options. In the resulting snippet, you must enable:
maxExplanationsmaxNgramExplanations
Additional support
Text Explanations are supported for a deployed model in a Portable Prediction Server. They are exported as an mlpkg file, where the language data associated with the dataset is saved.
If the explanations are XEMP-based, they are supported for custom models and custom tasks.
