Time series applications
With No-Code AI Apps, you can create Predictor and What-if applications from time series deployments—single series and multiseries. Time series deployments require additional setup before creating an application and offer unique insights to time series use cases, including creating simulations that visualize how adjusting known in advance features affects a forecasted prediction and comparing predicted vs. actuals for a given time range.
Configure a time series deployment
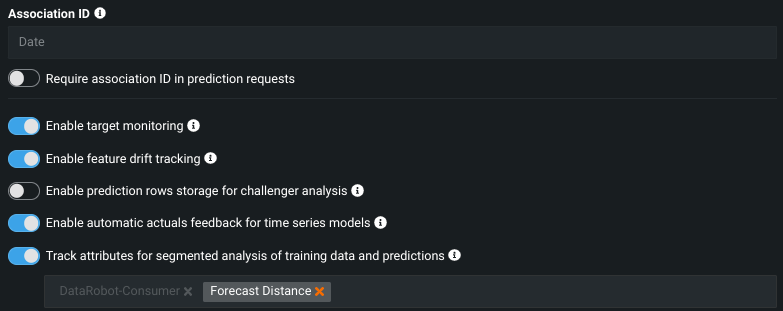
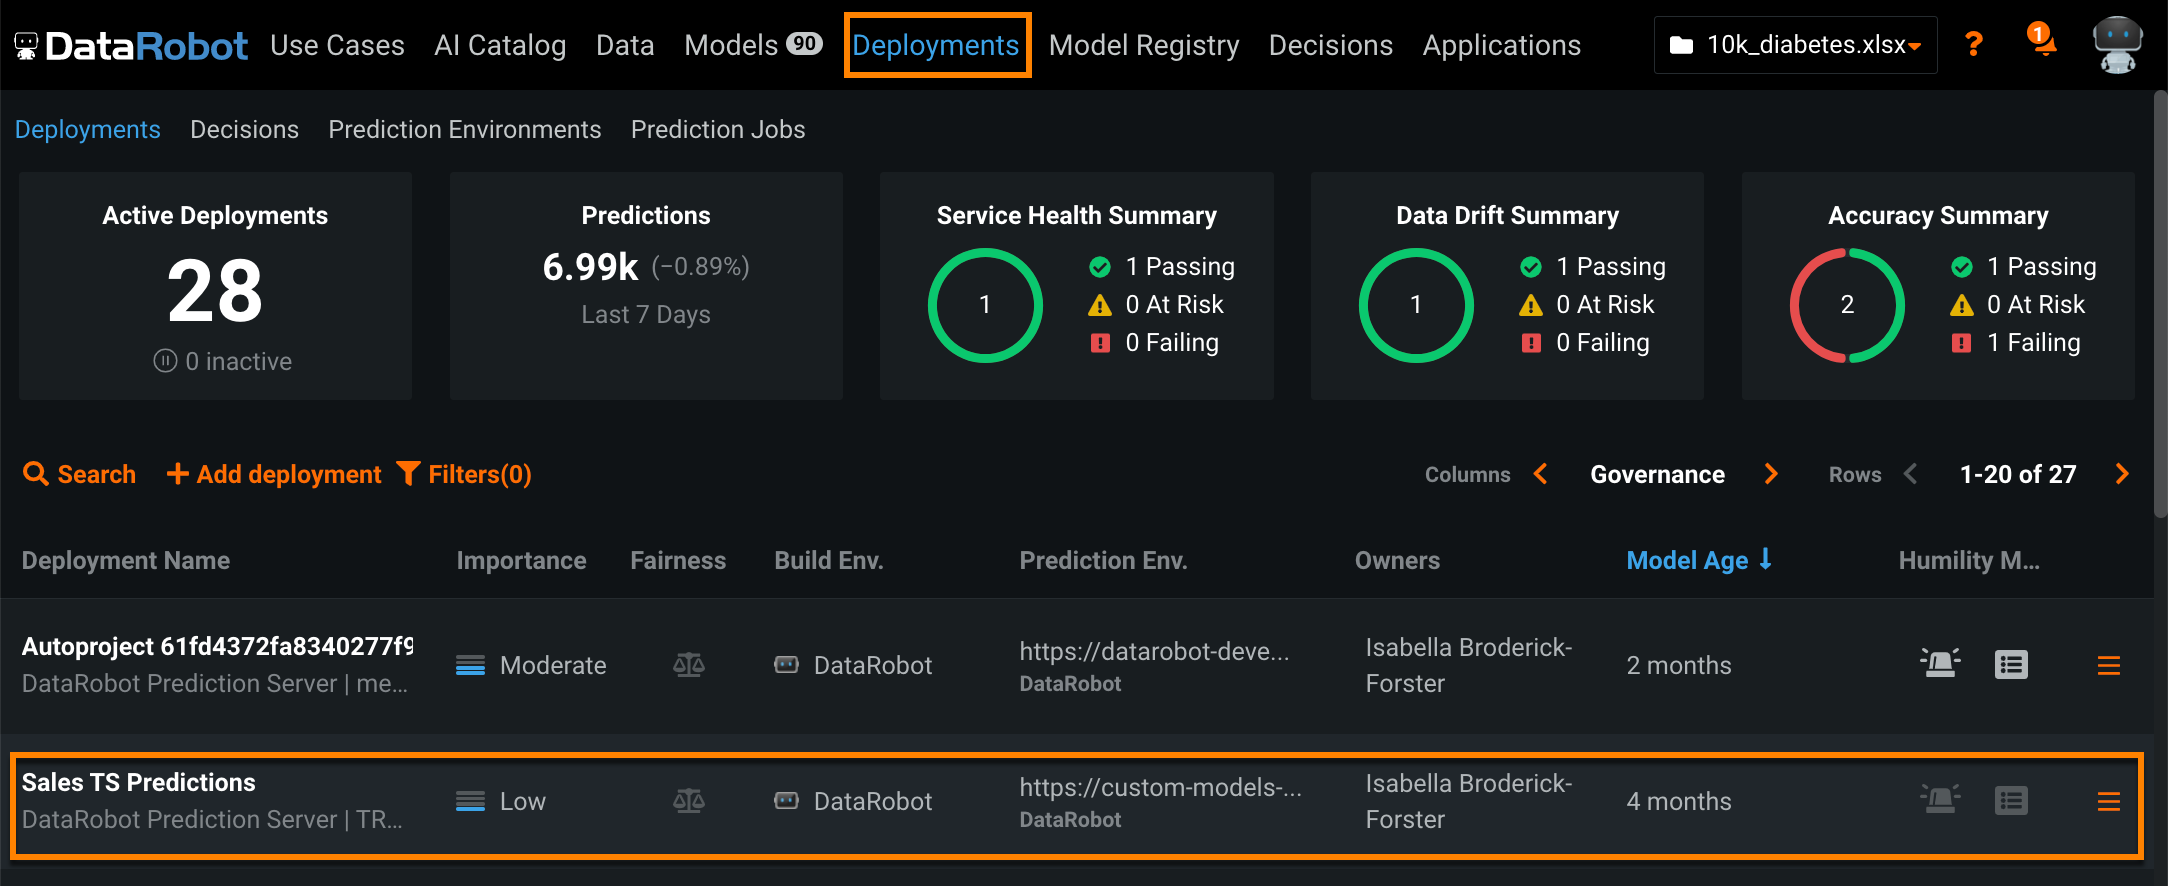
When creating an application from a time series deployment, there some additional settings required. To configure the time series deployment, go to the Deployment inventory, select a time series deployment in the deployment, and navigate to the Settings tab.
Use the table below to configure the appropriate deployment settings for a time series application:
| Setting | Description |
|---|---|
| Association ID | Required. Enter the Series ID in the Association ID field. |
| Require association ID in prediction requests | Toggle on to require an association ID in batch predictions. This prevents you from uploading a dataset without an association ID, which may affect the accuracy of the predictions. |
| Enable target monitoring | Required. Must be toggled on for time series applications. |
| Enable feature drift tracking | Required. Must be toggled on for time series applications. |
| Enable automatic actuals feedback for time series models | Toggle on to have DataRobot add actuals based on prediction file data. |
| Track attributes for segmented analysis of training data and predictions | Required. Must be toggled on for time series applications. |
Create an application
Before starting, review the considerations and deployment settings for time series applications because some options must be set up prior to model building. Known in advance features are also required for What-if applications.
Create an application from your time series deployment. Depending on the template you select—either Predictor or What-if—the application includes the following widgets:
| Widget | Description | Predictor | What-if |
|---|---|---|---|
| Add Data | Allows you to upload and score prediction files. | ✔ | ✔ |
| All Rows | Displays individual predictions. | ✔ | ✔ |
| Time Series Forecasting Widget | Visualizes predictions, actuals, residuals, and forecast data on the Predicted vs Actuals and Prediction Explanations over time charts. | ✔ | ✔ |
| What-if | Allows you to create, adjust, and save simulations using known in advance features. | ✔ |
Time series vs. non-time series Predictor apps
There are a few key differences between time series and non-time series Predictor applications:
- The default configuration for time series applications only includes a Home page and the Add Data widget for batch predictions.
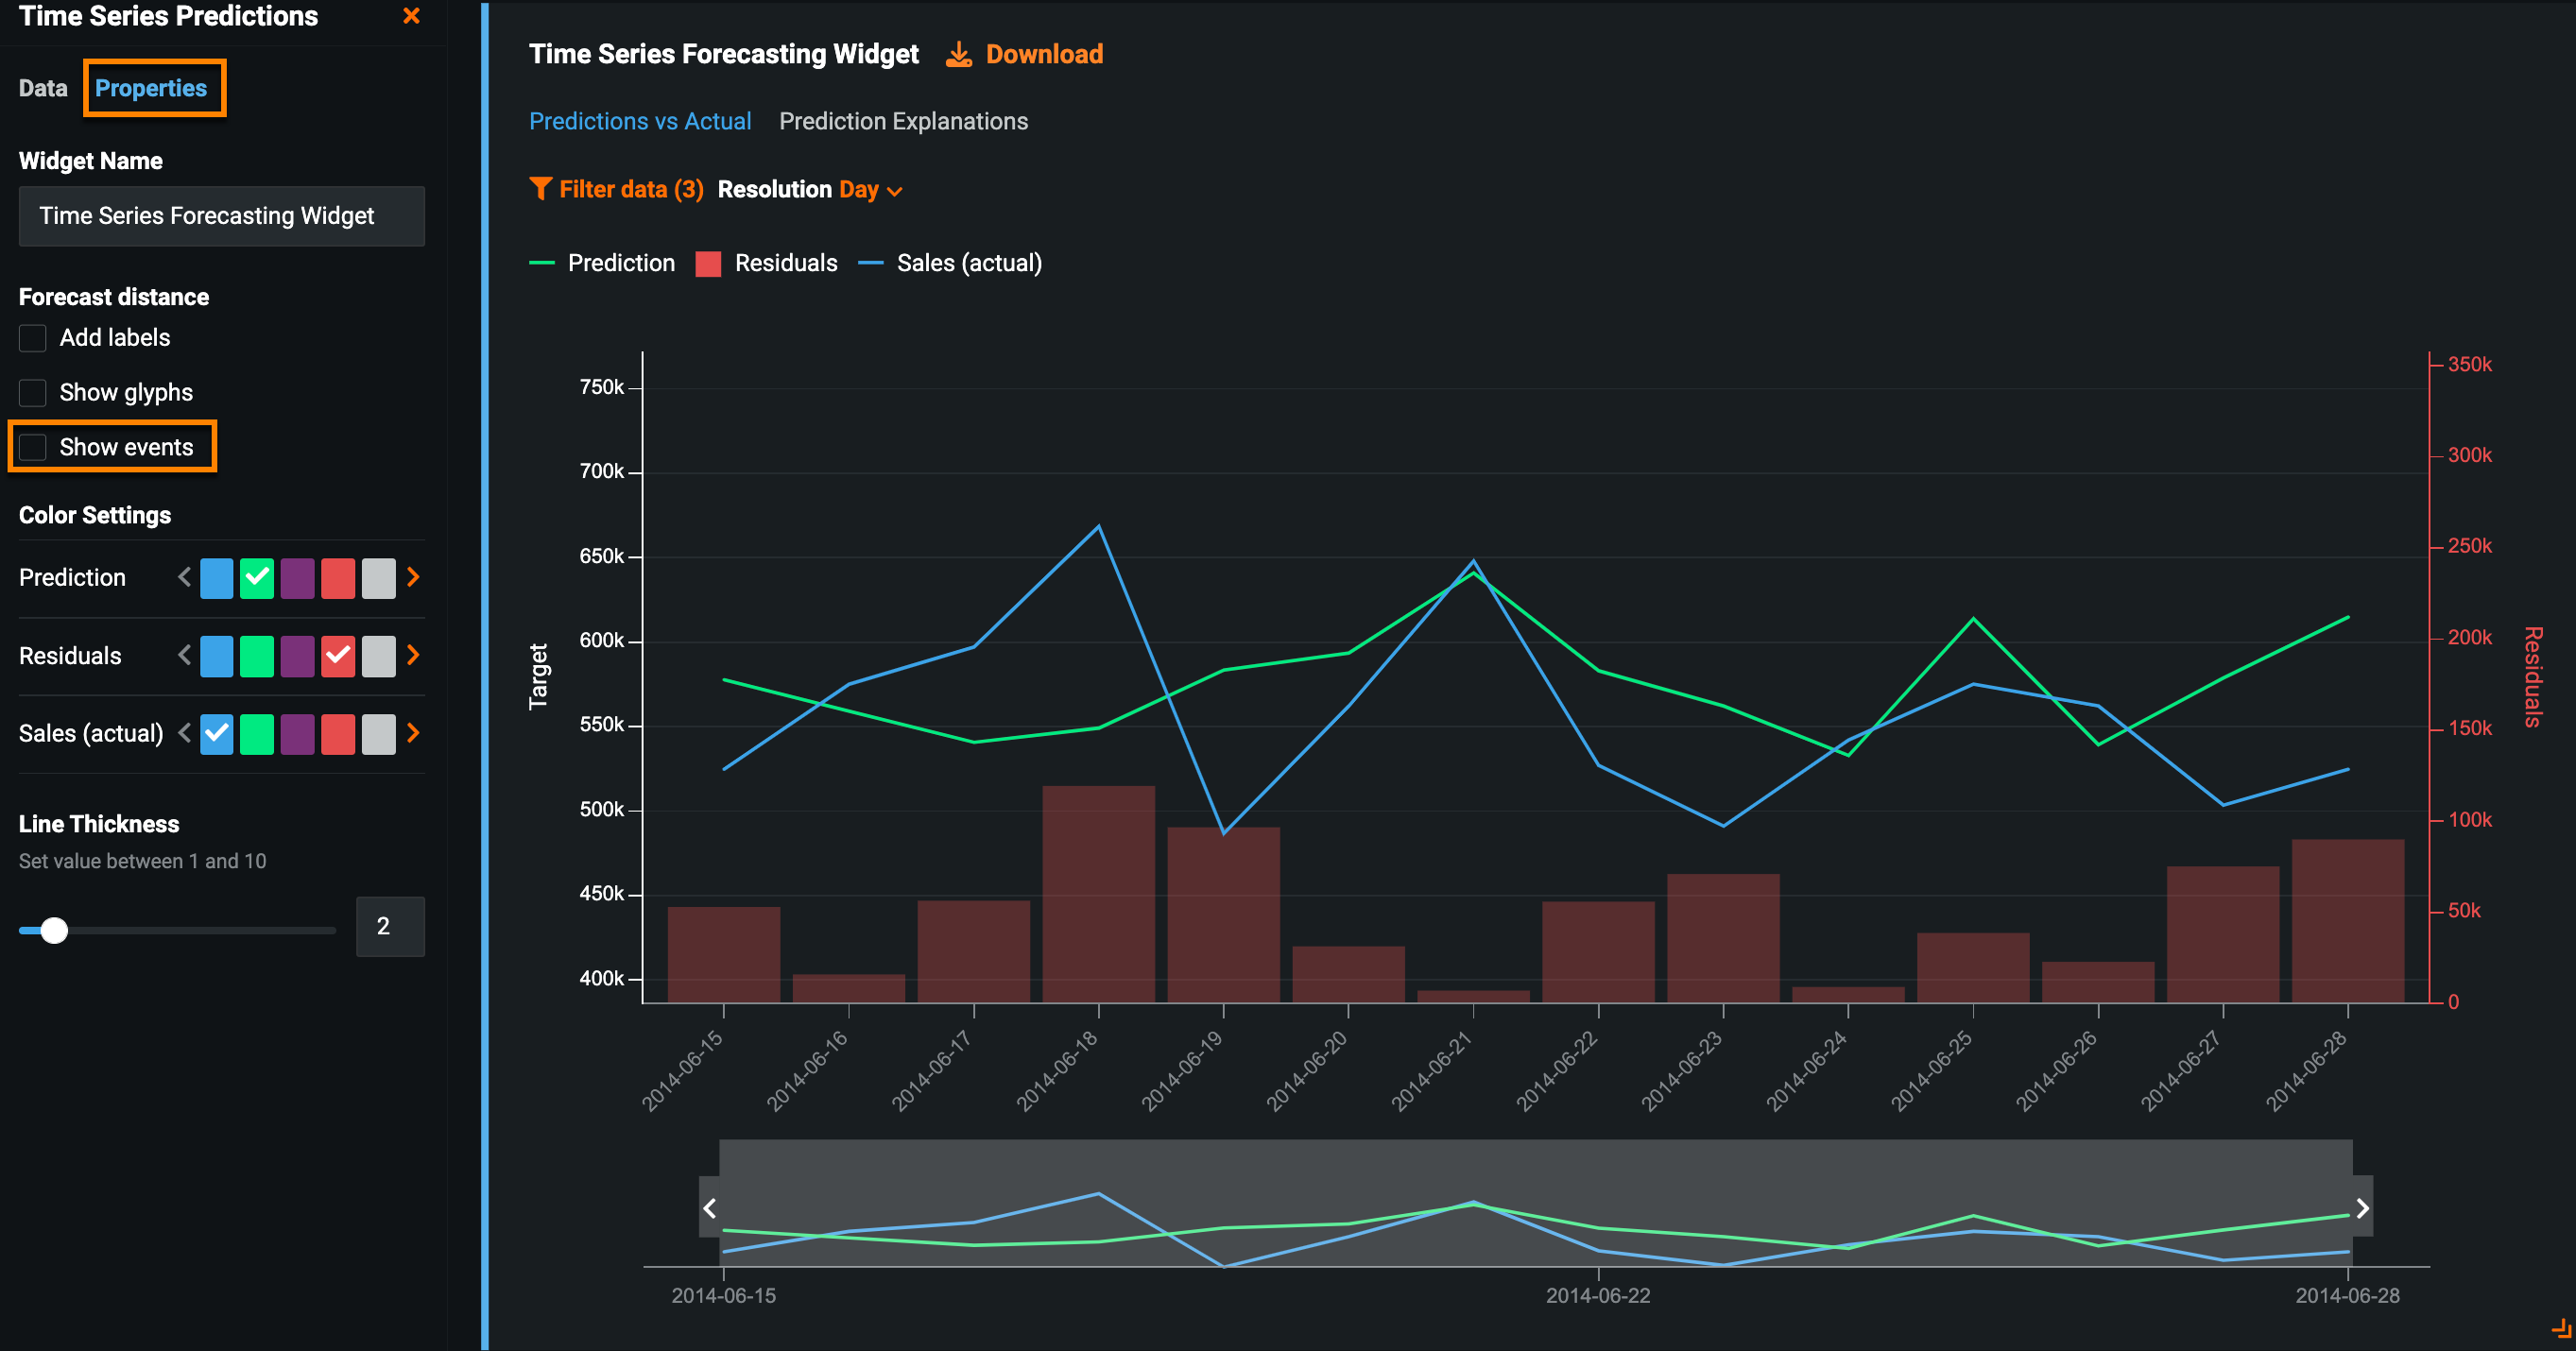
- You cannot add or remove features from the Times Series widget, you can only modify its appearance, including the chart name and line colors, in the Properties tab.
- Non-time series applications cannot add a Time Series Forecasting widget in Build mode.
Customize time series widgets
All widgets are pre-configured based on the template you select, however, you can further customize each widget by clicking Build and selecting a widget. In addition to the customization options described in Widgets, each time series widget includes unique customization options:
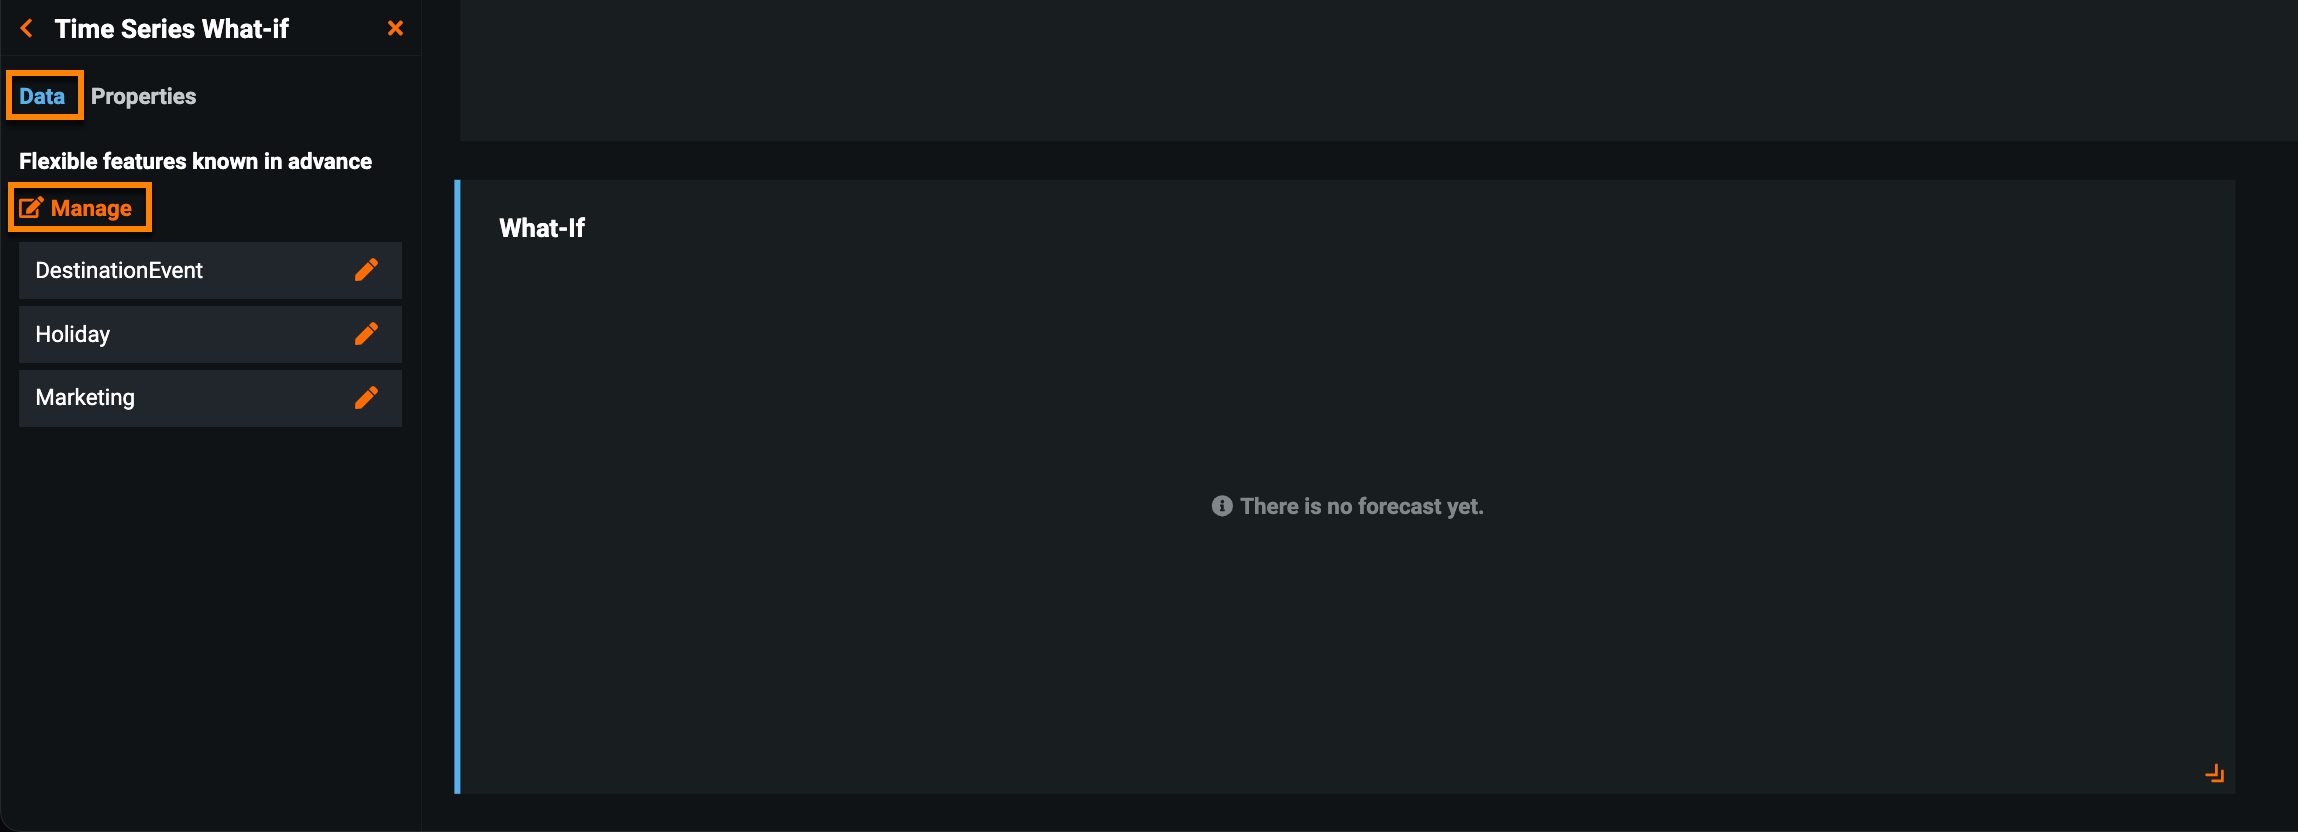
On the Data tab, you can specify which known in advance features can be used to create scenarios. Click Manage to add or remove features.
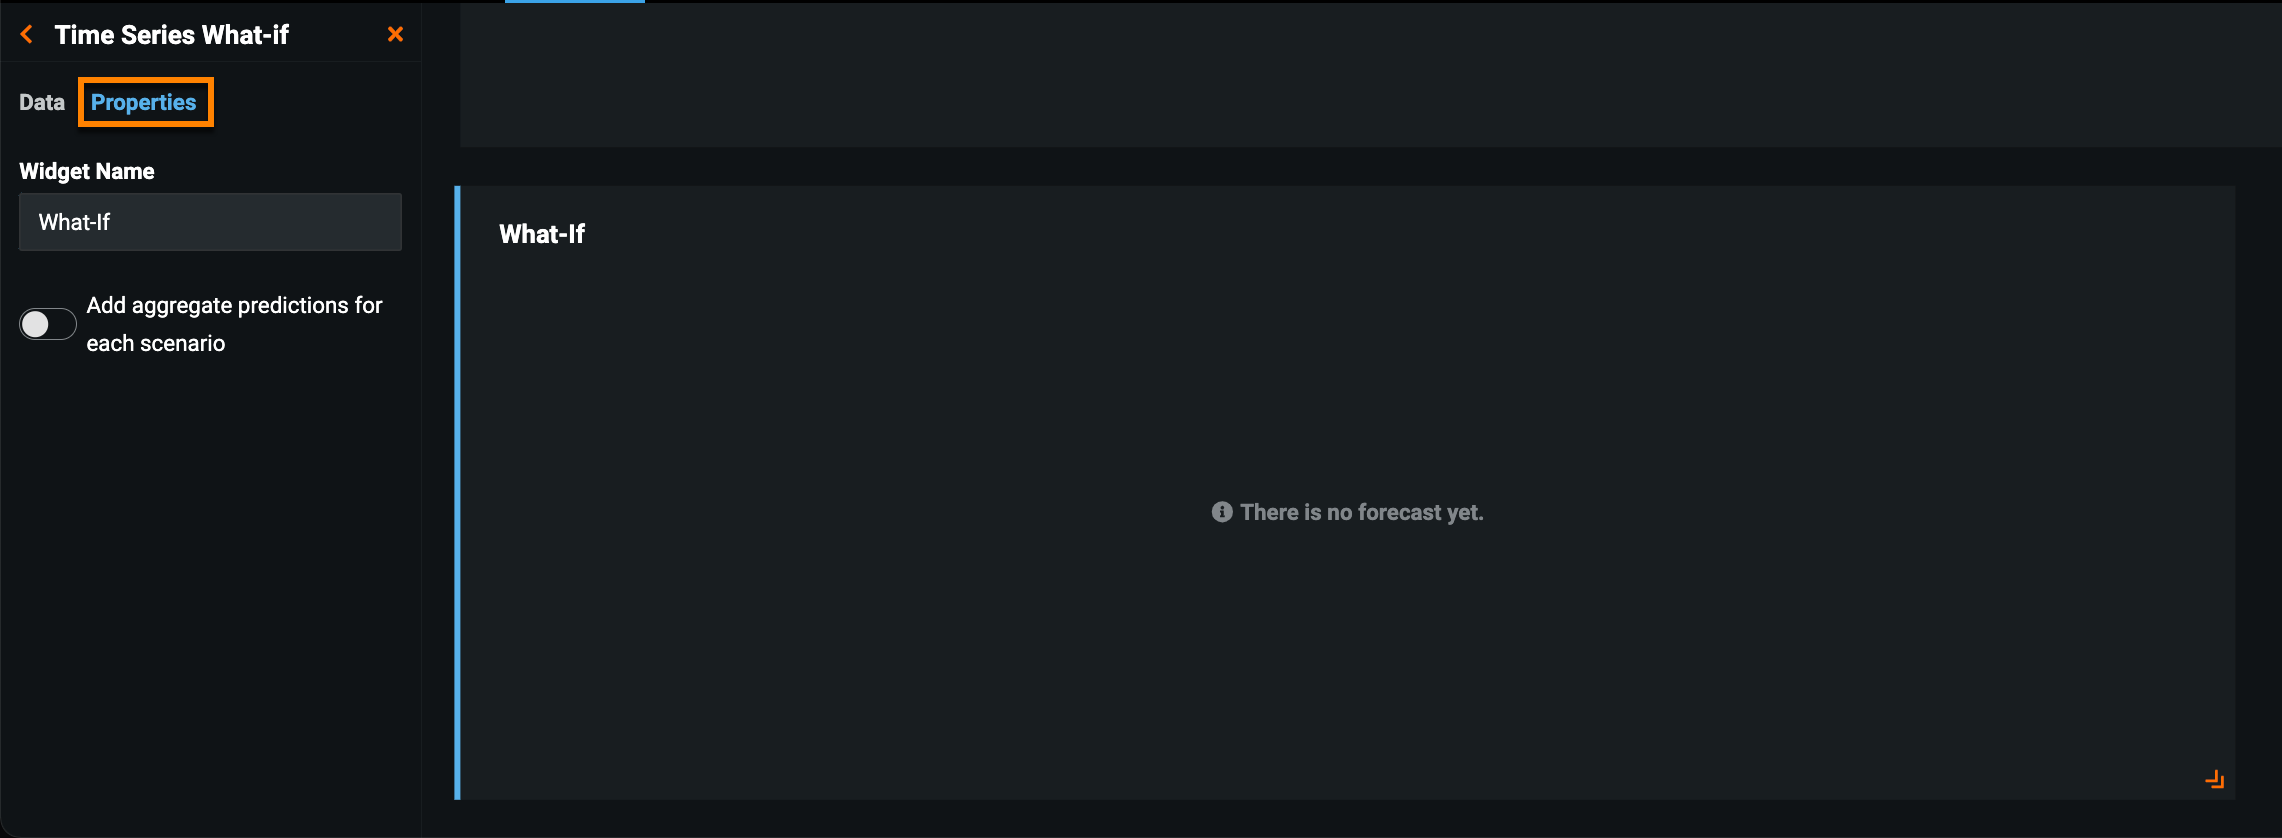
On the Properties tab, you can enable the option to add aggregate predictions for each scenario and choose the aggregation method.
Score predictions
Initially, time series widgets do not display data or visualizations unless the deployment has already scored predictions.
Association IDs in prediction files
If the association ID is not configured properly in the prediction file, the Time Series Forecasting widget will not display prediction information. Consider the following before uploading a prediction file:
- For single series projects, the association ID entered for the deployment must match the name of a dataset column containing dates.
- For multiseries projects, the association ID entered for the deployment must match the name of a "combined" dataset column—a column with values that are a combination of the series name and date, for example,
Boston_2014_09_12. The "combined" column is only required in prediction files, not the training dataset.
To score new predictions:
-
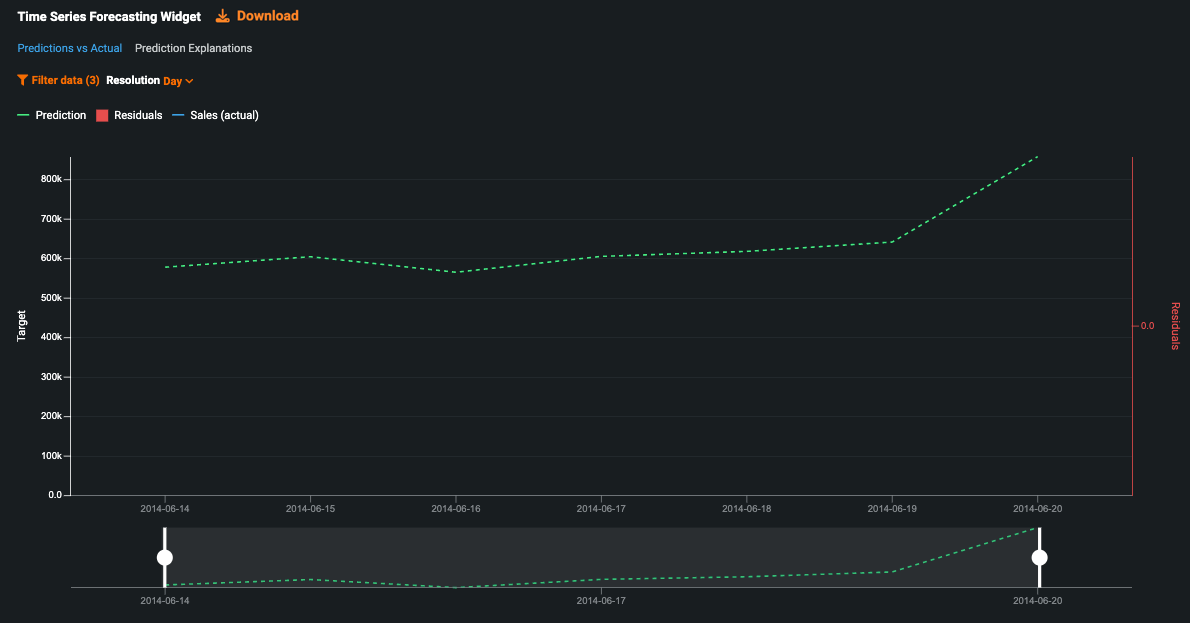
Drag-and-drop a prediction file into the Add Data widget. A prediction line appears on both charts and Prediction Explanations are calculated (Predicted vs Actual chart shown here).
In this example, the file contains sales predictions for
6/14/2014to6/20/2014. -
Click Deployments and select your time series deployment in the Deployment inventory.
-
Click Settings > Data. Scroll down to Actuals and upload the dataset containing actuals. In this example, the file contains actuals for
6/14/2014to6/20/2014. The actuals file must contain the association ID, which you can also find on the Settings page.Note
If the forecast file contains actuals for the range of the initial prediction file, you do not need to upload actuals to the deployment and can proceed to step 5.
In this example, the forecast file would need to contain actuals for
6/14/2014to6/20/2014, the range of the initial prediction, in addition to predictions for6/21/2014to6/27/2014.The application displays an Actuals line and calculates Residuals—the difference between the prediction and the actuals for a given range—in the Time Series Forecasting widget.
-
Navigate back to your time series application.
-
Drag-and-drop a second prediction file, or forecast file, into the Add Data widget. A forecast line appears on both widgets. This forecast file contains predictions for
6/21/2014to6/27/2014.
What-if widget
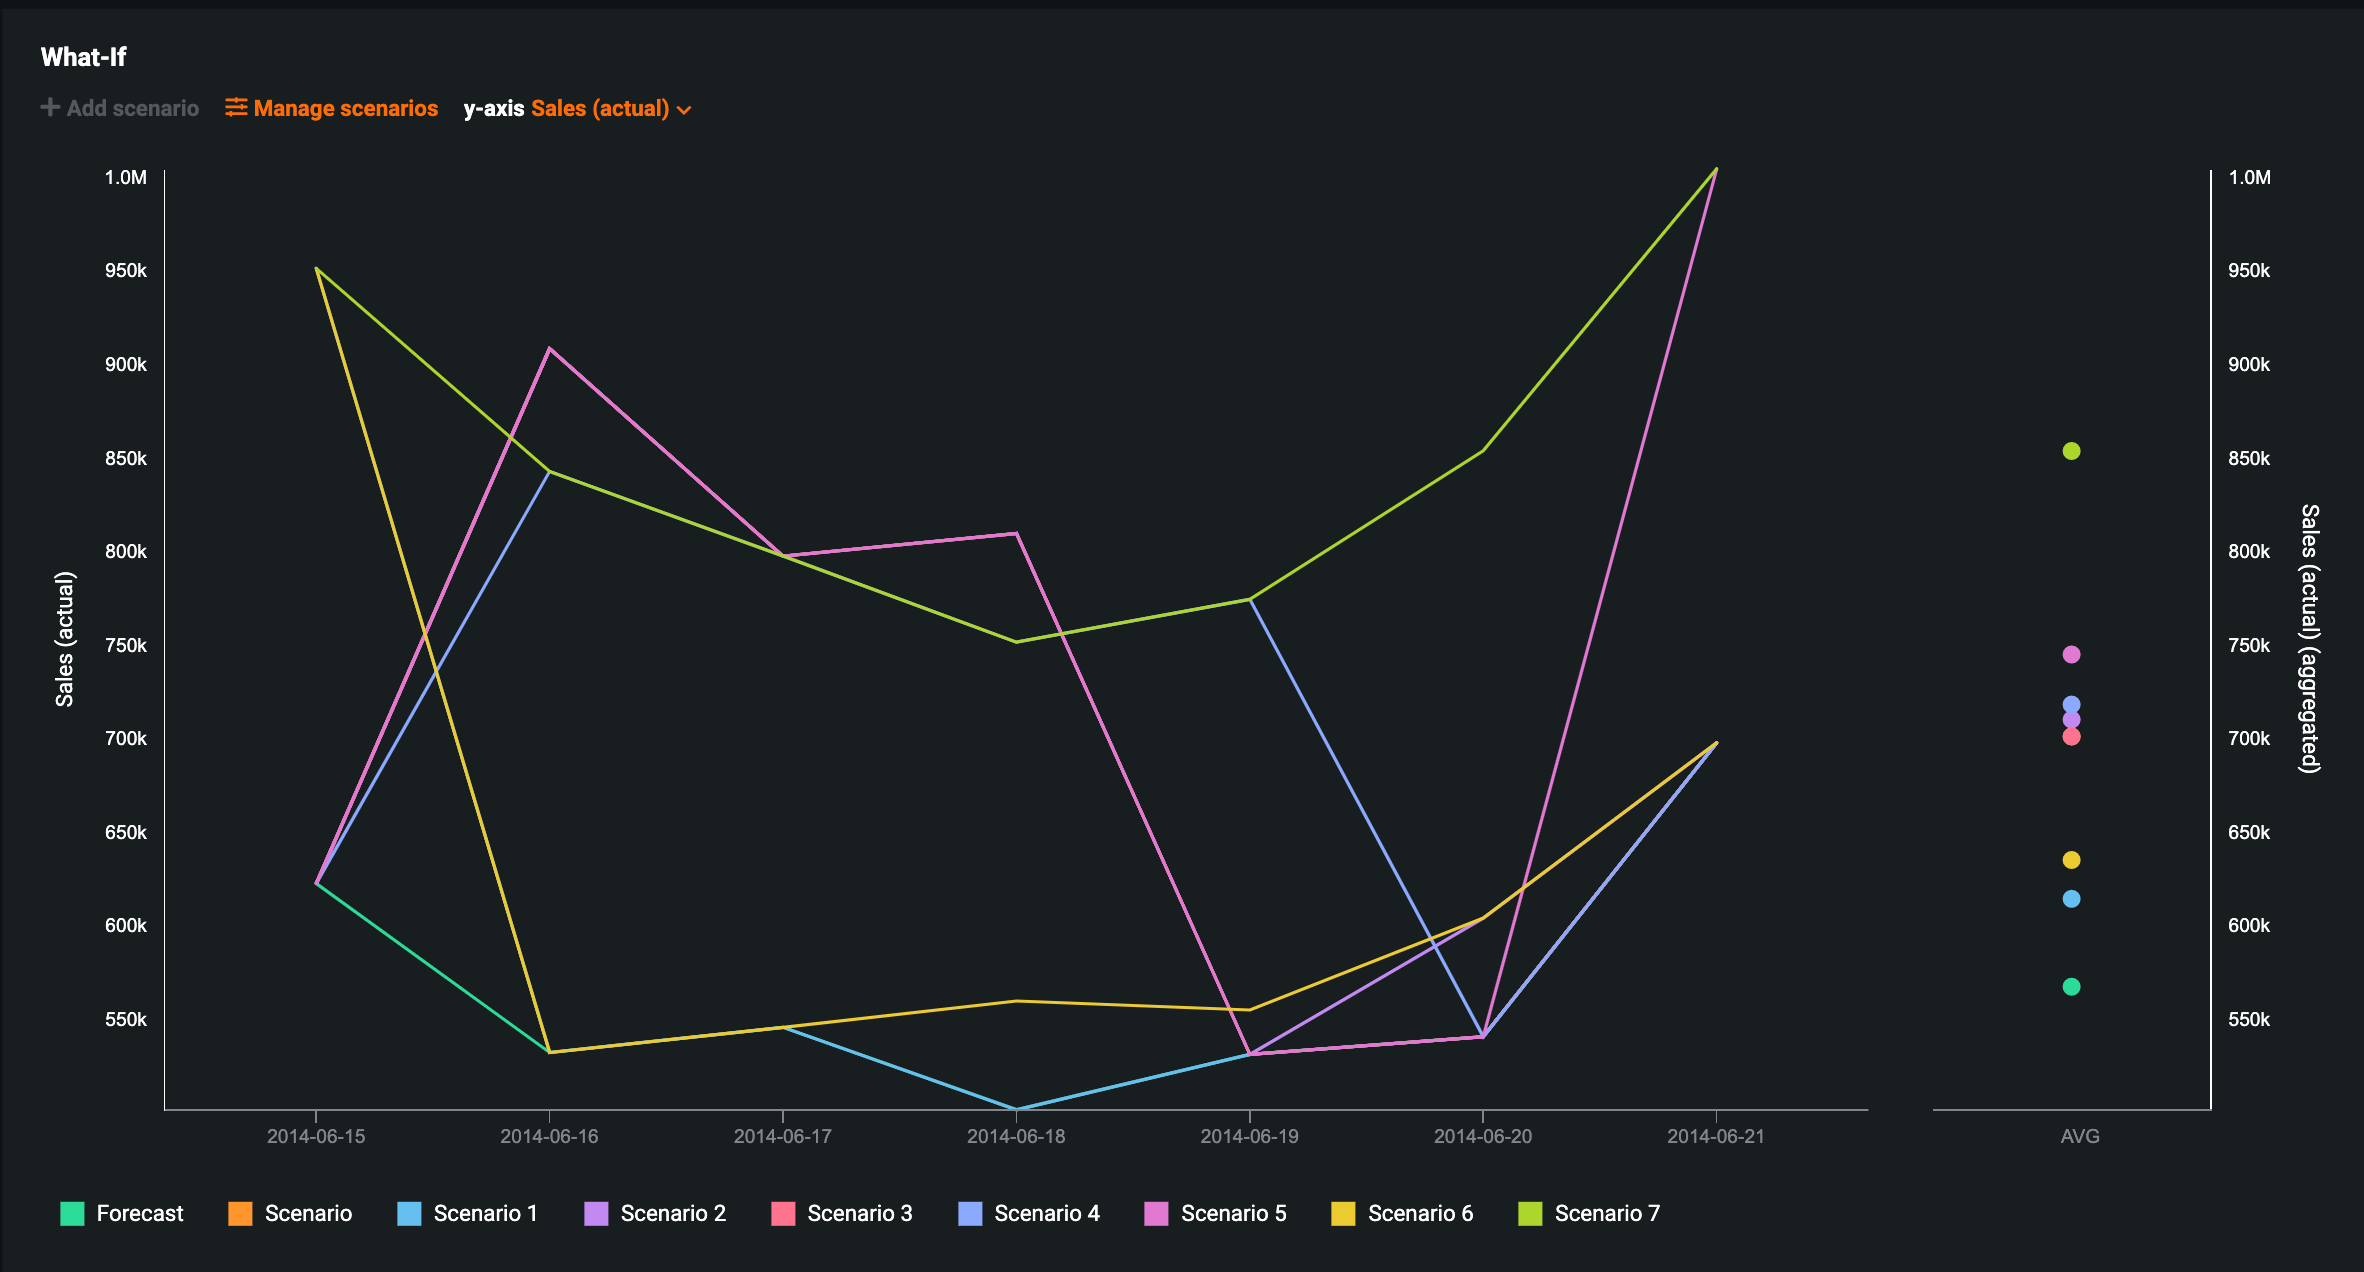
Once the application finishes scoring predictions, the What-if widget displays a forecast line and you can begin creating new scenarios; click Add Scenario.
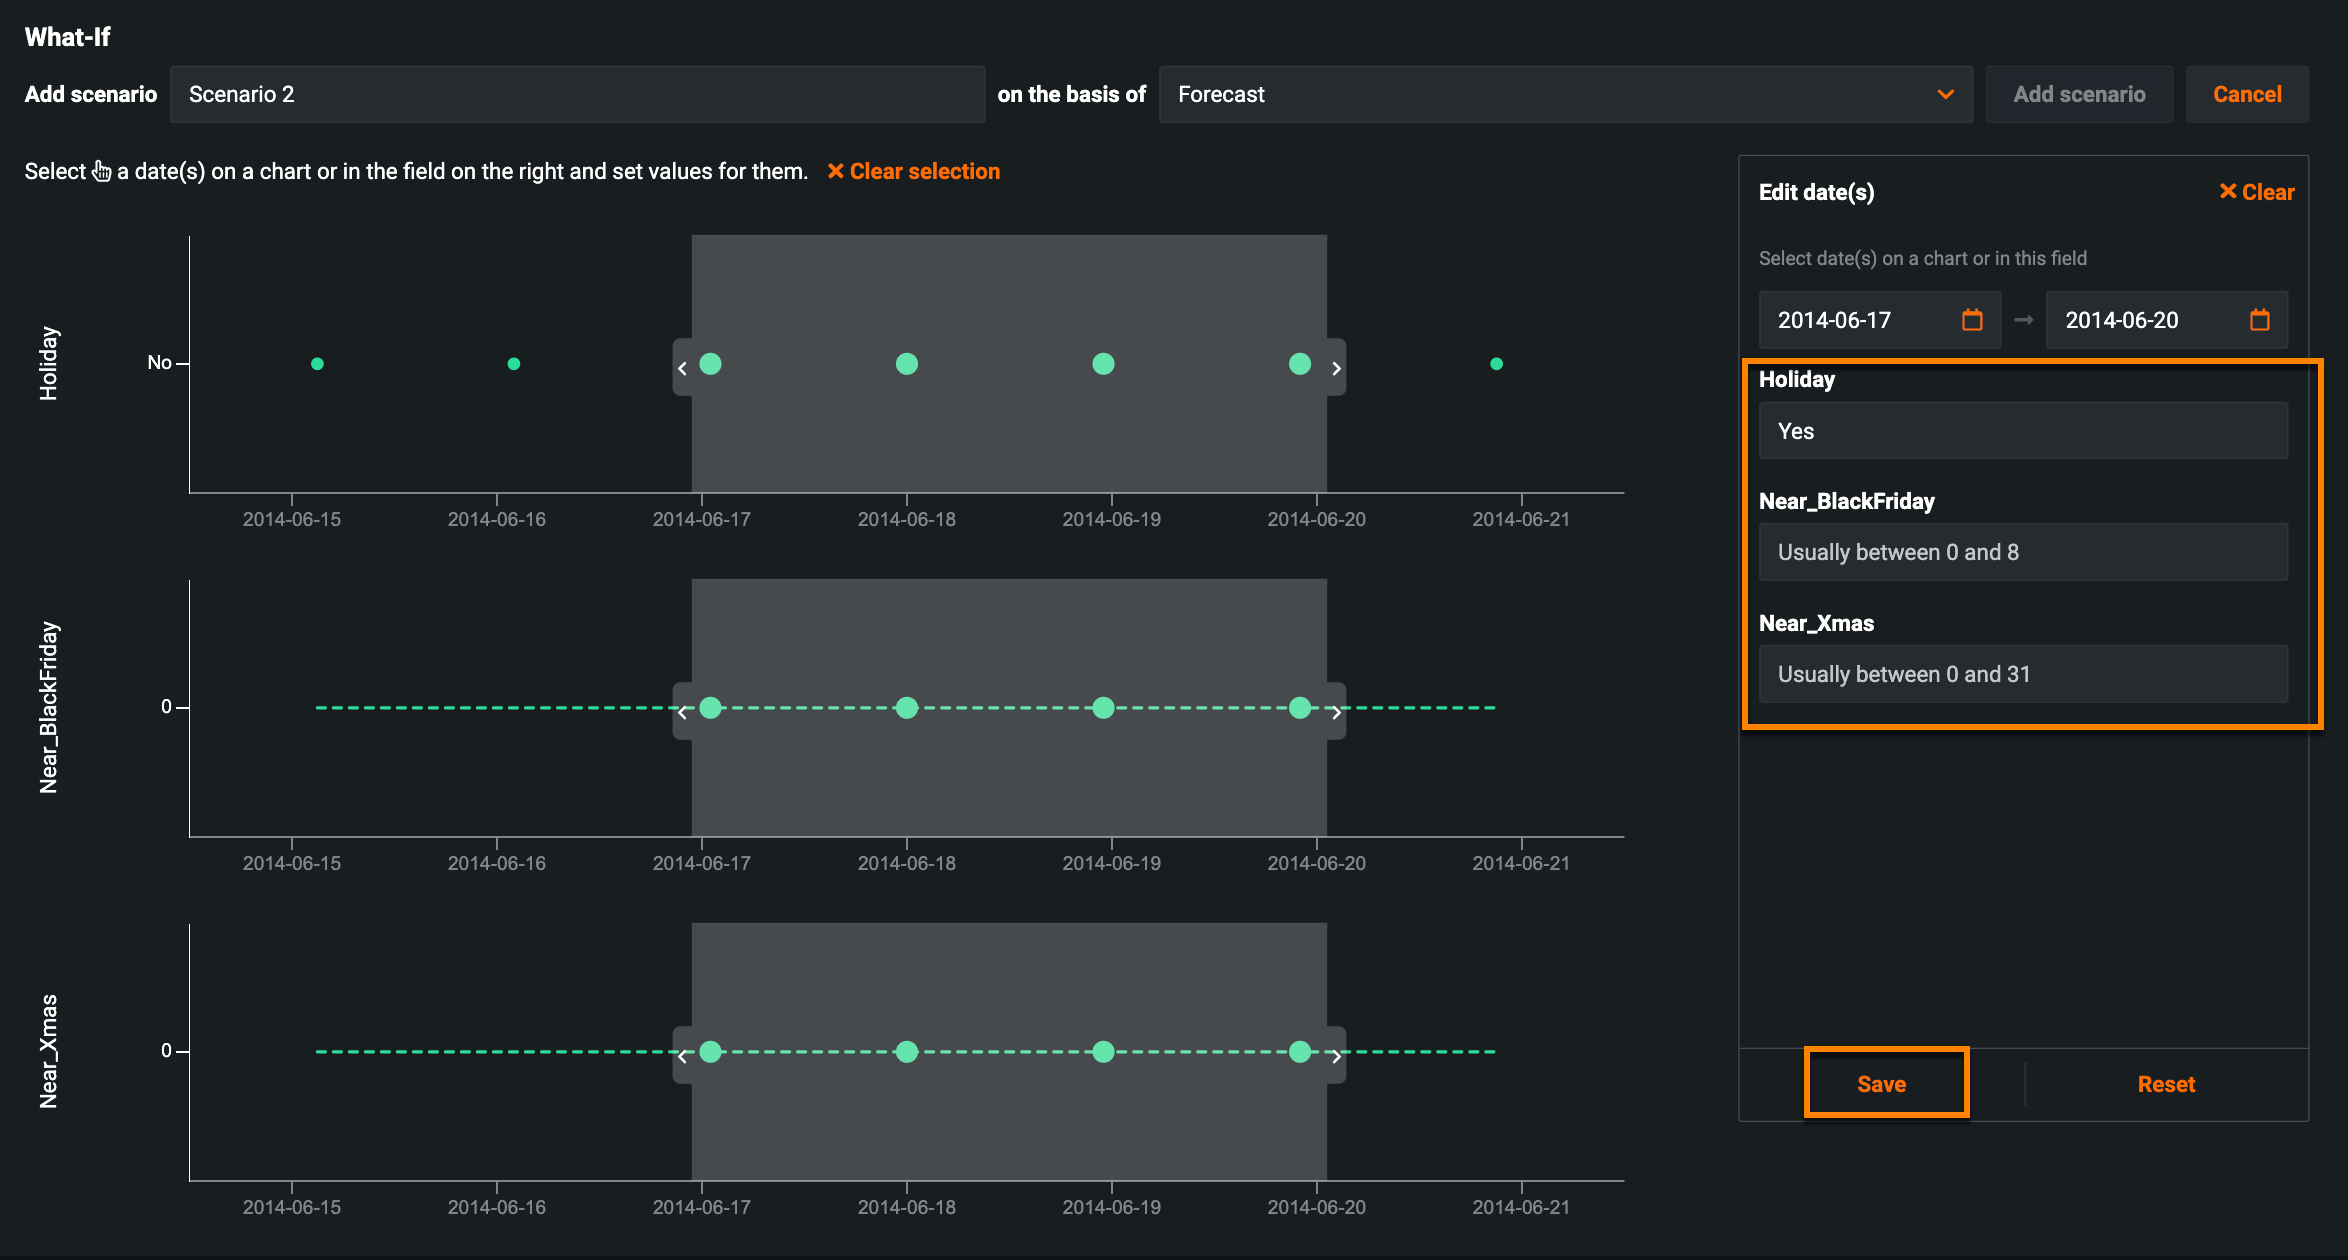
In the resulting window, select a date range for the scenario using the date selector (1), or by populating the date fields (2).
The project's known in advance features are listed on the right side of the widget. In the time series What-if widget, these features serve as your flexible features—features you have control over, for example, launching a marketing campaign on a holiday versus a non-holiday. To create your scenario, enter new values for the features and click Save.
Where are the rest of my features?
If some of your features are missing from the widget, go to Build mode, select the What-if widget, and add them in the Data tab. For more information, see the documentation on adding flexible features.
Continue creating new scenarios one at a time by adjusting these values until you find one that maximizes the prediction score.
Bulk edit scenarios
After scoring predictions and adding scenarios to the What-if widget, if you need to modify the same known-in-advance feature for multiple scenarios, you can do so with the bulk edit feature.
Click Manage Scenarios at the top of the What-if widget.
Select the box next to the scenarios you want to edit or Select All to modify all existing scenarios. Then, click the pencil icon to the right of Select All.
Note
If you are modifying a single scenario, click the pencil icon to the right of the scenario you're editing. If you're editing multiple scenarios, click the pencil icon to the right of Select All. When editing multiple scenarios, clicking the pencil icon to the right of a specific scenario only edits that scenario.
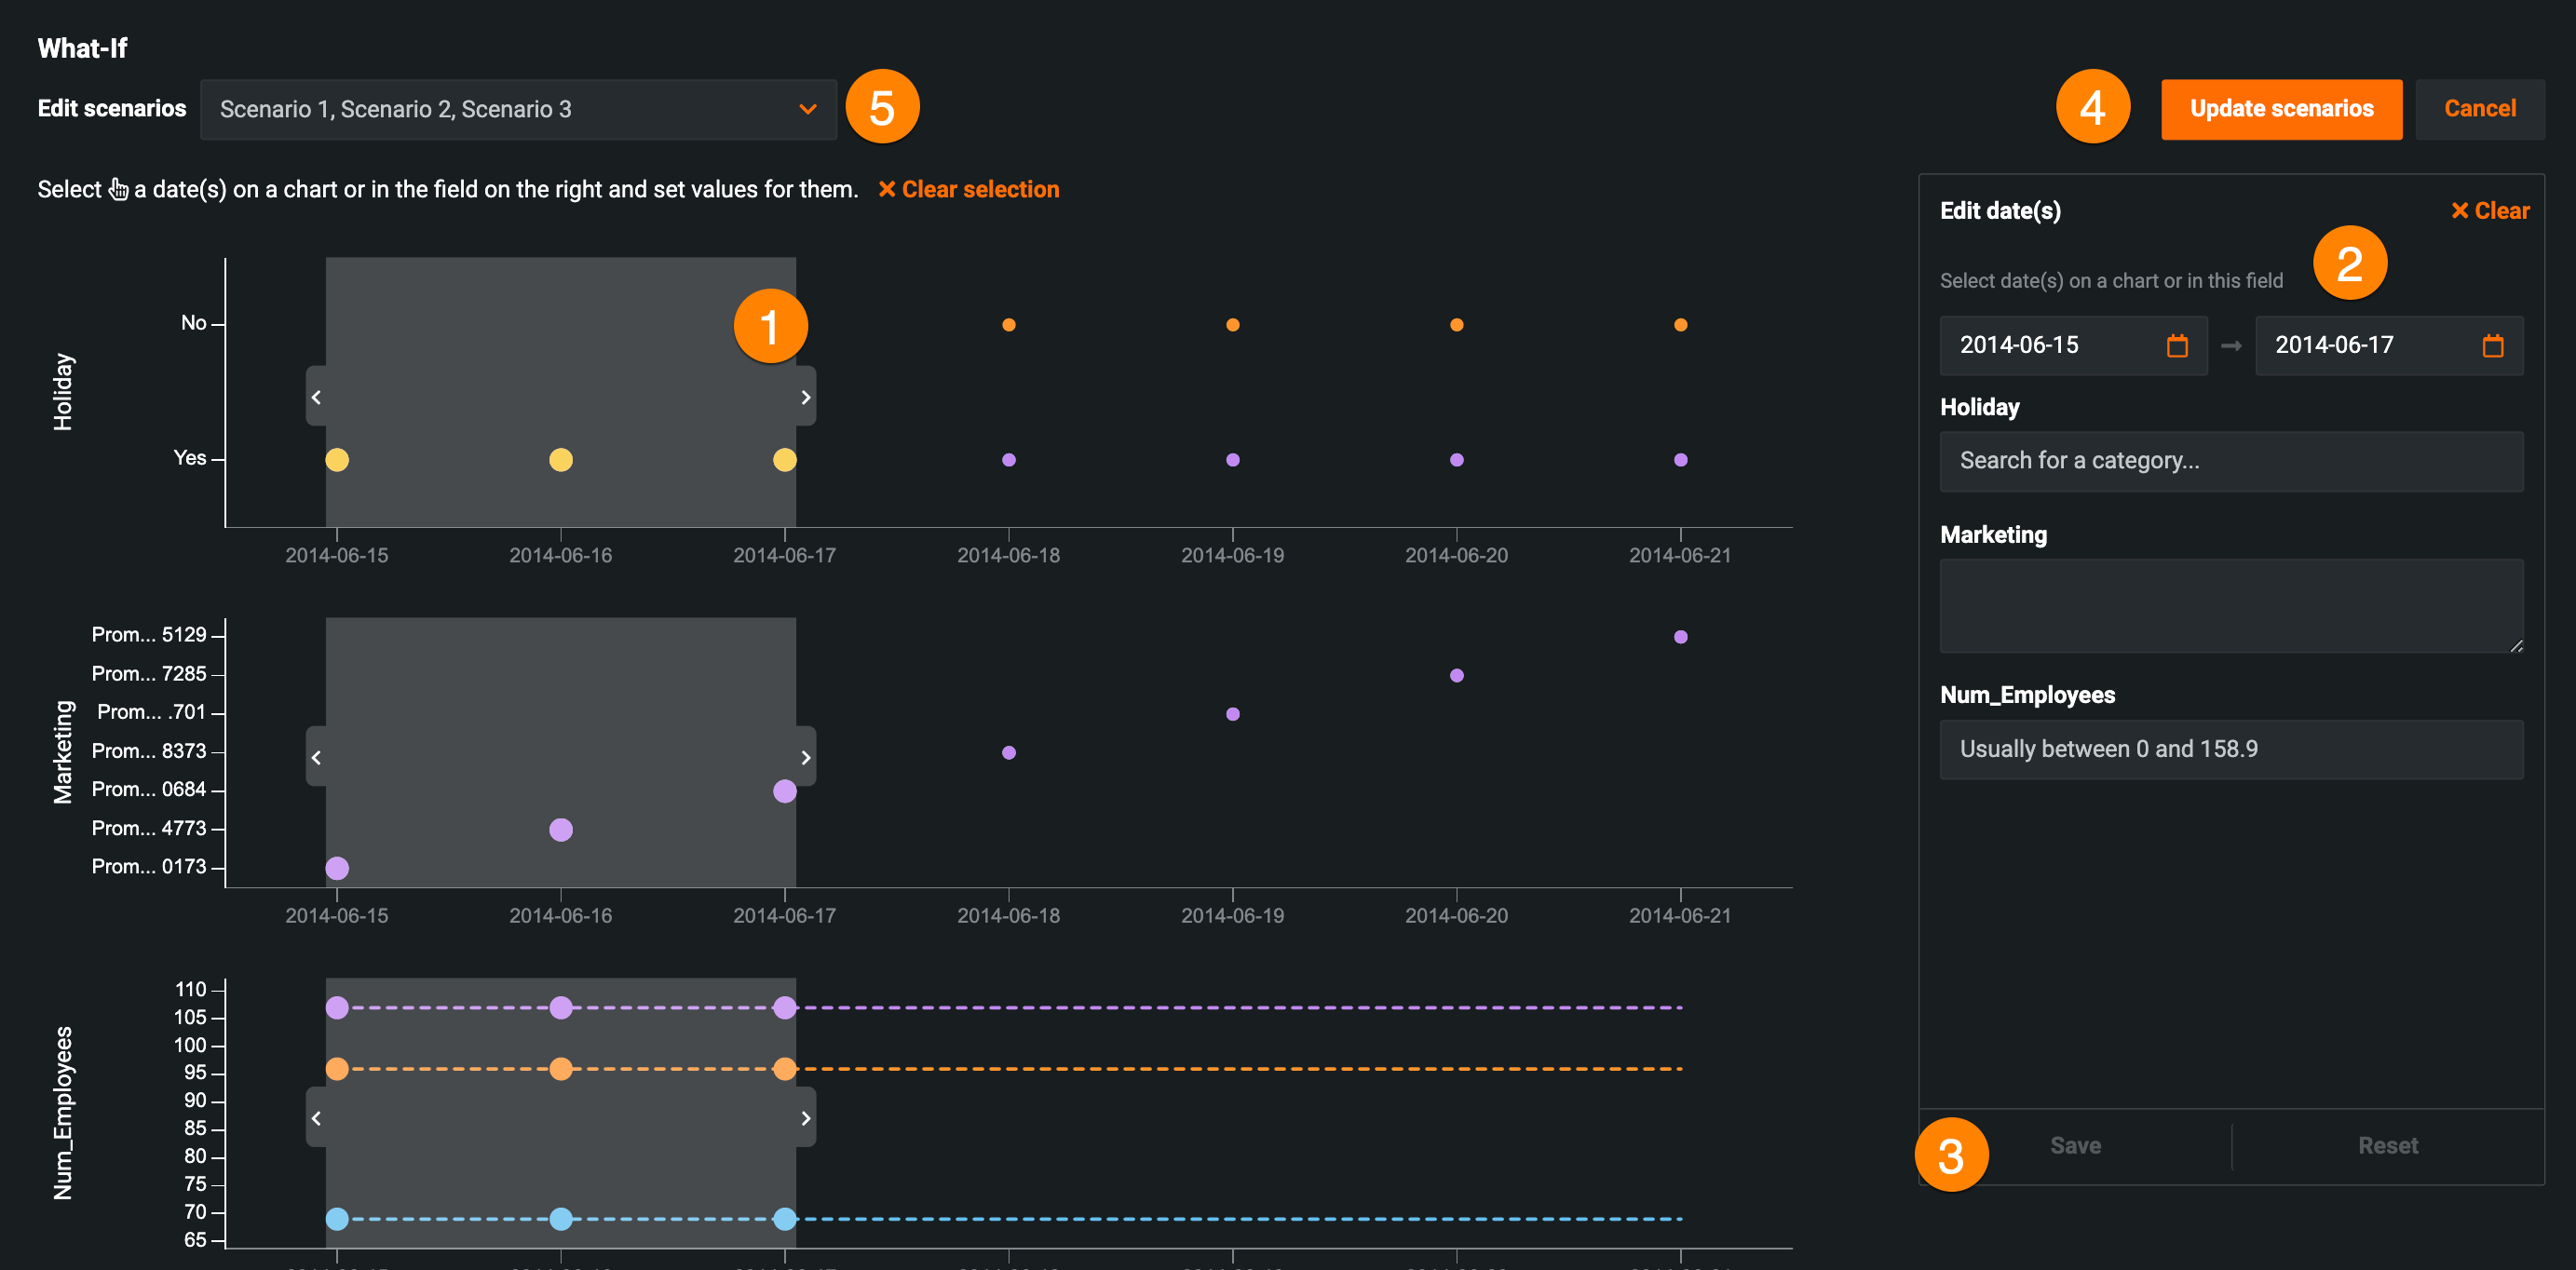
Use the (1) slider to select a date range and (2) modify the known in advance features for the selected date range.
Click (3) Save and (4) Update scenario. Once DataRobot finishes processing the batch prediction job, the updated scenarios appear on the What-if chart.
Time Series Forecasting widget
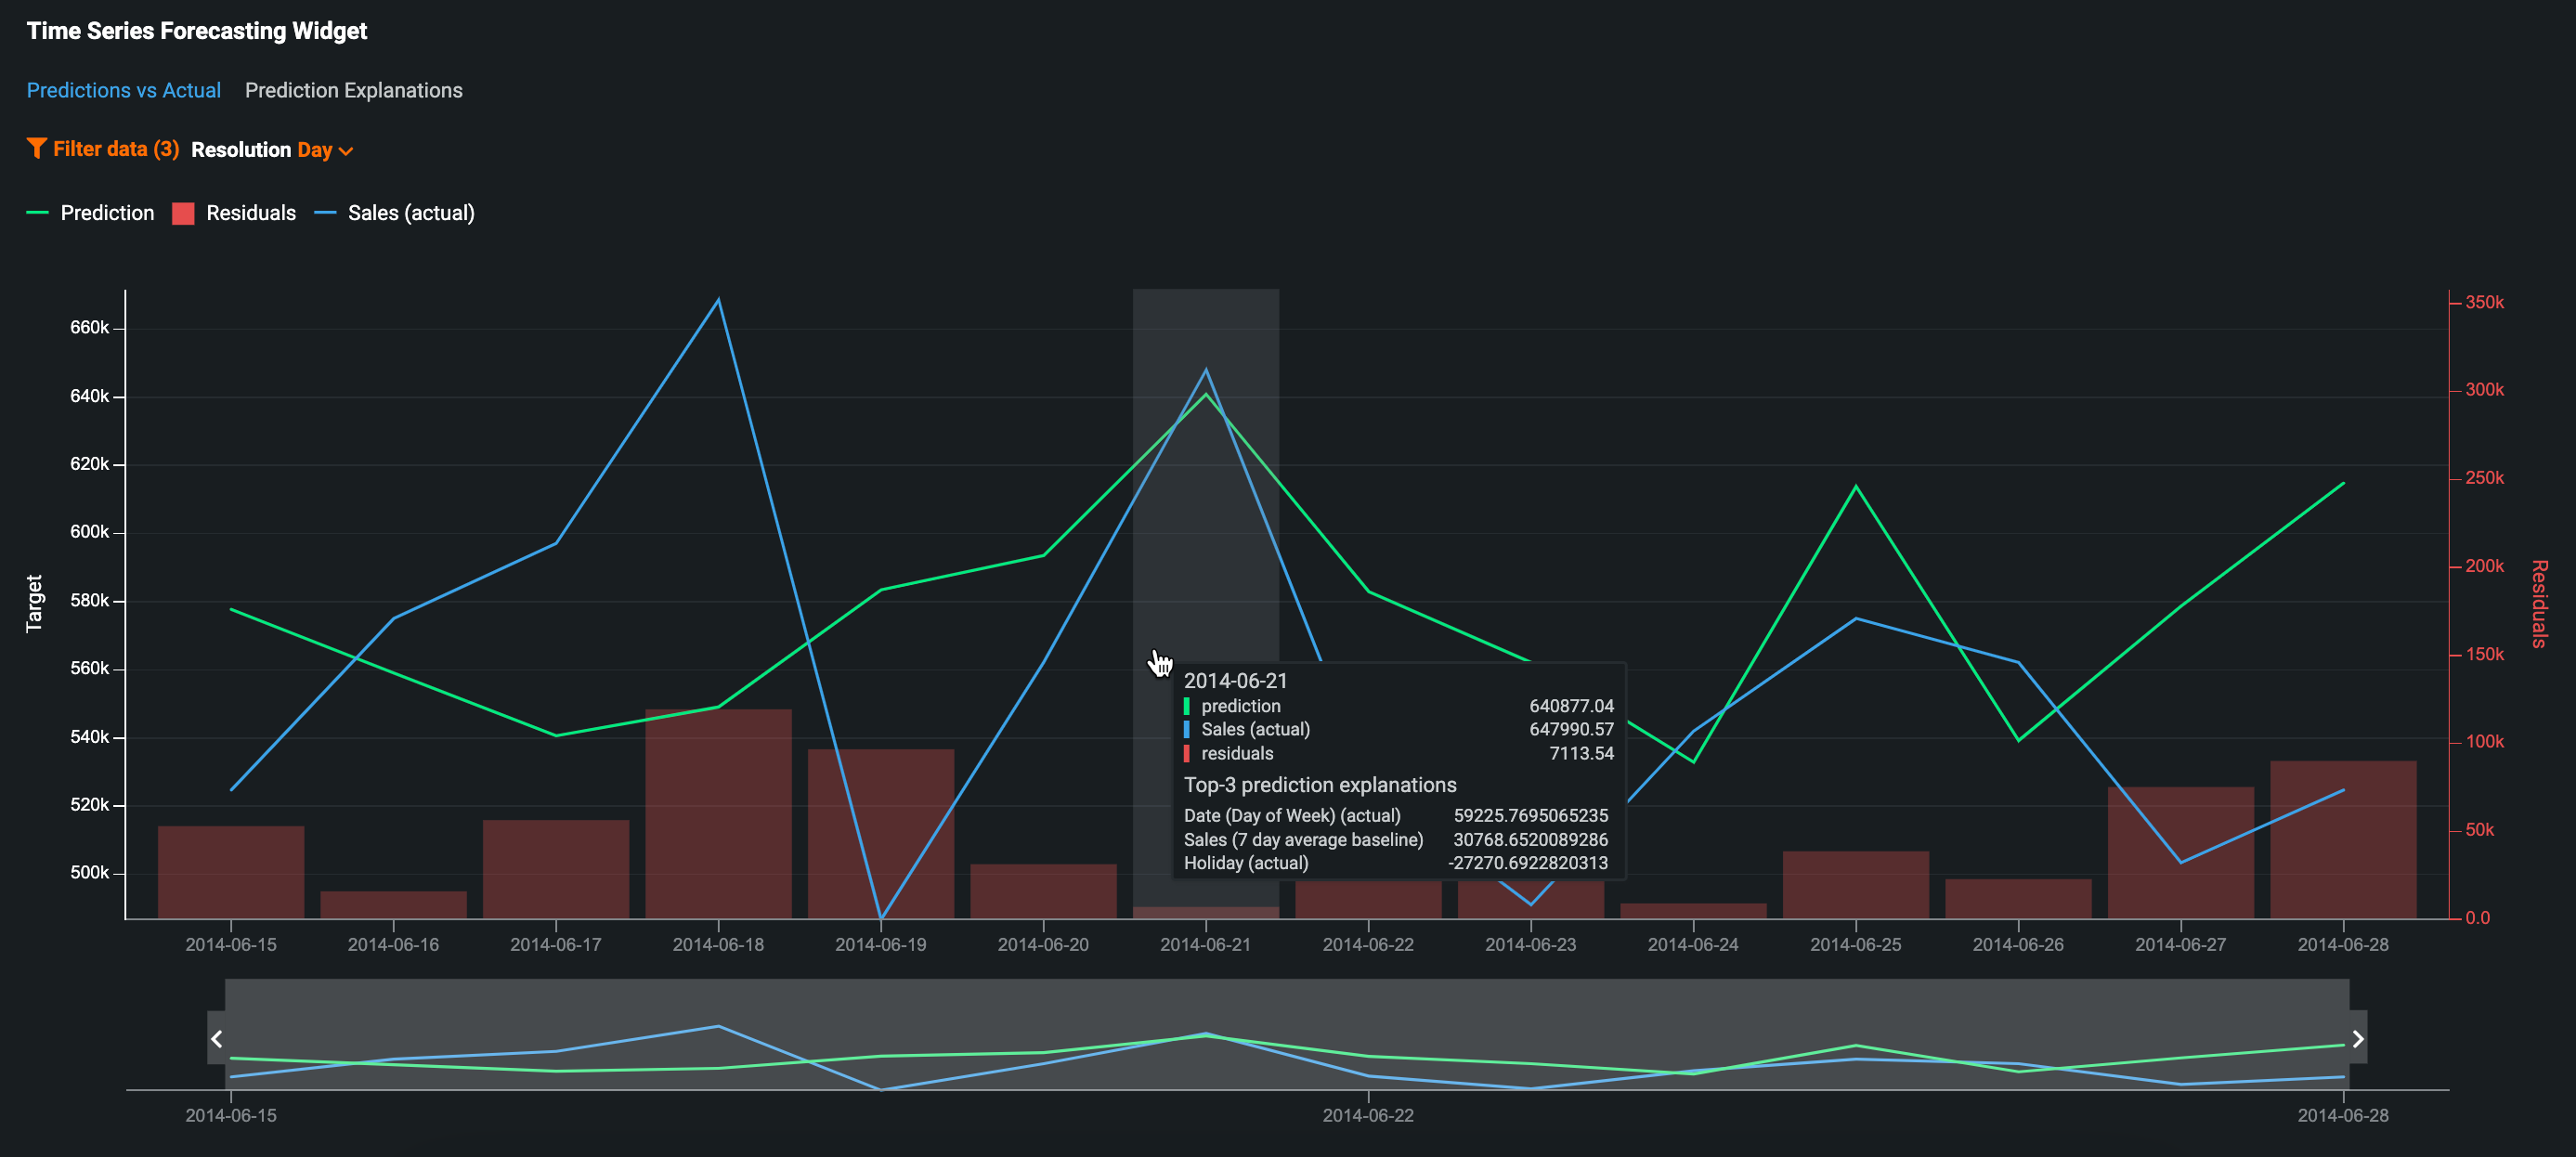
The Time Series Forecasting widget surfaces insights using two charts: Prediction vs Actual and Prediction Explanations over time. Use the tabs below to learn more about each chart:
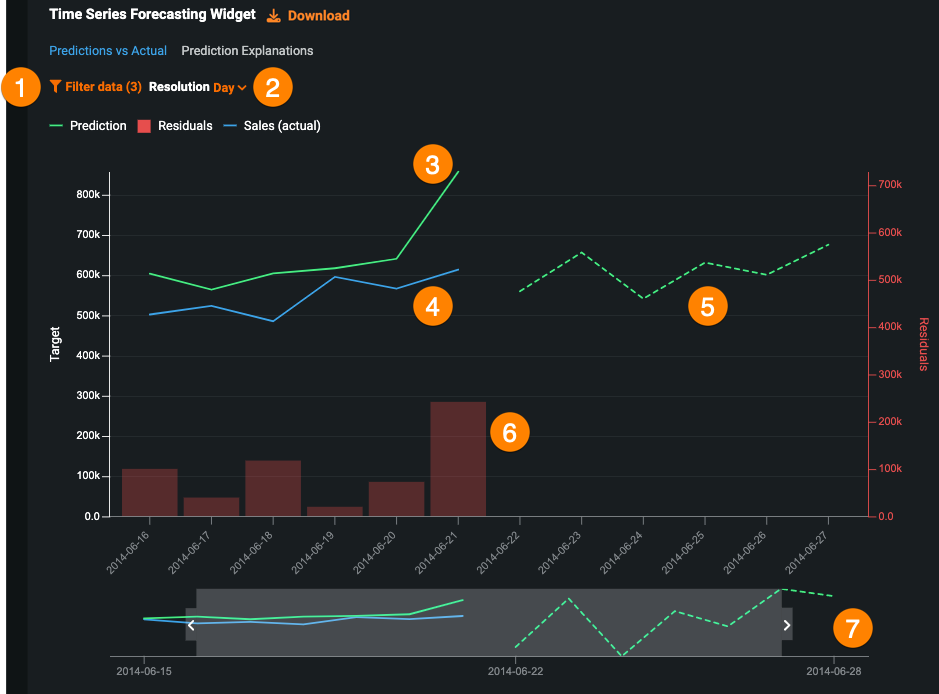
Similar to Accuracy Over Time, the Predicted vs Actual chart helps you visualize how predictions change over time using predicted and actual vs time values based on forecast distances.
| Setting | Description | |
|---|---|---|
| 1 | Filter data | Hide target (actual) and residual information from the chart. Prediction information cannot be hidden. |
| 2 | Resolution | View the results by day, week, month, quarter, or year. |
| 3 | Prediction line | Represents scored predictions. |
| 4 | Actual line | Represents actual values for the target. |
| 5 | Forecast line | Represents the prediction based on time, into the future using recent inputs to predict future values. |
| 6 | Residuals | Represents the difference between predicted and actual values. |
| 7 | Date range | Drag the handles on the preview panel to bring specific areas into focus on the main chart. |
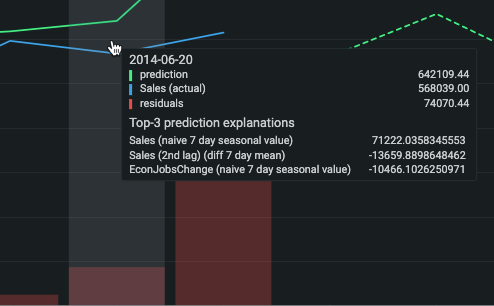
Hover over any point to view the date, prediction values, and top 3 Prediction Explanations.
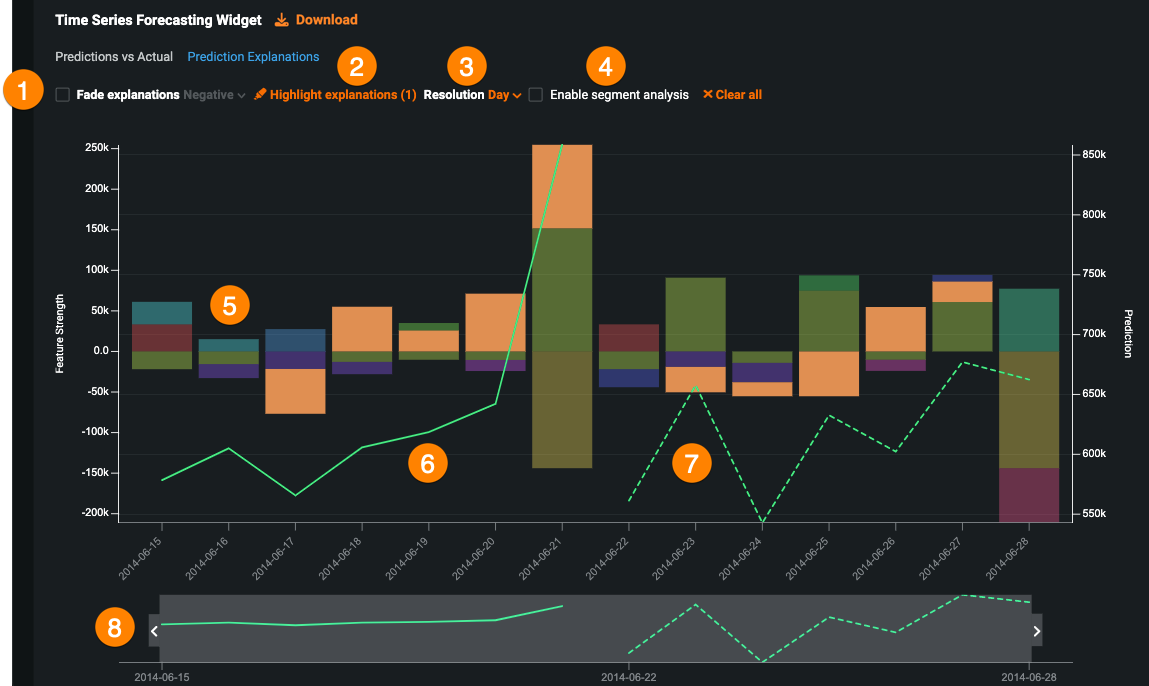
To view Prediction Explanations over time for your scored predictions, click the Prediction Explanations tab. Every point on the chart represents a separate prediction, and therefore has its own set of Prediction Explanations. Every Prediction Explanation also has its own unique color, allowing you to explore trends in the data.
| Setting | Description | |
|---|---|---|
| 1 | Fade explanations | Allows you to hide either all positive or negative Prediction Explanations. Select the box next to Fade explanations and select an option from the dropdown. |
| 2 | Highlight explanations | Highlights specific features in the Prediction Explanations based on its unique color. Click Highlight explanations and select features from the dropdown. |
| 3 | Resolution | View the results by day, week, month, quarter, or year. |
| 4 | Enable segment analysis | Creates the specified number of additional rows for the forecast value. Select Enable segment analysis and choose a Forecast distance from the dropdown. |
| 5 | Prediction Explanations | Each point represents a separate prediction and each prediction has its own set of explanations, which are grouped by color. |
| 6 | Prediction line | Represents scored predictions. |
| 7 | Forecast line | Represents the prediction based on time, into the future using recent inputs to predict future values. |
| 8 | Date range | Drag the handles on the preview panel to bring specific areas into focus on the main chart. |
Forecast Details page
The Forecast Details page allows you to view additional forecast details, including the average prediction values and up to 10 Prediction Explanations for a selected date, as well as segmented analysis for each forecast distance within the forecast window.
In the Time Series Forecasting widget, click on a prediction in either the Predictions vs Actuals or Prediction Explanations chart to view the following forecast details for the selected date:
| Description | |
|---|---|
| 1 | The average prediction value in the forecast window. |
| 2 | Up to 10 Prediction Explanations for each prediction. |
| 3 | Segmented analysis for each forecast distance within the forecast window. |
| 4 | Prediction Explanations for each forecast distance included in the segmented analysis. |
Click the arrow next to Forecast details to return to the main application.
Download predictions
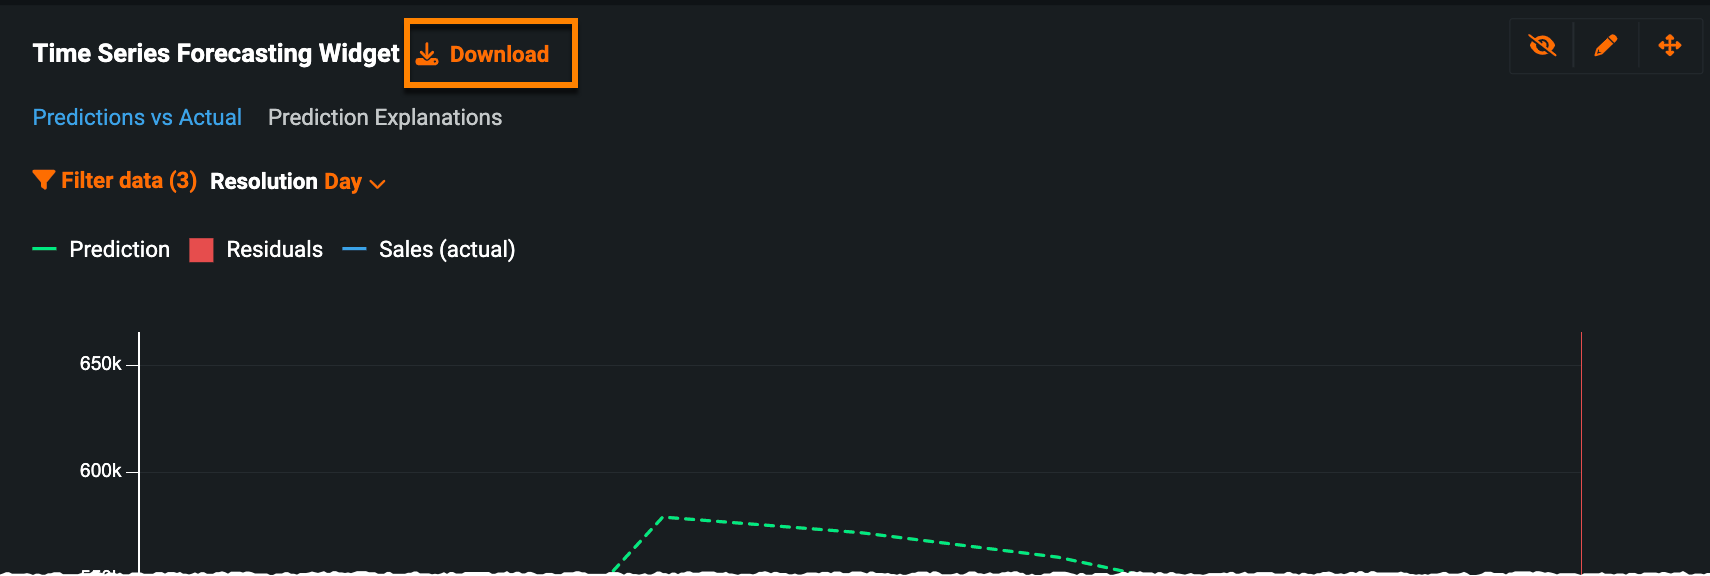
After scoring a batch prediction, the Download button appears in the Time Series Forecasting widget, allowing you to download the prediction results as a CSV.
Note
When downloading predictions from the Time Series Forecasting widget, non-KA features will always be empty.
