Time series modeling
Availability information
Contact your DataRobot representative for information on enabling automated time series (AutoTS) modeling.
Time series modeling forecasts multiple future values of the target. With out-of-time validation (OTV), by contrast, you are not forecasting but instead modeling time-relevant data and predicting the target value on each individual row. Time series forecast modeling is based on the following framework; see the reference section for a description of the framework elements. See the section on nowcasting to better understand that framework.
Requirements and availability
Be sure to review the time step, data requirements, interval units, and acceptable project types for time series modeling, which are described in detail below.
See these additional considerations for OTV and time series modeling.
Basic workflow
The following describes the steps to build time series models. Each step links to detailed explanations and descriptions of the options, where applicable. See the time series overview and description for detailed descriptions of how DataRobot implements time series modeling.
-
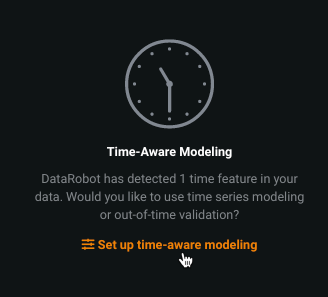
Load your dataset and select the target feature. If the dataset contains a date feature, the Set up time-aware modeling link activates. Click the link to get started.
-
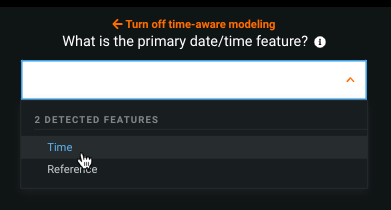
From the dropdown, select the primary date/time feature. The dropdown lists all date/time features that DataRobot detected during EDA1.
-
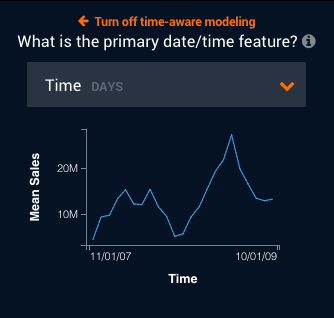
After selecting a feature, DataRobot computes and then loads a histogram of the time feature plotted against the target feature (feature-over-time). Note that if your dataset qualifies for multiseries modeling, this histogram represents the average of the time feature values across all series plotted against the target feature.
-
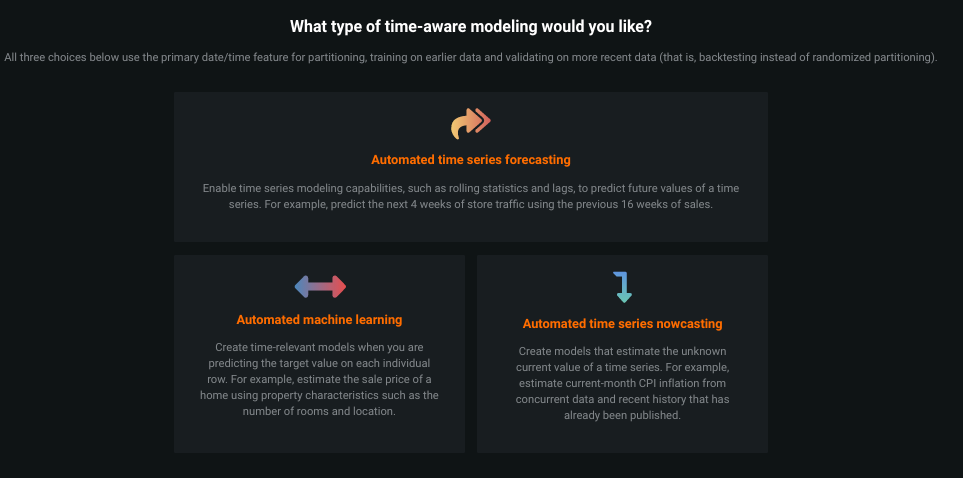
Select the time series approach you would like to apply:
- Use Automated time series forecasting when you want to forecast multiple future values of the target (for example, predicting sales for each day next week). Use this to extrapolate future values in a continuous sequence.
- Use Automated time series nowcasting when you want to use modeling to determine current values.
Or, use Automated machine learning (OTV) when your data is time-relevant but you are not forecasting (instead, you are predicting the target value on each individual row). Use this if you have single event data, such as patient intake or loan defaults.
-
If you selected time series and DataRobot detects series data, set the series ID for multiseries modeling.
- If DataRobot does not detect a series but your dataset qualifies, set the series identifier using Advanced options.
-
To enable segmented modeling, after selecting the series identifier, click to change the value of Segmentation method from None to your segment ID.
-
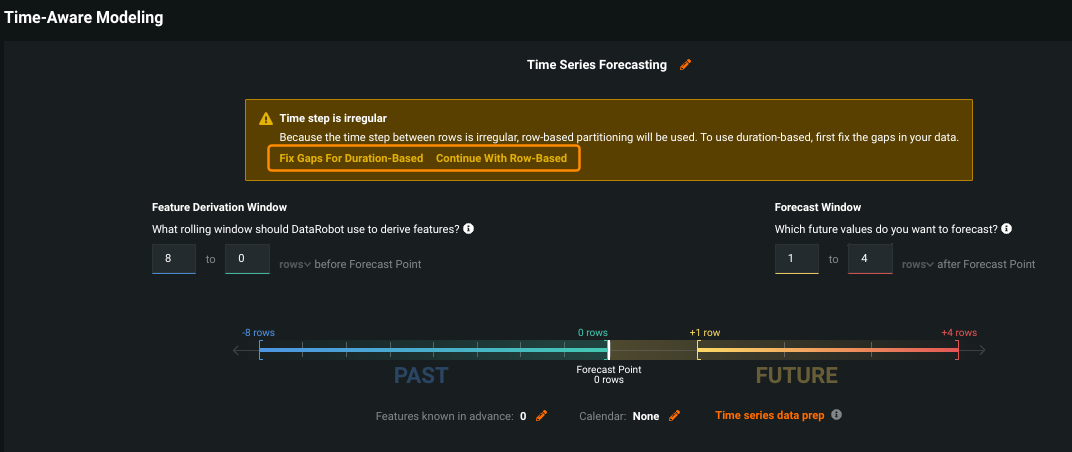
If you were prompted that your time step was irregular, consider employing the data prep tool.
-
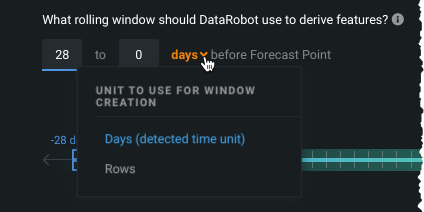
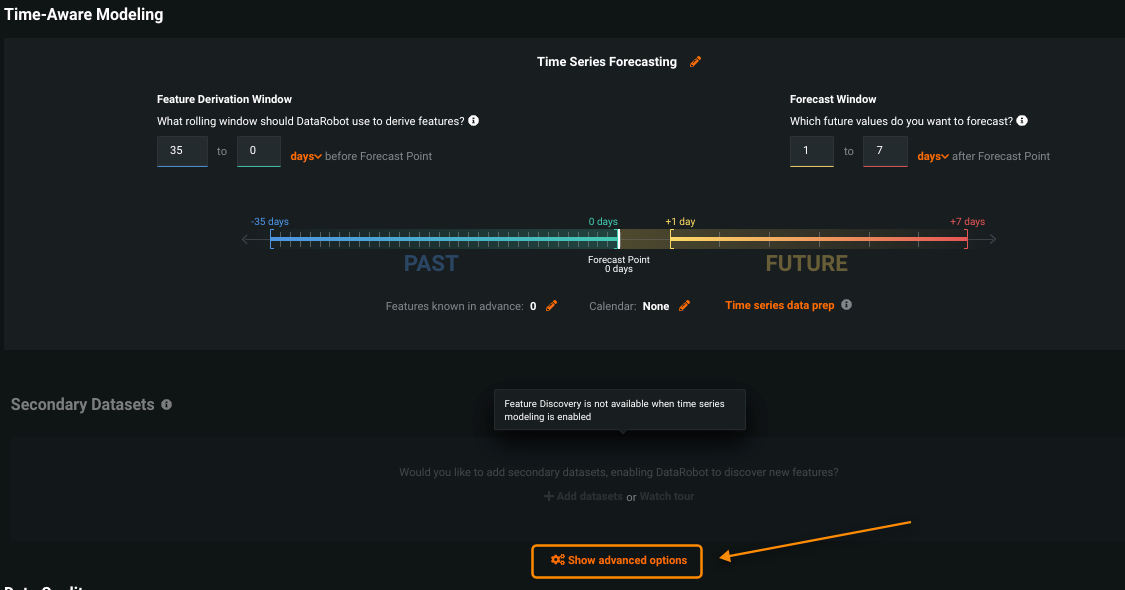
Customize the window settings (Feature Derivation Window (FDW) and Forecast Window (FW)) to configure how DataRobot derives features for the modeling dataset. Before modifying these values, see the detailed guidance for the meaning and implication of each window.
Note
If using nowcasting, these window settings differ.
-
Set the training window format, either Duration or Row Count, to specify how Autopilot chooses training periods when building models. Before setting this value, see the details of row count vs. duration and how they apply to different folds. Note that, for irregular datasets, the setting defaults to Row Count. Use the data prep tool before changing this setting.
-
Consider whether to set "known in advance" (KA) features or to upload an event calendar (both set in the advanced options).
-
Features treated as KA variables are used unlagged when making predictions.
-
Calendars list events for DataRobot to use when automatically deriving time series features (setting features as unlagged when making predictions).
-
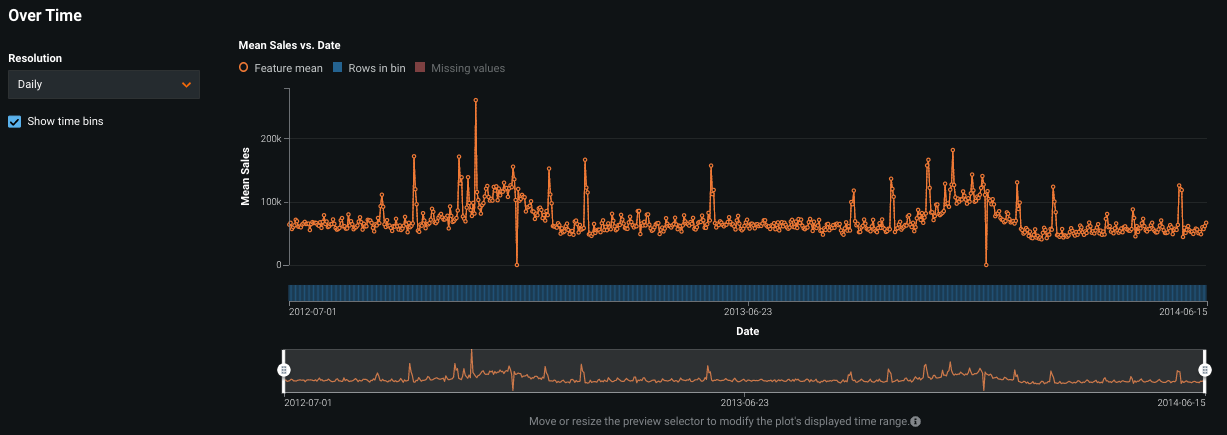
Explore what a feature looks like over time to view its trends and determine whether there are gaps in your data (which is a data flaw you need to know about). To access these histograms, expand a numeric feature and click the expand a numeric feature, click the Over Time tab, and click Compute Feature Over Time:
In this example, you can see a strong weekly pattern as well as a seasonal pattern. You can also change the resolution to see how the data aggregates at different intervals. Click Show time bins to see the number of rows per bin (blue bars at the bottom of the plot). Visualization of data density can provide information about potential missing values.
Read further options for interacting with the Over Time chart.
-
To modify additional settings used for modeling (date/time format, training window, validation length, etc.), scroll down and expand Show advanced options. See the full documentation for more information.
-
Once all configuration is set, choose a modeling mode and press Start.
-
When the modeling process begins, DataRobot analyzes the target and creates time-based features to use for modeling. Display the Data page to watch the new features as they are created. By default DataRobot displays the Derived Modeling Data panel; to see your original data, click Original Time Series Data.
-
Click View more info for more specific feature generation details, including access to the derivation log.
-
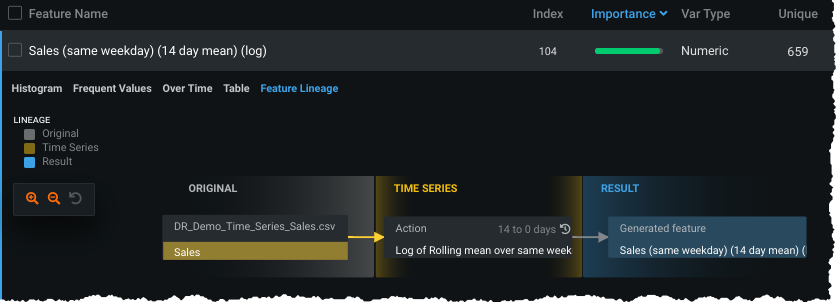
View the Feature Lineage chart to understand the process that created any feature:
-
-
After reviewing the dataset, consider whether you want to restore any features that were pruned by the feature reduction process.
-
Finally, if desired work with the time series feature lists used for modeling.
Next steps
The following sections describe how to continue with time series modeling:
| Section | Description |
|---|---|
| Time series Leaderboard models | Working with Leaderboard models, including changing training and sampling criteria. |
| Making predictions | Making predictions and preparing for deployment. |
| Customize project settings | Modifying default partitioning and window settings for use-case specific implementations. |
And further reading:
| Section | Description |
|---|---|
| Framework | The framework DataRobot uses to build time series models, including common patterns in time series data. |
| Derived modeling dataset | The feature derivation process in DataRobot, which creates a new modeling dataset for time series projects. |
| Feature lists | Specialized for time series modeling. |
| Automated Feature Engineering for Time Series Data | A more technical discussion of the general framework for developing time series models, including generating features and preprocessing the data as well as automating the process to apply advanced machine learning algorithms to almost any time series problem. |
Deep dive: Requirements
The following sections provide details about models and project requirements, including:
-
DataRobot builds both the standard algorithms and special time series blueprints to run specific models for time series. As always, you can run any time series models that DataRobot did not run from the Repository.
-
DataRobot generates both traditional time series models (e.g., the ARIMA family) and advanced time series models (e.g., XGBoost).
-
For models with the suffix "with Forecast Distance Modeling," DataRobot builds a different model for each distance in the future, each having a unique blueprint to make that prediction.
-
The "Baseline prediction using most recent value" model (also known as "naive predictions") uses the most recent value or seasonal differences as the prediction; this model can be used as a baseline for judging performance.
For a time series project with multiple FDs, what do the displayed Leaderboard evaluation metrics correspond to?
When a project has multiple FDs, the Leaderboard metric is a calculated summary across all FDs, across all dates, and across all series. That is, for each FD DataRobot generates predictions for each day in validation and for each series. Then, using actuals for each of those predictions, DataRobot calculate the loss metric such that the Leaderboard shows the loss metrics across all those predictions. If there are too many FDs, sampling is used.
For example, for a project with 30 series, 30 days of validation, and 30 FDs, DataRobot generates 30*30*30 predictions and then applies the loss function.
Time steps
The first step in time series modeling is to be certain that your data is the correct type to employ forecasting or nowcasting. DataRobot categorizes data based on the time step—the typical time difference between rows—as one of three types:
| Time step | Description | Example |
|---|---|---|
| Regular | Regularly spaced events | Monday through Sunday |
| Semi-regular | Data that is mostly regularly spaced | Every business day but not weekends. |
| Irregular | No consistent time step | Random birthdays |
Assuming a regular or semi-regular time step, DataRobot's time series functionality works by encoding time-sensitive components as features, transforming your original input dataset into a modeling dataset that can use conventional machine learning techniques. (Note that a time step is different than a time interval, which is described below.) For each original row of your data, the modeling dataset includes both:
- New rows representing examples of predicting different distances into the future.
- For each input feature, new columns of lagged features and rolling statistics for predicting that new distance.
Note
When a time step is irregular, you can use row-based partitioning or the data prep tool tool (to avoid the inaccurate rolling statistics these gaps can cause).
Data requirements
To activate time-series modeling:
- The time series dataset must meet the file size and row requirements.
- Even if your data contains time features, time series forecasting mode may be disabled if the data contains irregular time units or non-unique time stamps. If this happens, the time series data prep tool for potential solutions.
- The dataset must contain a column with a variable type “Date” for partitioning.
Note
There are times that you may want to partition without holdout, which changes the minimum ingest rows and also the output of various visualizations.
If the requirements above are met, the date/time partitioning feature becomes available through the Set up time-aware modeling link on the Start screen.
Interval units
Although many of the examples in this documentation show a time unit of "days," DataRobot supports several intervals for time series and multiseries modeling. Currently, DataRobot supports time steps that are integer multiples of the following units:
- row
- millisecond
- second
- minute
- hour
- day
- week
- month
- quarter
- year
For example, the time step between rows can be every 15 minutes (a multiple of minutes) but cannot be a fraction such as 13.23 minutes. DataRobot automatically detects the time unit and time step, and if it cannot, rejects the dataset as irregular. Datasets using milliseconds as a time unit must specify training and partitioning boundaries at the second level, and must span multiple seconds, for partitioning to operate correctly. Additionally, they must use the default forecast point to use a fractional-second forecast point.
Project types
DataRobot’s time series modeling supports both regression and binary classification projects. Each type has a full selection of models available from Autopilot or the Repository, specific to the project type. Both types have generally the same workflow and options, with the following differences found in binary classification projects:
- In the advanced option settings, the following are disabled:
- Simple and seasonal differencing are not applied.
- Only classification metrics are supported.
- No differencing is performed, so feature lists using a differenced target are not created. By default, Autopilot runs on
Baseline only (average baseline)andTime Series Informative Features. Note that "average baseline" refers to the average of the target in the feature derivation window. - Classification blueprints do not use naive predictions as offset in modeling.

