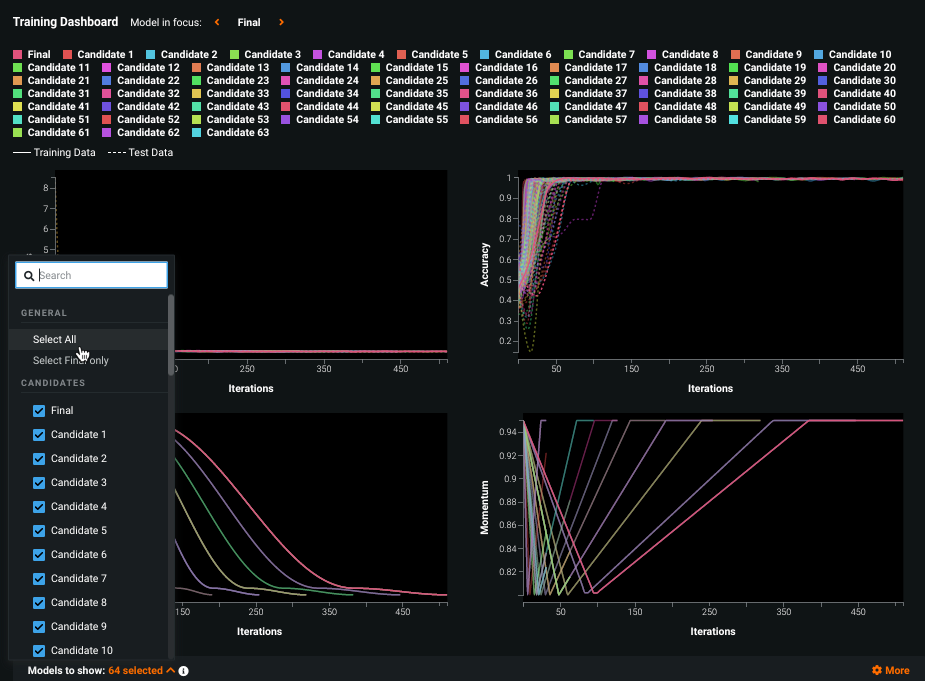
Training Dashboard
Note
The Training Dashboard tab is currently available for Keras-based (deep learning) models only.
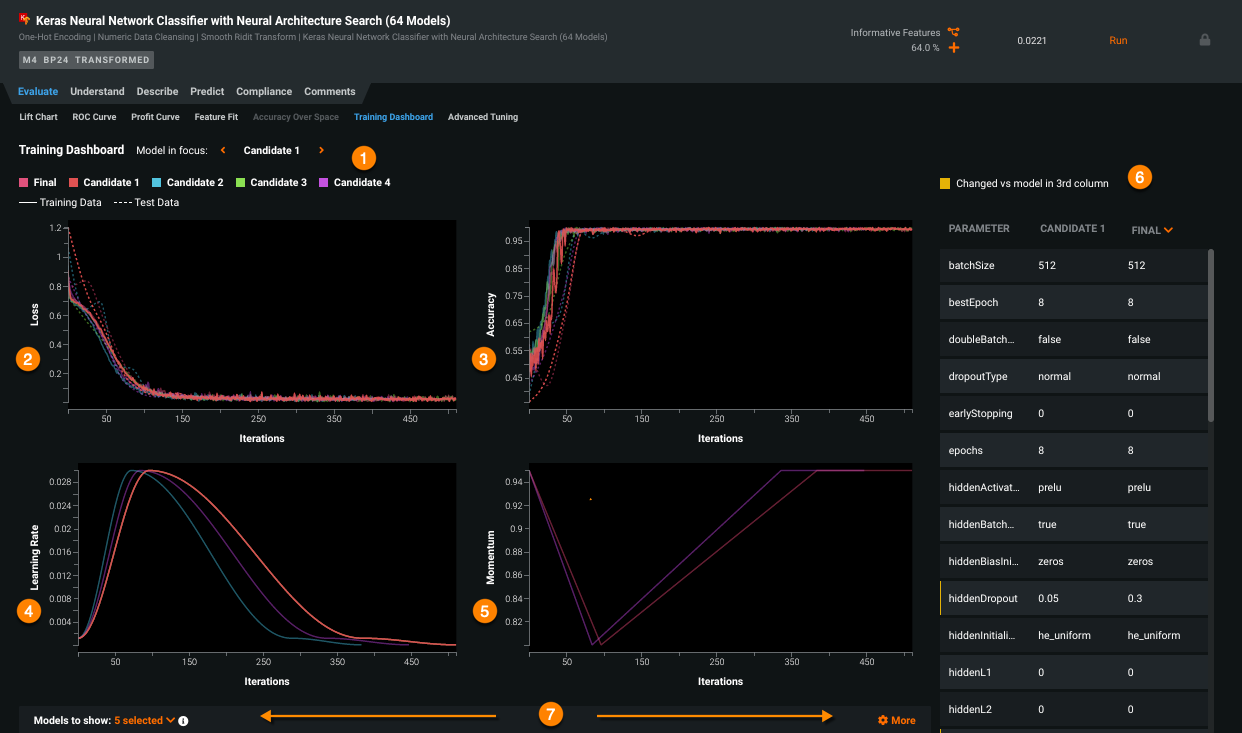
Use the Training Dashboard to get a better understanding about what may have happened during model training. The model training dashboard provides, for each executed iteration, information about a model's:
- training and test loss
- accuracy (classification, multiclass, and multilabel projects only)
- learning rate
- momentum
Running a large grid-search to find the best performing model without first performing a deeper assessment of the model is likely to result in a suboptimal model. From the Training Dashboard tab, you can assess the impact that each parameter has on model performance. Additionally, the tab provides visualizations of the learning rate and momentum schedules to ensure transparency.
Applying both training and test (validation) data for the entire training procedure helps to easily assess whether each candidate model is overfitting, is underfitting, or has a good fit.
The dashboard is comprised of the following functional sections:
- Model selection (1)
- Loss iterations (2)
- Accuracy iterations (3)
- Learning rate (4)
- Momentum (5)
- Hyperparameter comparison chart (6)
- Settings (7)
Hover on any point in a graph to see the exact training (solid line) and, where applicable, test (dotted line) values for a specific iteration.
Model selection
From the model selection controls, choose a model to highlight ("Model in focus") in the informative graphs by cycling through the available options or clicking a model name in the legend. Each graph, where applicable, will bring results for that model to the foreground; other model results are still available but of low opacity to help with comparison and visibility.
The models available for selection are based on the automation DataRobot applied. For example, if DataRobot used internal heuristics to set hyperparameters and a grid search was not required, you will see only “Candidate 1” and “Final”. If DataRobot performed a grid search or a Neural Architecture Search model was trained, multiple candidate models will be available for comparison.
Candidates models are trained on 85% of the training data and are sorted by lowest to highest, based on project metric performance. The remaining 15% is used to track the performance. Once the best candidate is found, DataRobot creates a final model on the full training data.
Loss graph
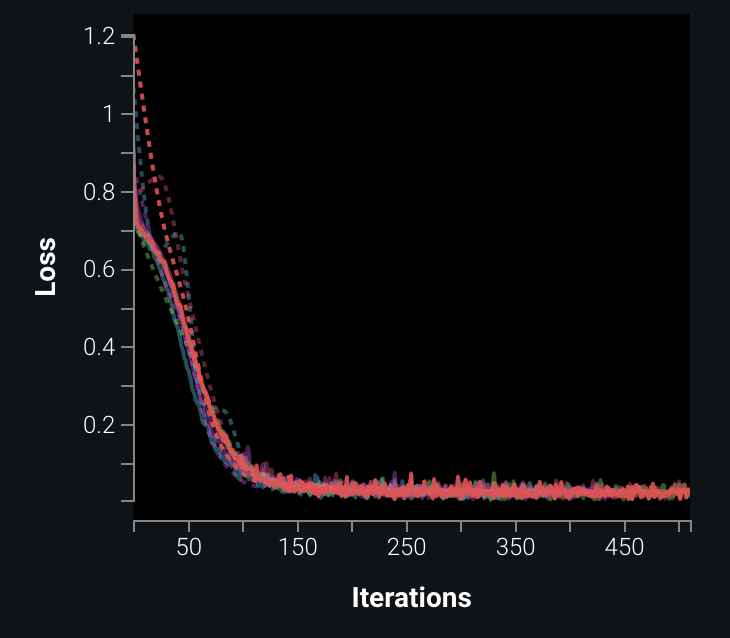
Neural networks are iterative in nature, and as such, the general trend should improve accuracy as weights are updated to minimize the loss (objective) function. The Loss graph illustrates, by number of iterations (X-axis), the results of the loss function (Y-axis). Understanding these loss curves is crucial to understanding whether a model is underfit or overfit.
When plotting the training dataset, the loss should reduce (the curve should lower and flatten) as the number of iterations increases.
Interpretation notes:
- For the testing dataset, loss may start increasing after a certain number of iterations. This might suggest that the model is underfit and not generalizing well enough to the test set.
- Another underfitting warning sign is a graph where the test loss is equivalent to the training loss, and the training loss never approaches 0.
- A test loss that drops and then later rises is an indication that the model has likely started to overfit on the training dataset.
In the following example, notice how test loss almost immediately diverged from training loss, indicating overfitting. For general information on training neural networks and deep learning for tabular data, see this YouTube video.
Accuracy graph
For classification, multiclass, and multilabel only
The Accuracy graph measures how many rows are correctly labeled. When evaluating the graph, look for an increasing value. Is it moving toward 1 and how close does it get? How does it relate to Loss?
In the graphs above, the model gets very accurate around iteration 50 (exceeding 95%), and while the loss is still dropping by quite a bit, it is only half way to the bottom of the curve at iteration 50.
If training stopped at that point, predictions would probably be close to 0.5 (for example, 0.55 for positive and 0.45 for negative). The goal, however, is 0 for negative and 1 for positive. The accuracy reading acts as a kind of "confidence". If you minimize this function and keep training, you can see log loss continue to fall, but accuracy is barely improving (if at all). This is a good heuristic that indicates the model will do better on out of sample data.
Examining accuracy generally provides similar information as examining loss. Loss functions, however, may incorporate other criteria for determining error (e.g., log loss provides a metric for confidence). Comparing accuracy and loss can help inform decisions regarding loss function (is the loss function is appropriate for the problem?). If you tune the loss parameter, the loss function may improve over time but accuracy only slightly increases. This would suggest perhaps other hyperparameters are better applied.
Learning rate
The Learning rate graph illustrates how the learning rate varies over the course of training.
To determine how a neural network's weights should be updated after training on each batch of data, the gradient of the loss function is calculated and multiplied by a small number. That small number is the learning rate.
Using a high learning rate early in training can help regularize the network, but warming up the learning rate first (starting at a low learning rate and increasing) can help mitigate early overfitting. By cyclically varying between reasonable bounds, instead of monotonically decreasing the learning rate, saddle points can be handled more easily (due to their nature of producing very small gradients).
By default, DataRobot both performs a specific cosine variant of the 1cycle method (using a shape found through many experiments) and exposes parameters. This approach provides full control over the scheduled learning rate.
When learning rates are the same between candidate models, lines overlay each other. Click each candidate to see its values.
Momentum
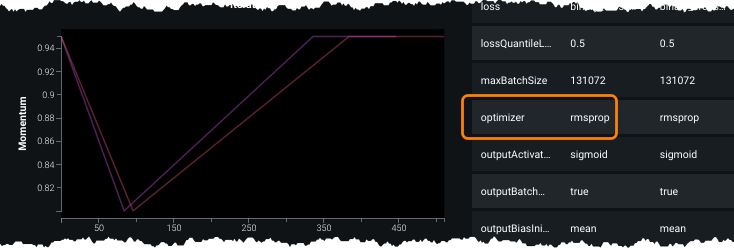
The Momentum graph is only available for models with optimizers that use momentum. It is used by the optimizer to adapt the learning rate and does so by using the previous gradients to help reduce the impact of noisy gradients. It automatically performs larger updates to weights (gradients) when repeatedly moving in one direction, and smaller gradients when nearing a minima.
In the following example, the model uses adam (the default optimizer); the graph illustrates how momentum varies over the course of training.
Any other optimizer does not vary over time and therefore is not shown in the chart.
This external public resource provides more information on popular gradient-based optimization algorithms.
Hyperparameter comparison chart
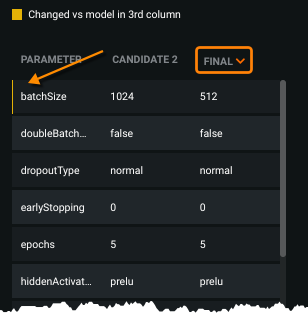
The hyperparameter comparison chart shows—and compares—hyperparameter values for the active candidate model and a selected comparison model.
Use this information to inform decisions about which parameters to tune in order to improve the final model. For example, if a model improves in each candidate with an increased batch size, it might be worth experimenting with an even larger batch size.
Models with different values for a single parameter are highlighted by a yellow vertical bar. Use the chart's scroll bar to view all parameters, which are listed alphabetically.
Most hyperparameters are tunable. Clicking the parameter name in the chart opens the Advanced Tuning tab, where you can change values to run more experiments.
Settings
There are a variety of Training Dashboard settings that change the display and can help interpretability.
Candidate selection
Use the Models to show option to choose which candidate models to display results for. You can manually select, search, select all, or choose the final model. By default, DataRobot displays up to four candidates and the final model. Candidates are ranked and then sorted from highest to lowest performance.
More options
Click More ![]() to manage the display.
to manage the display.
Apply log scale for loss
If it is difficult to fully interpret results, enable the log scale view. Default view:
With log scale applied:
Smooth plots
If the chart is very noisy, it is often useful to add smoothing. The noisier the plot, the more dramatic the effect.
Reduce data points
If many candidates are run, and/or thousands of iterations are shown in the graphs, you may experience performance degradation. When Reduce data points is enabled (the default), DataRobot reduces the number of data points, automatically determining a maximum that still provides a performant interface. If you require every data point included, disable the setting. For data-heavy charts, you should expect degraded performance when the option is disabled.
Only show test data
In displays where test loss is fully hidden behind the training loss, use “Only show test data” to remove training data results from the Loss graph.
