Custom Metrics tab
On a deployment's Custom Metrics tab, you can use the data you collect from the Data Exploration tab (or data calculated through other custom metrics) to compute and monitor custom business or performance metrics. These metrics are recorded on the configurable Custom Metric Summary dashboard, where you monitor, visualize, and export each metric's change over time. This feature allows you to implement your organization's specialized metrics, expanding on the insights provided by built-in Service Health, Data Drift, and Accuracy metrics.
Custom metrics limits
You can have up to 50 custom metrics per deployment, and of those 50, 5 can be hosted custom metrics.
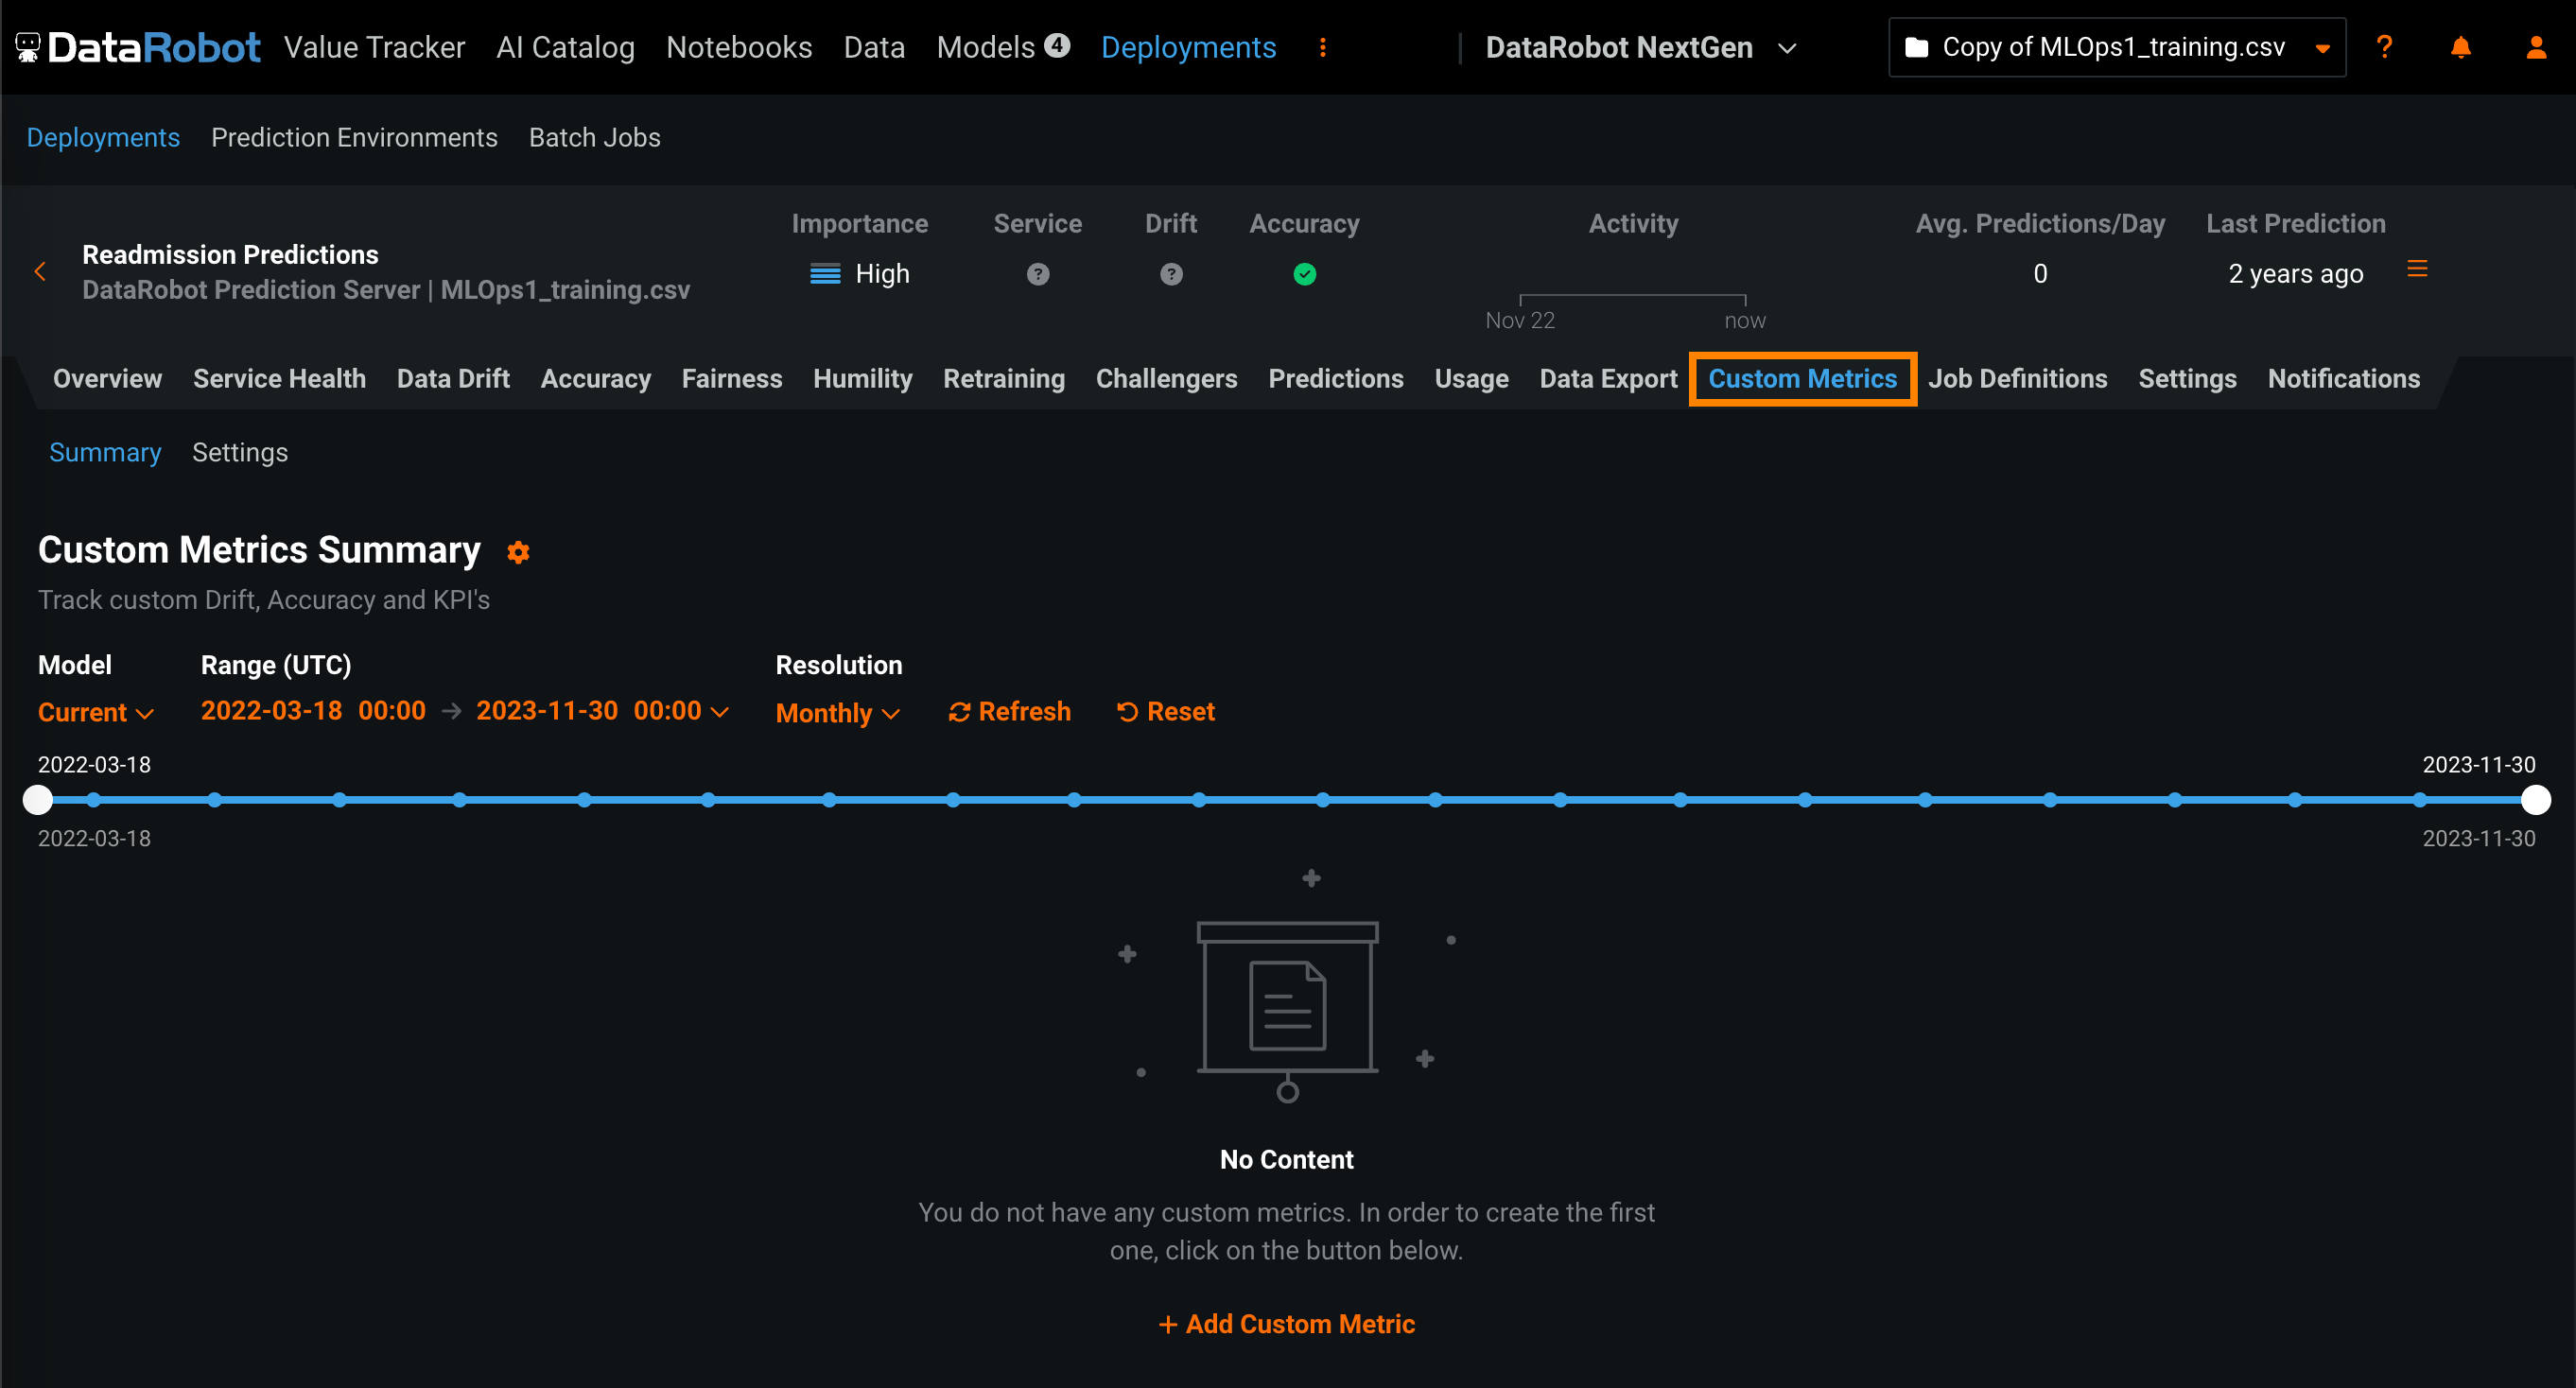
To access custom metrics, in the top navigation bar, click Deployments and, on the Deployments tab, click on the deployment for which you want to create custom metrics. Then, in the deployment, click the Custom Metrics tab. The Summary tab opens:
What types of custom metrics are supported?
Three types of custom metrics are available for use:
| Custom metric type | Description |
|---|---|
| External custom metrics |
|
| Hosted custom metrics |
|
| Hosted custom metric templates |
|
Add external custom metrics
The Custom Metrics tab can track up to 50 metrics. To add custom metrics:
-
On the Custom Metrics > Summary tab, click + Add Custom Metric.
-
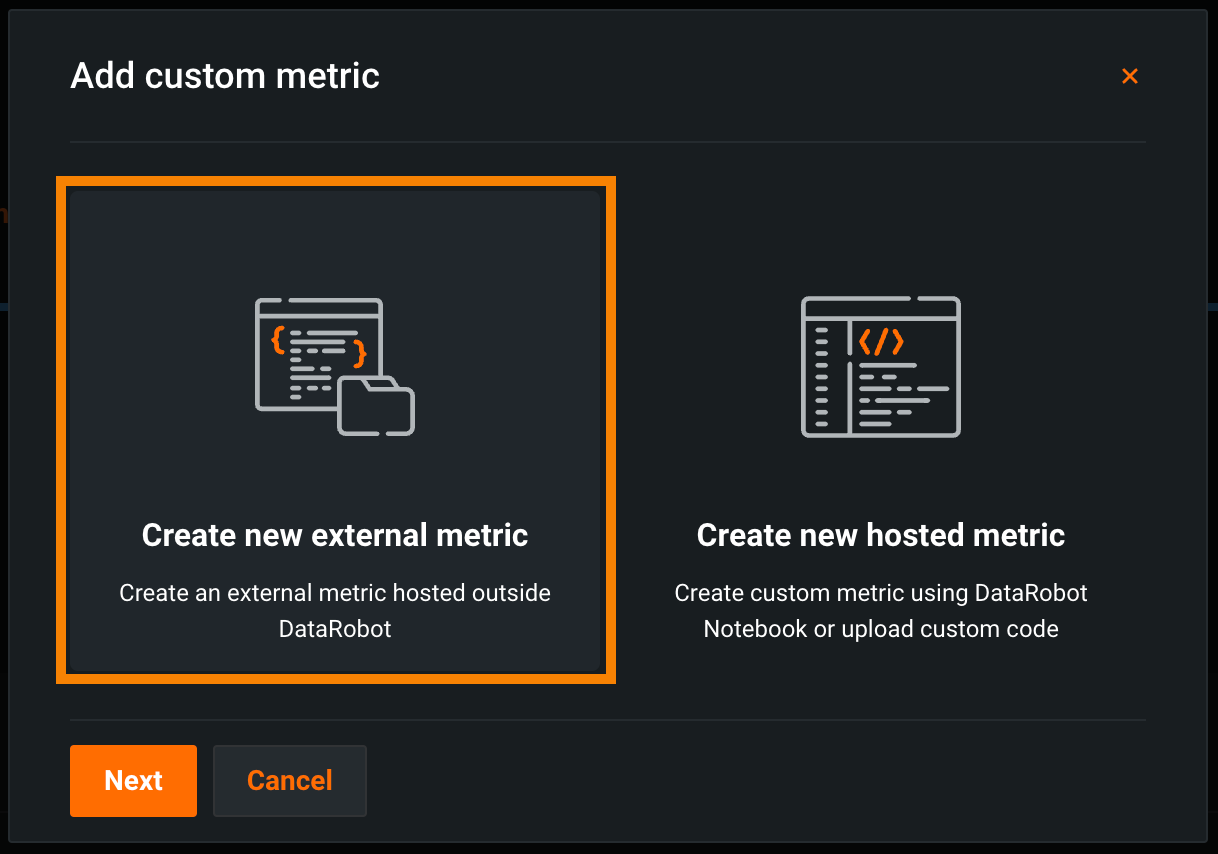
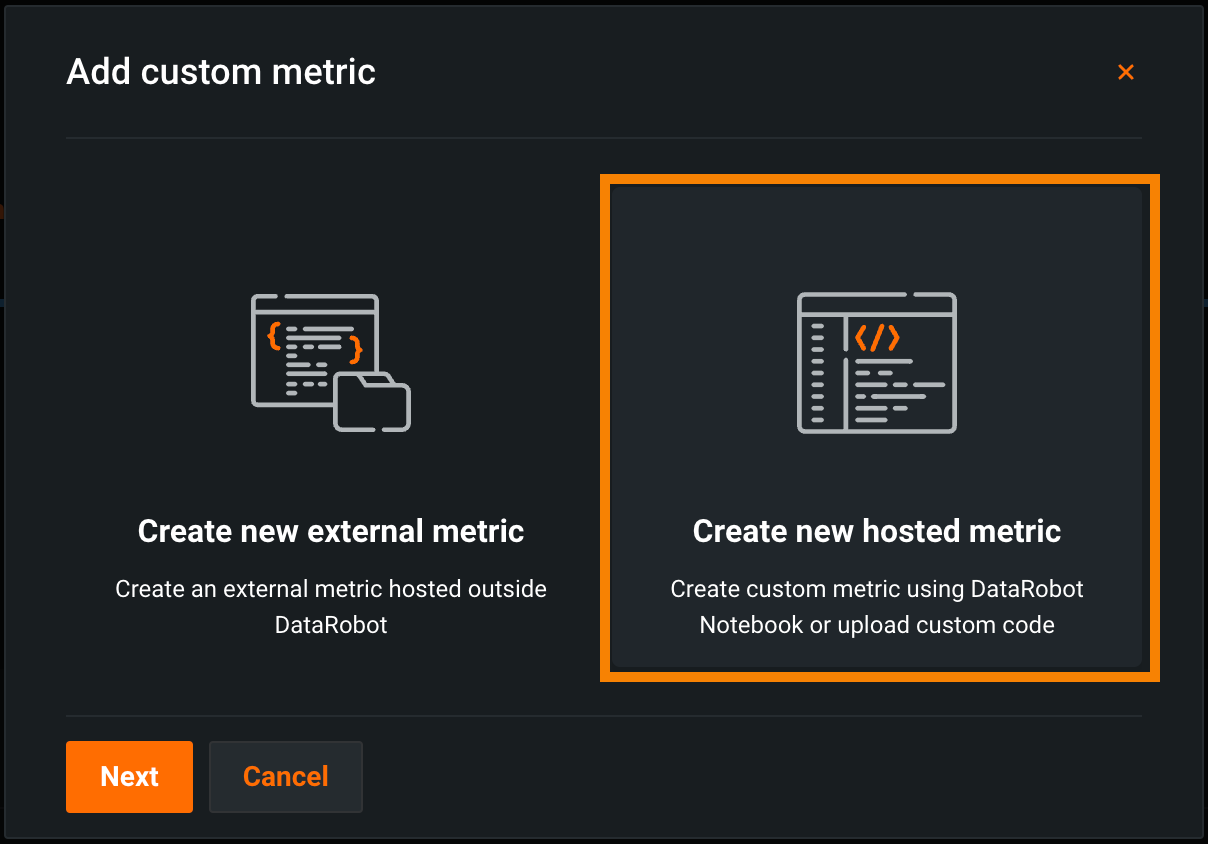
In the Add Custom Metric dialog box, click Create new external metric, then click Next:
-
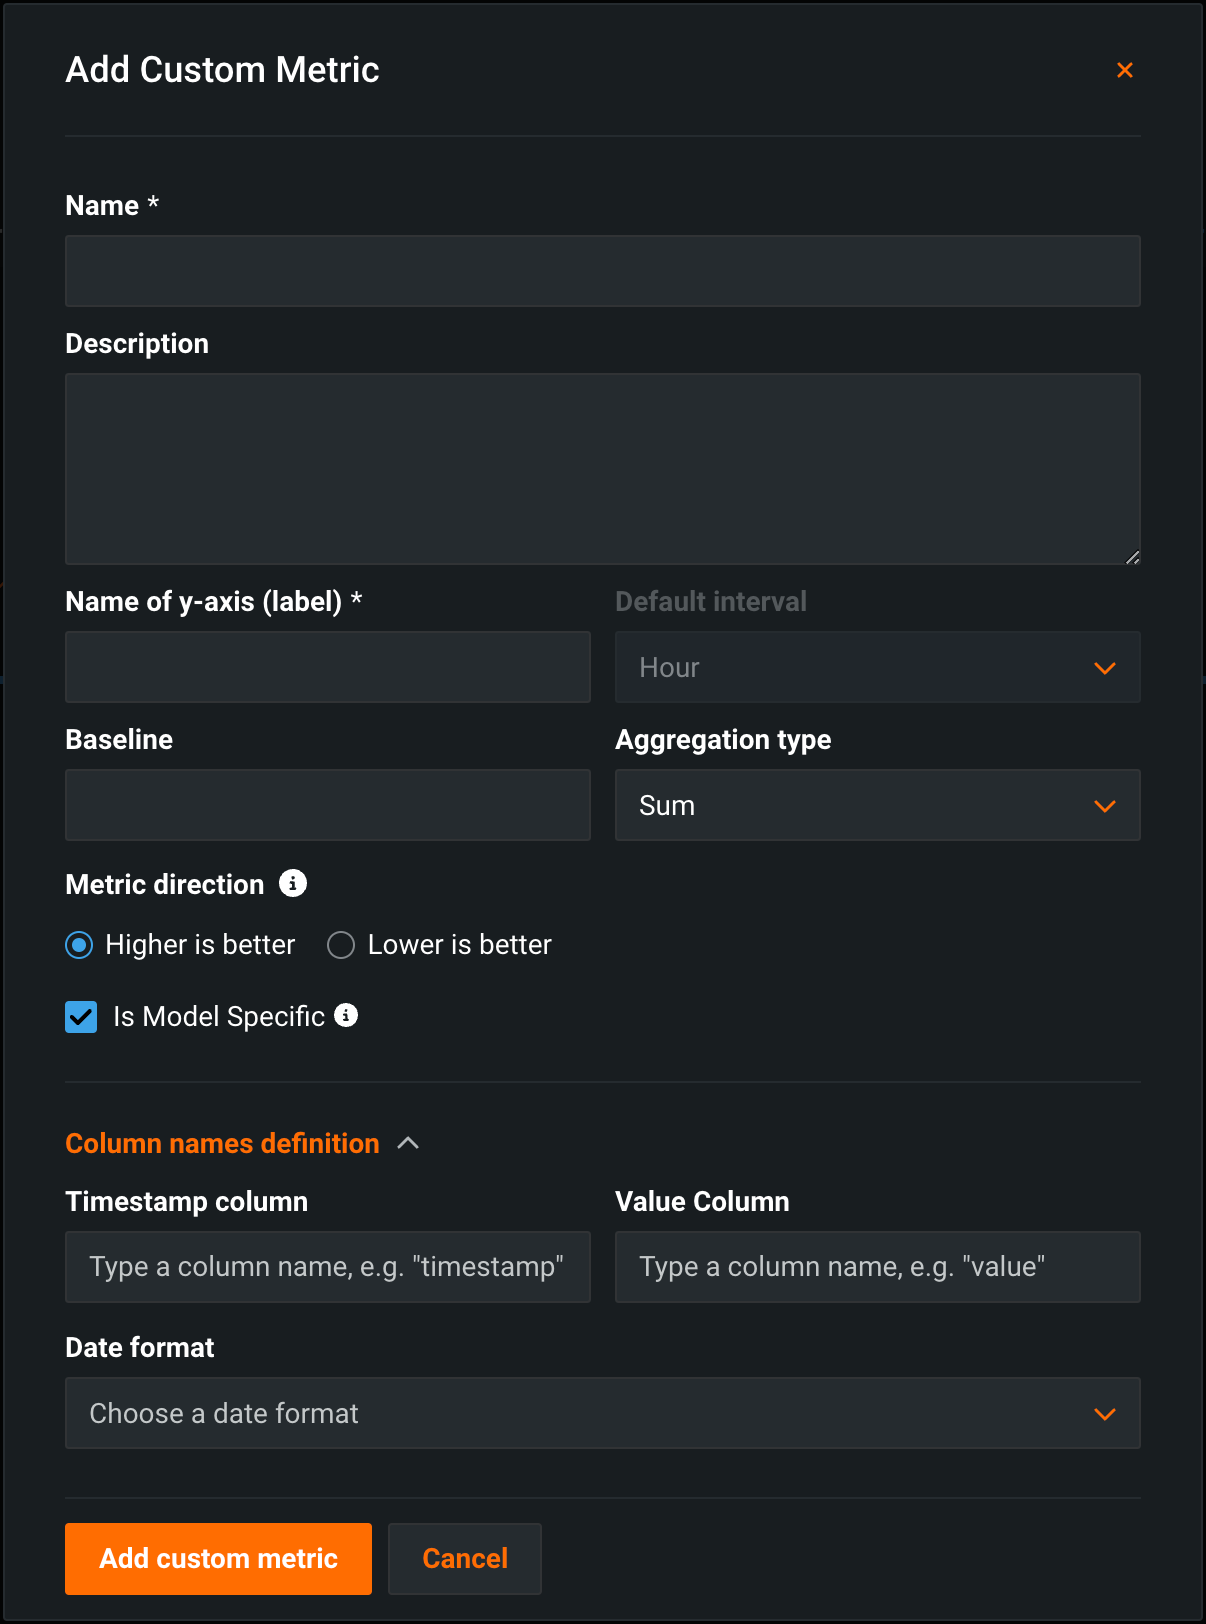
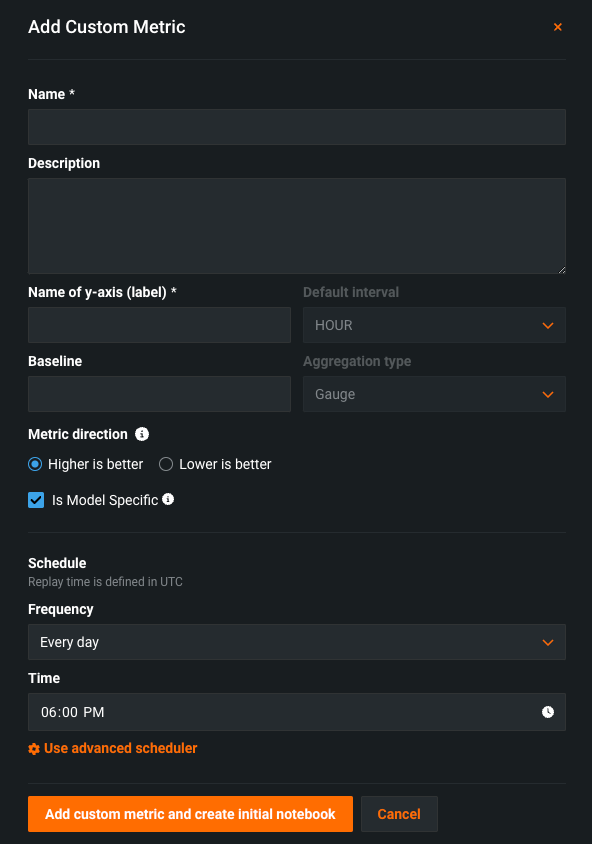
Configure the metric settings in the Add custom metric dialog box:
Field Description Name A descriptive name for the metric. This name appears on the Custom Metric Summary dashboard. Description (Optional) A description of the custom metric; for example, you could describe the purpose, calculation method, and more. Name of y-axis A descriptive name for the dependent variable. This name appears on the custom metric's chart on the Custom Metric Summary dashboard. Default interval The default interval used by the selected Aggregation type. Only HOUR is supported. Baseline (Optional) The value used as a basis for comparison when calculating the x% better or x% worse values. Aggregation type If the metric is calculated as a Sum, Average, or Gauge—a metric with a distinct value measured at single point in time. Metric direction The directionality of the metric and changes how changes the metric are visualized. You can select Higher is better or Lower is better. For example, if you choose Lower is better a 10% decrease in the calculated value of your custom metric will be considered 10% better, displayed in green. Is Model Specific When enabled, links the metric to the model with the Model Package ID (Registered Model Version ID) provided in the dataset. This setting influences when values are aggregated (or uploaded). For example: - Model-specific (enabled): Model accuracy metrics are model specific, so the values are aggregated completely separately. When you replace a model, the chart for your custom accuracy metric only shows data for the days after the replacement.
- Not model-specific (disabled): Revenue metrics aren't model specific, so the values are aggregated together. When you replace a model, the chart for your custom revenue metric doesn't change.
Column names definition Timestamp column The column in the dataset containing a timestamp. Value column The column in the dataset containing the values used for custom metric calculation. Date format (Optional) The date format used by the timestamp column. Note
You can override the Column names definition settings when you upload data to a custom metric.
-
Click Add custom metric.
Upload data to custom metrics
After you create a custom metric, you can provide data to calculate the metric:
-
On the Custom Metrics tab, locate the custom metric for which you want to upload data, and then click the Upload Data icon.
-
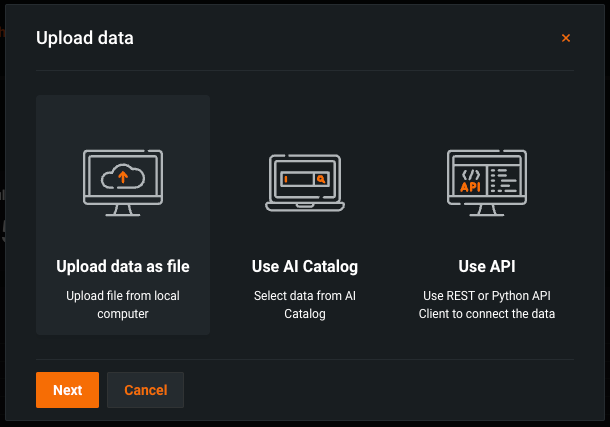
In the Upload Data dialog box, select an upload method, and then click Next:
Upload method Description Upload data as file In the Choose file dialog box, drag and drop file(s) to upload, or click Choose file > Local file to browse your local filesystem, and then click Submit data. You can upload up to 10GB uploaded in one file. Use AI Catalog In the Select a dataset from the AI Catalog dialog box, click a dataset from the list, and then click Select a dataset. The AI Catalog includes datasets from the Data Exploration After you create and configure a deployment, you can use the settings tabs for individual features to add or update deployment functionality: . Use API In the Use API Client dialog box, click Copy to clipboard, and then modify and use the API snippet to upload a dataset. You can upload up to 10,000 values in one API call. -
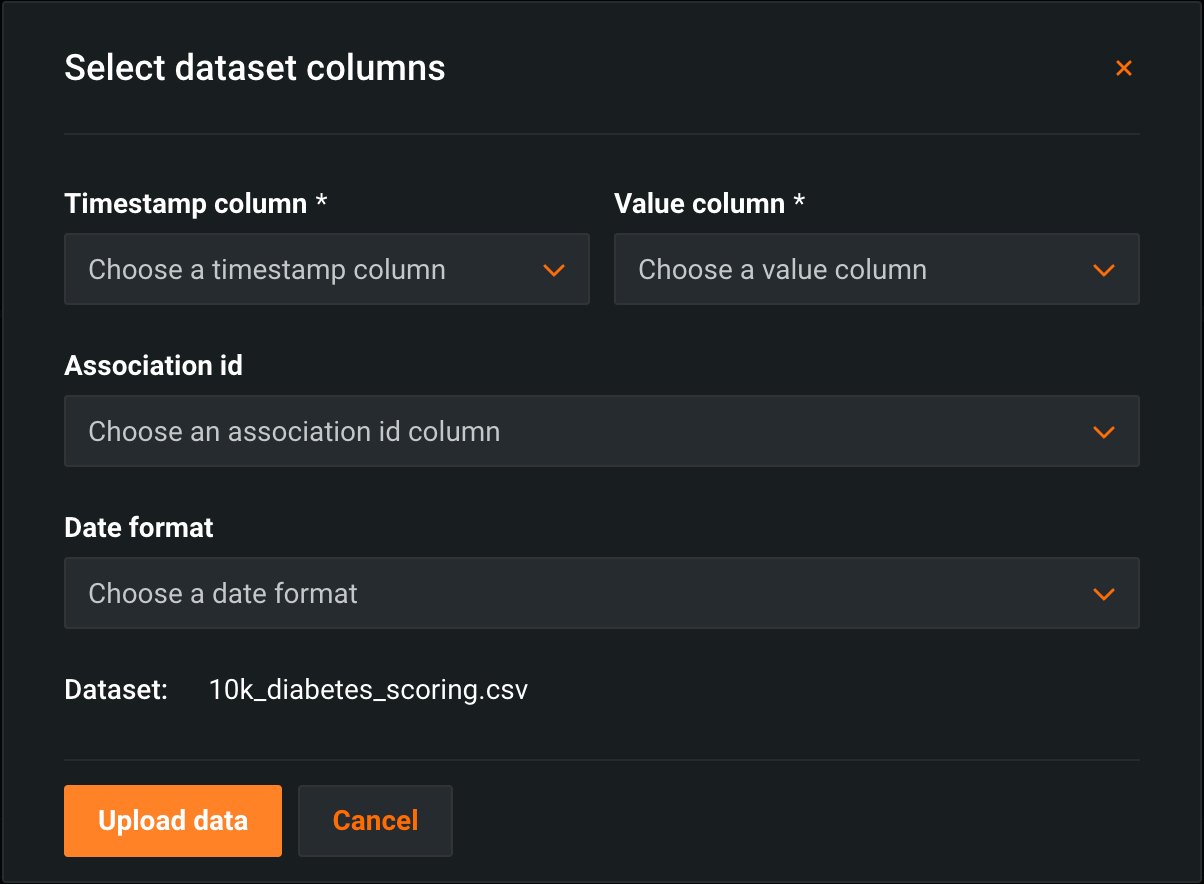
In the Select dataset columns dialog box, configure the following:
Field Description Timestamp column The column in the dataset containing a timestamp. Value column The column in the dataset containing the values used for custom metric calculation. Association ID The row containing the association ID required by the custom metric to link predicted values to actuals. Date format The date format used by the timestamp column. -
Click Upload data.
Report custom metrics via chat requests
For DataRobot-deployed text generation and agentic workflow custom models that implement the chat() hook, custom metric values can be reported directly in chat completion requests using the extra_body field. This allows reporting custom metrics at the same time as making chat requests, without needing to upload data separately.
Manual chat request construction
The OpenAI client converts the extra_body parameter contents to top-level fields in the JSON payload of the chat POST request. When manually constructing a chat payload, without the OpenAI client, include “datarobot_metrics": {...} in the top level of the payload.
To report custom metrics via chat requests:
-
Ensure the deployment has an association ID column defined and moderation configured. These are required for custom metrics to be processed.
-
Define custom metrics on the Custom Metrics tab as described in Add external custom metrics.
-
When making a chat completion request using the OpenAI client, include
datarobot_metricsin theextra_bodyfield with the metric names and values to report:
from openai import OpenAI

openai_client = OpenAI(
    base_url="https://<your-datarobot-instance>/api/v2/deployments/{deployment_id}/",
    api_key="<your_api_key>",
)

extra_body = {
    # These values pass through to the LLM
    "llm_id": "azure-gpt-6",
    # If set here, replaces the auto-generated association ID
    "datarobot_association_id": "my_association_id_0001",
    # DataRobot captures these for custom metrics
    "datarobot_metrics": {
        "field1": 24,
        "field2": 25
    }
}

completion = openai_client.chat.completions.create(
    model="datarobot-deployed-llm",
    messages=[
        {"role": "system", "content": "Explain your thoughts using at least 100 words."},
        {"role": "user", "content": "What would it take to colonize Mars?"},
    ],
    max_tokens=512,
    extra_body=extra_body
)

print(completion.choices[0].message.content)
Custom metric requirements
- A matching custom metric for each name in
datarobot_metricsmust already be defined for the deployment. - Custom metric values reported this way must be numeric.
- The deployed custom model must have an association ID column defined and moderation configured for the metrics to be processed.
For more information about using extra_body with chat requests, including how to specify association IDs, see the chat() hook documentation.
Add hosted custom metrics
DataRobot offers custom metrics for deployments to compute and monitor custom business or performance metrics. With hosted custom metrics, not only can you implement up to five of your organization's specialized metrics in a deployment, but also upload and host code using DataRobot Notebooks to easily add custom metrics to other deployments.
Custom metrics limits
You can have up to 50 custom metrics per deployment, and of those 50, 5 can be hosted custom metrics.
Time series support
The DataRobot Model Metrics (DMM) library does not support time series models, specifically data export for time series models. To export and retrieve data, use the DataRobot API client.
To begin hosting custom metrics:
-
On the Custom Metrics tab, click + Add Custom Metric.
-
In the Add Custom Metric dialog box, click Create new hosted metric, click Next:
-
Configure the metric settings in the Add custom metric dialog box:
Field Description Name (Required) A descriptive name for the metric. This name appears on the Custom Metric Summary dashboard. Description A description of the custom metric; for example, you could describe the purpose, calculation method, and more. Name of y-axis (Required) A descriptive name for the dependent variable. This name appears on the custom metric's chart on the Custom Metric Summary dashboard. Default interval Determines the default interval used by the selected Aggregation type. Only HOUR is supported. Baseline Determines the value used as a basis for comparison when calculating the x% better or x% worse values. Aggregation type Determines if the metric is calculated as a Sum, Average, or Gauge—a metric with a distinct value measured at single point in time. Metric direction Determines the directionality of the metric, which controls how changes to the metric are visualized. You can select Higher is better or Lower is better. For example, if you choose Lower is better, a 10% decrease in the calculated value of your custom metric will be considered 10% better, displayed in green. Is model-specific When enabled, this setting links the metric to the model with the Model Package ID (Registered Model Version ID) provided in the dataset. This setting influences when values are aggregated (or uploaded). For example: - Model-specific (enabled): Model accuracy metrics are model specific, so the values are aggregated separately. When you replace a model, the chart for your custom accuracy metric only shows data for the days after the replacement.
- Not model-specific (disabled): Revenue metrics aren't model specific, so the values are aggregated together. When you replace a model, the chart for your custom revenue metric doesn't change.
Schedule Defines when the custom metrics are populated. Select a frequency (hourly, daily, monthly, etc.) and a time. Select Advanced schedule for more precise scheduling options. -
Click Add custom metric from notebook.
Test custom metrics with custom jobs
Availability information
Notebooks for hosted custom metrics are off by default. Contact your DataRobot representative or administrator for information on enabling this feature.
Feature flag: Enable Notebooks Custom Environments
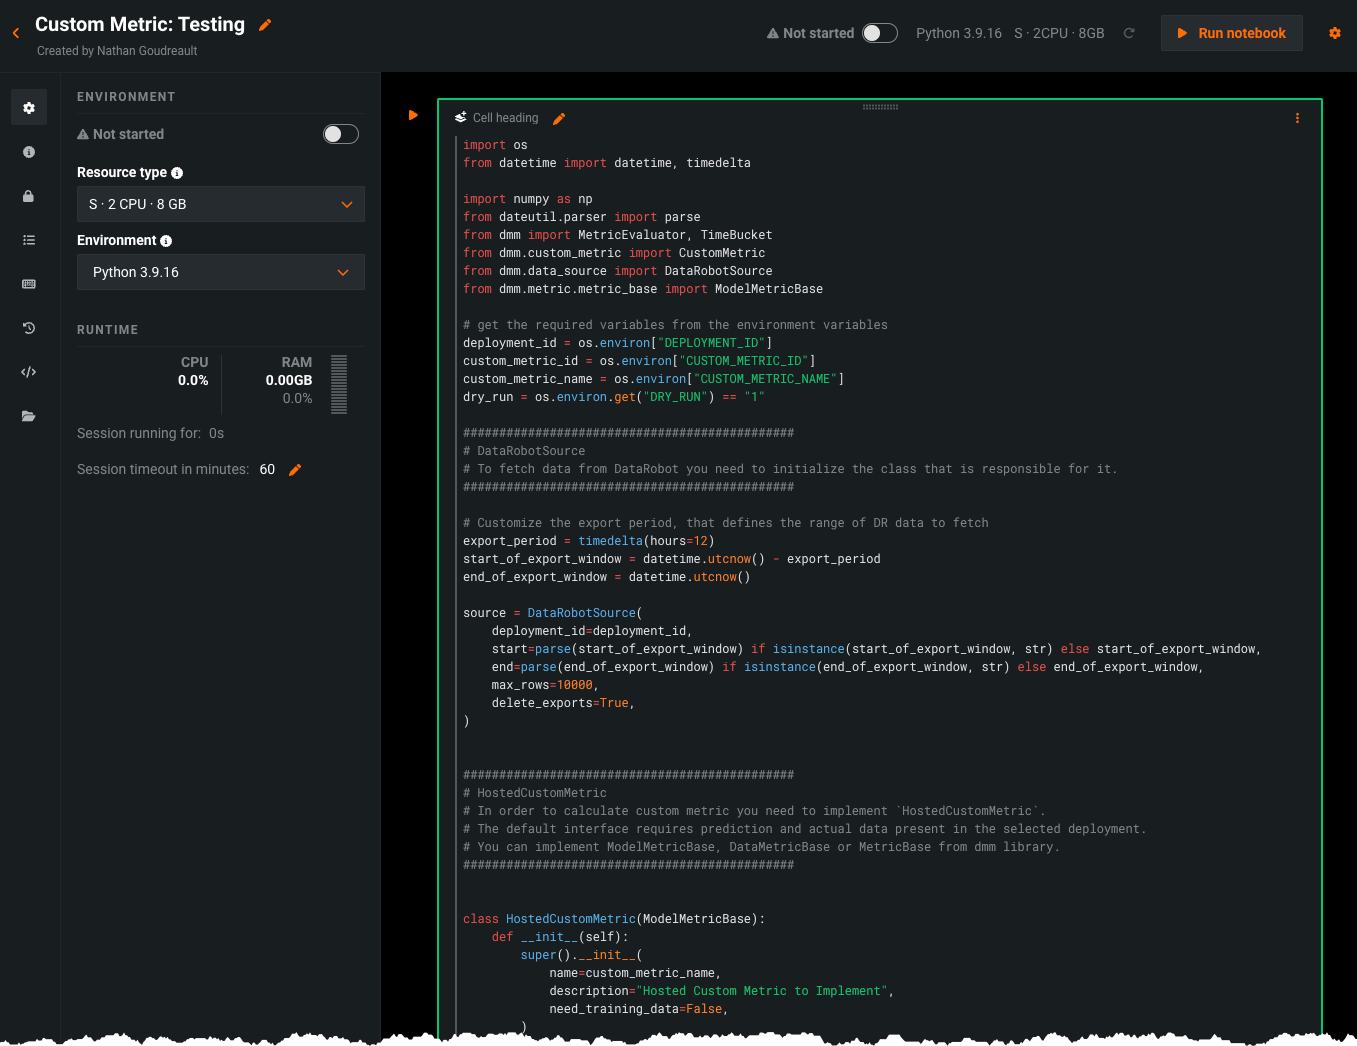
After configuring a custom metric, DataRobot loads the notebook that contains the code for it. The notebook contains one custom metric cell, a unique type of notebook cell that contains Python code defining how the metric is exported and calculated, code for scoring, and code to populate the metric.
Modify the code in the custom metric cell as needed. Then, test the code by clicking Test custom metric code at the bottom of the cell. The test creates a custom job.
- If the test runs successfully, click Deploy custom metric code to add the custom metric to your deployment.
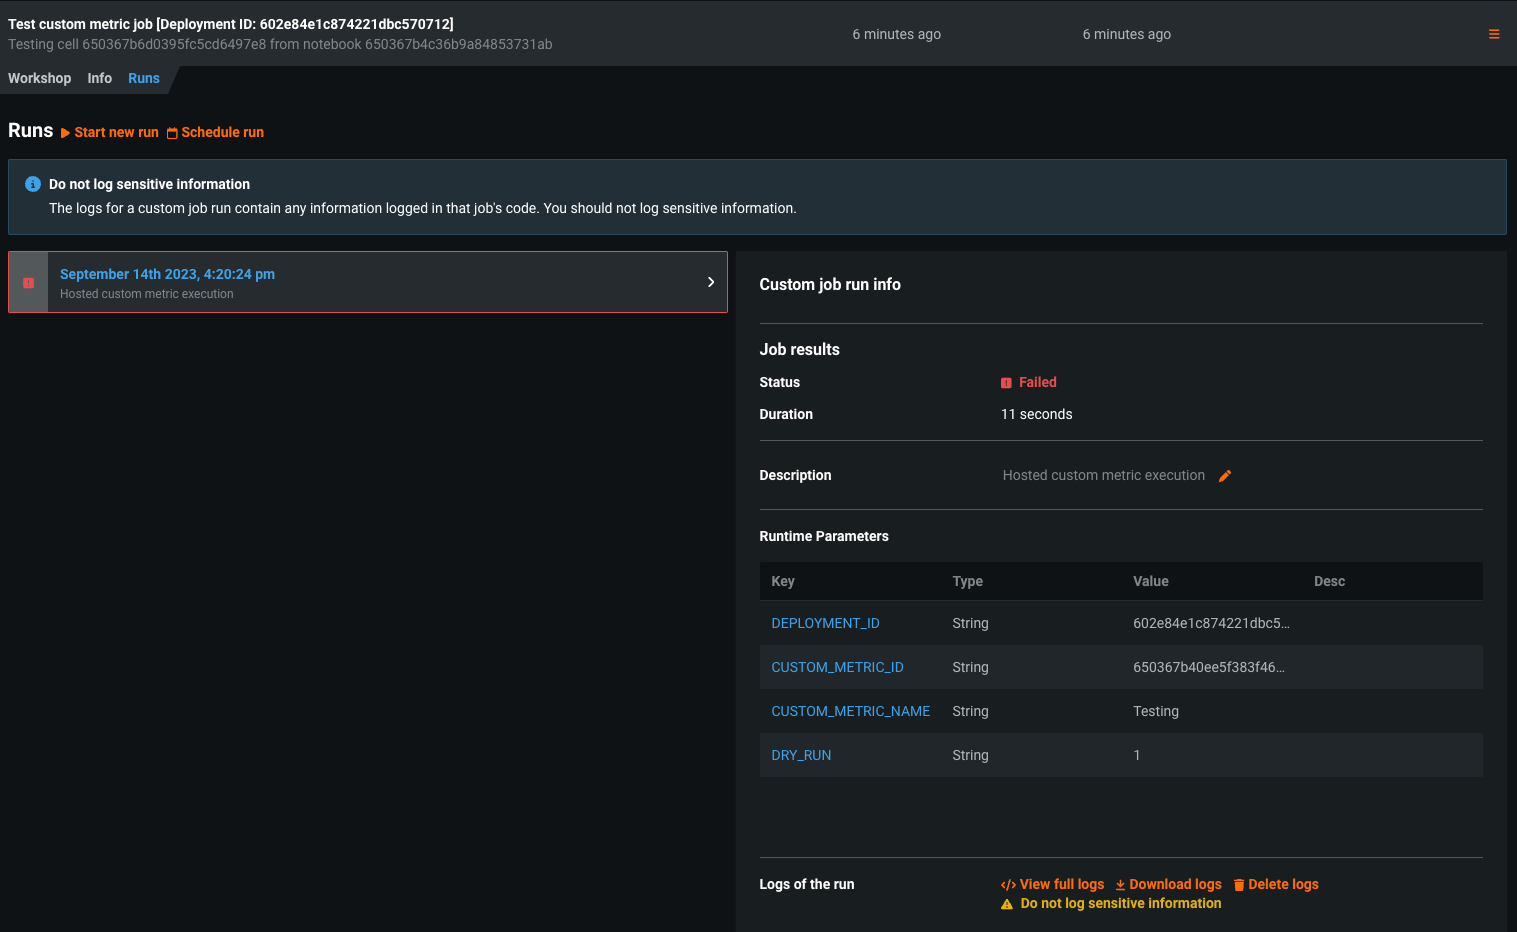
- If the code does not run properly, you will receive the Testing custom metric code failed warning after testing completes:
Troubleshoot custom metric code
To troubleshoot a custom metric's code, navigate to the Model Registry, select the Custom Jobs tab, and access the custom job that ran for testing. The job's Runs tab contains a log of the failed test, which you can browse by selecting View full logs.
To troubleshoot failed tests, DataRobot recommends browsing the logs for each failed test. Additionally, the custom jobs interface allows you to modify the schedule for the custom metric from the Workshop tab by selecting Schedule run.
Manage custom metrics
On the Custom Metrics dashboard, after you've added your custom metrics, you can edit, arrange, or delete them.
Edit or delete metrics
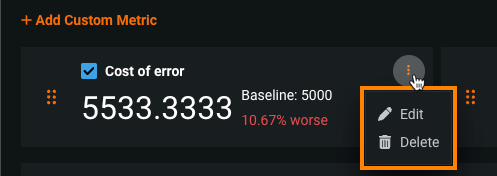
To edit or delete a metric, on the Custom Metrics tab, locate the custom metric you want to manage, and then click the Actions menu :
-
To edit a metric, click Edit, update any configurable settings, and click Update custom metric.
-
To delete a metric, click Delete.
Arrange or hide metrics
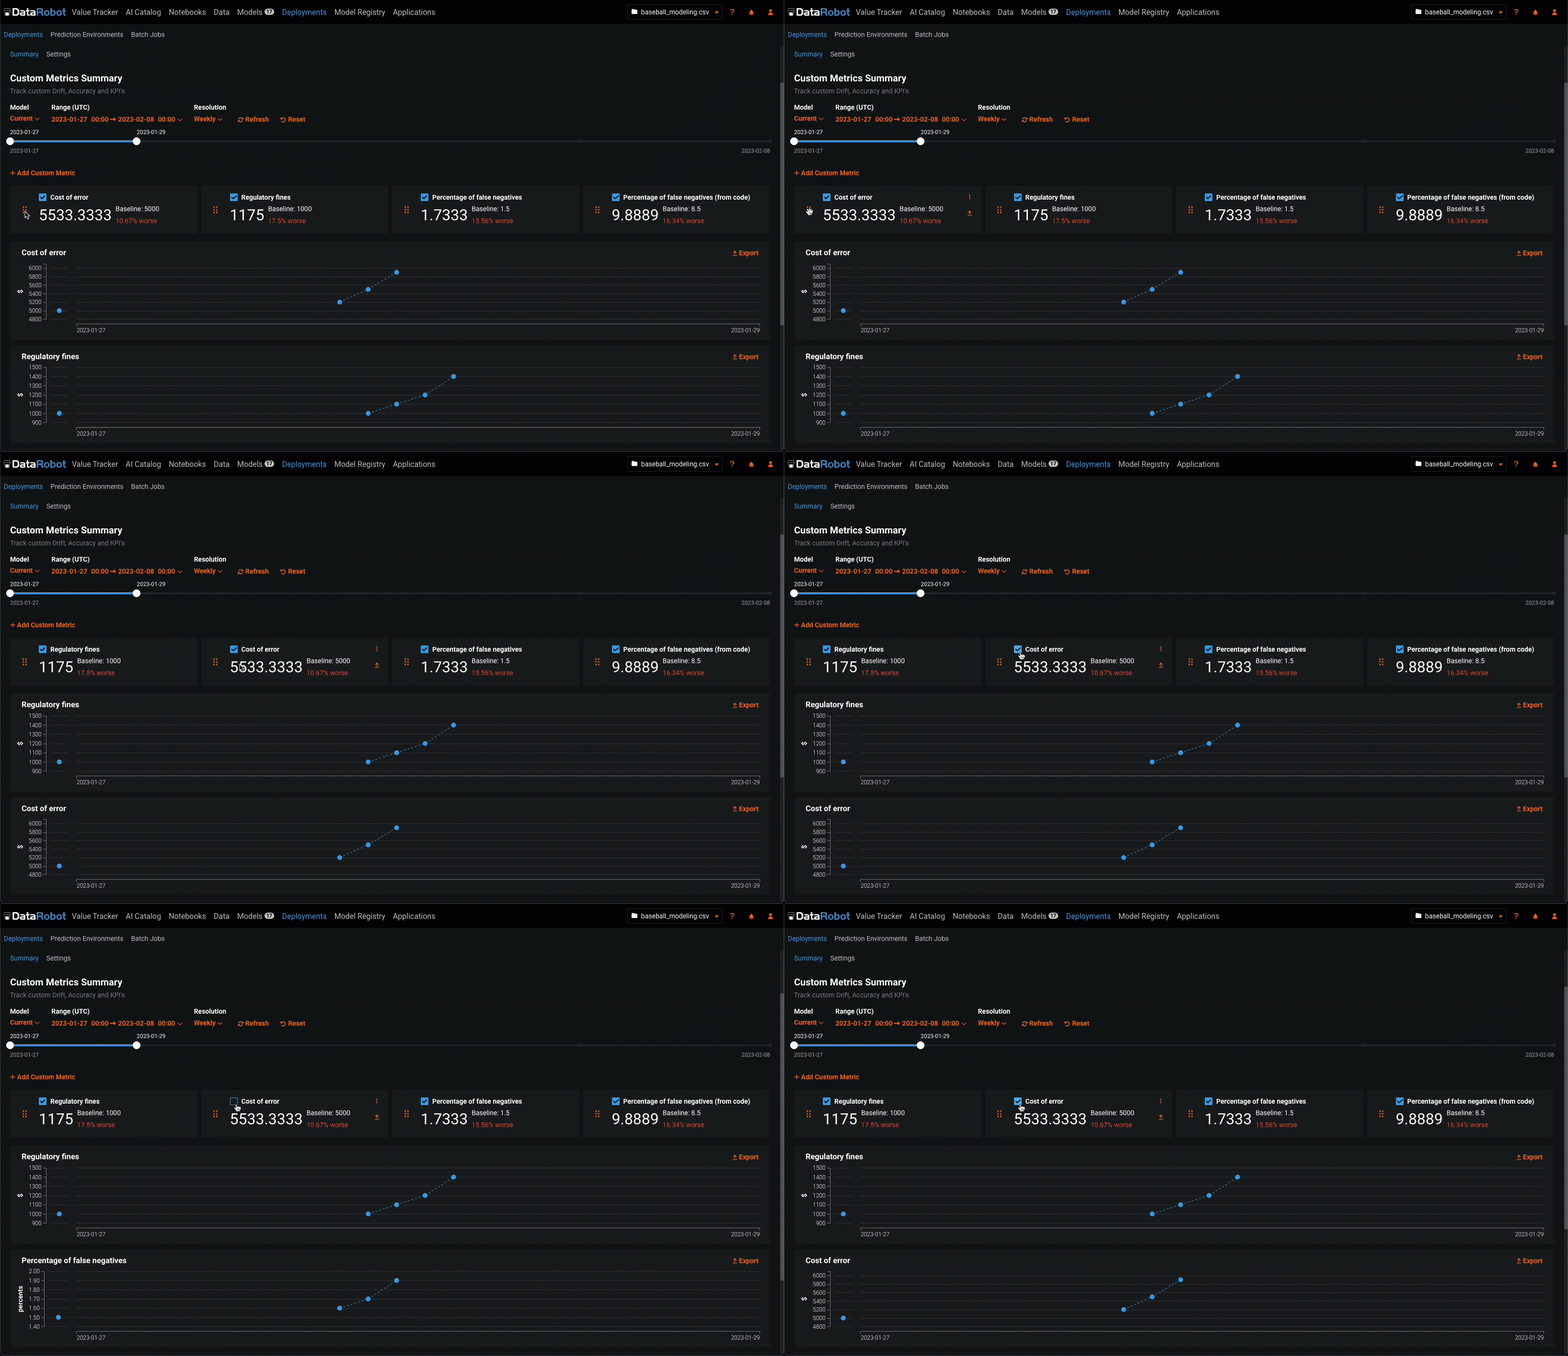
To arrange or hide metrics on the Custom Metric Summary dashboard, locate the custom metric you want to move or hide:
-
To move a metric, click the grid icon (
 ) on the left side of the metric tile and then drag the metric to a new location.
 -
To hide a metric's chart, clear the checkbox next to the metric name.
Configure the custom metric dashboard display settings
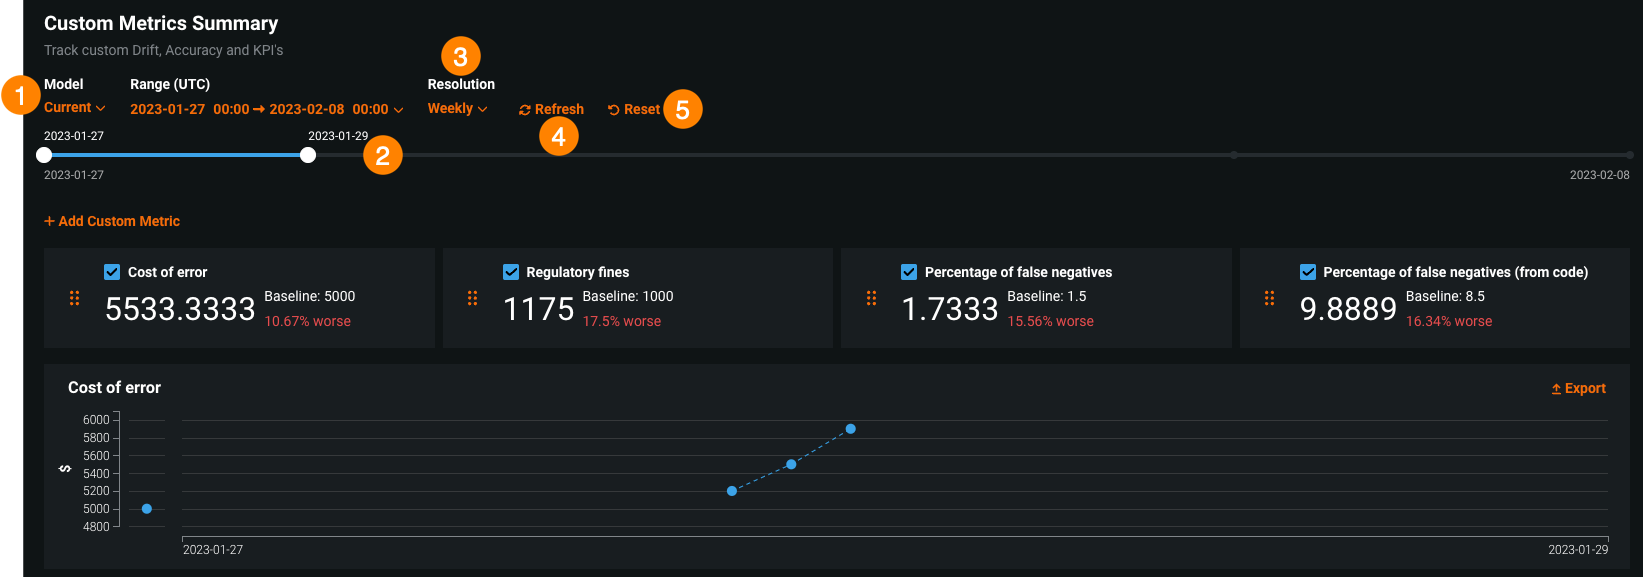
Configure the following settings to specify the custom metric calculations you want to view on the dashboard:
Custom metrics for evaluation and moderation require an association ID
For the metrics added when you configure evaluations and moderations, to view data on the Custom metrics tab, ensure that you set an association ID and enable prediction storage before you start making predictions through the deployed LLM. If you don't set an association ID and provide association IDs alongside the LLM's predictions, the metrics for the moderations won't be calculated on the Custom metrics tab. After you define the association ID, you can enable automatic association ID generation to ensure these metrics appear on the Custom metrics tab. You can enable this setting during or after deployment.
| Setting | Description | |
|---|---|---|
| 1 | Model | Select the deployment's model, current or previous, to show custom metrics for. |
| 2 | Range (UTC) | Select the start and end dates of the period from which you want to view custom metrics. |
| 3 | Resolution | Select the granularity of the date slider. Select from hourly, daily, weekly, and monthly granularity based on the time range selected. If the time range is longer than 7 days, hourly granularity is not available. |
| 4 | Refresh | Refresh the custom metric dashboard. |
| 5 | Reset | Reset the custom metric dashboard's display settings to the default. |
