Feature Associations
Accessed from the Data page, the Feature Associations tab provides a matrix to help you track and visualize associations within your data. This information is derived from different metrics that:
- Help to determine the extent to which features depend on each other.
- Provide a protocol that partitions features into separate clusters or "families."
The matrix is:
-
Created during EDA2 using the feature importance score.
-
Based on numeric and categorical features found in the Informative Features feature list.
To use the matrix, click the Feature Associations tab on the Data page.
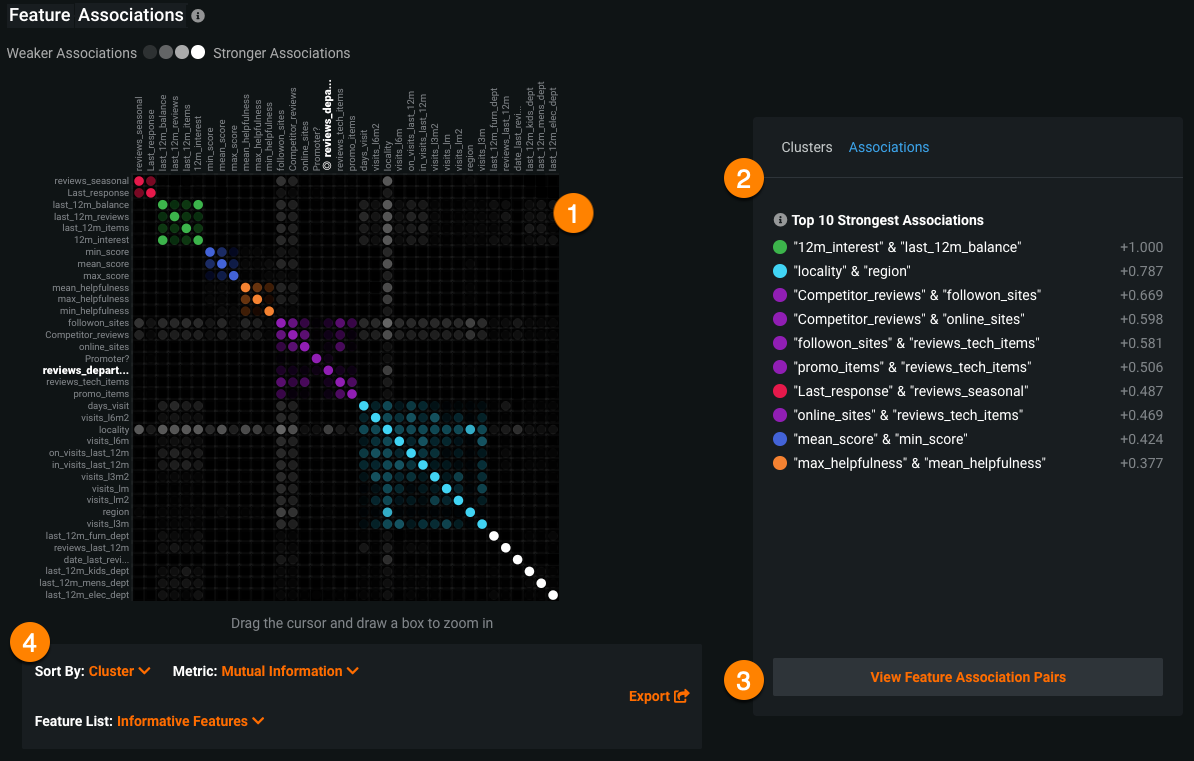
The page displays a matrix (1) with an accompanying details pane (2) for more specific information on clusters, general associations, and association pairs. From the details pane, you can view associations and relationships between specific feature pairs (3). Below the matrix is a set of matrix controls (4) to modify the view.
The Feature Associations matrix provides information on association strength between pairs of numeric and categorical features (that is, num/cat, num/num, cat/cat) and feature clusters. Clusters, families of features denoted by color on the matrix, are features partitioned into groups based on their similarity. With the matrix's intuitive visualizations you can:
- Quickly perform association analysis and better understand your data.
- Gain understanding of the strength and nature of associations.
- Detect families of pairwise association clusters.
- Identify clusters of high-association features prior to model building (for example, to choose one feature in each group for model input while differencing the others).
View the matrix
Once EDA2 completes, the matrix becomes available. It lists up to the top 50 features, sorted by cluster, on both the X and Y axes. Look at the intersection of a feature pair for an indication of their level of co-occurrence. By default, the matrix displays by the Mutual Information values.
The following are some general takeaways from looking at the default matrix:
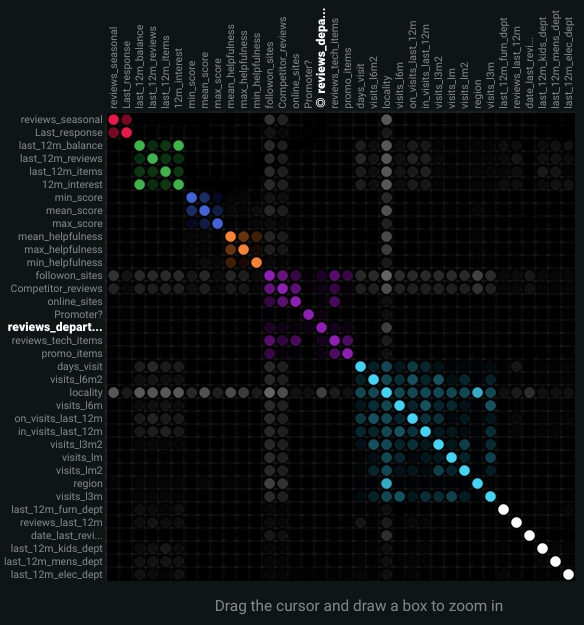
- The target feature is bolded in white.
- Each dot represents the association between two features (a feature pair).
- Each cluster is represented by a different color.
- The opacity of color indicates the level of co-occurrence (association or dependence) 0 to 1, between the feature pair. Levels are measured by the set metric, either mutual information or Cramer's V.
- Shaded gray dots indicate that the two features, while showing some dependence, are not in the same cluster.
- White dots represent features that were not categorized into a cluster.
- The "Weaker ... Stronger" associations legend is a reminder that the opacity of the dots in the metric represent the strength of the metric score.
Clicking points in the matrix updates the detail pane to the right. To reset to the default view, click again in the selected cell. Use the controls beneath the matrix to change the display criteria.
You can also filter the matrix by importance, which instead ranks your top 50 features by ACE (importance) score for binary classification, regression, and multiclass projects.
Work with the display
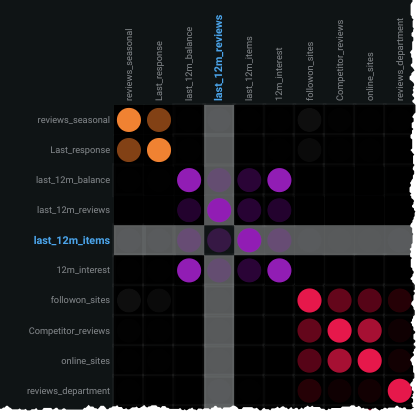
Click on any point in the matrix to highlight the association between the two features:
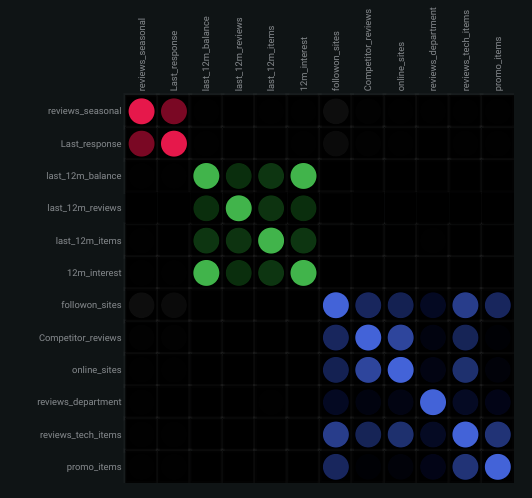
Drag the cursor to outline any section of the matrix. DataRobot zooms the matrix to display only those points within your drawn boundary. Click Reset Zoom in the control pane to return to the full matrix view.
Note that you can export either the zoomed or full matrix by clicking ![]() in the upper left.
in the upper left.
Details pane
By default, with no matrix cells selected, the details pane:
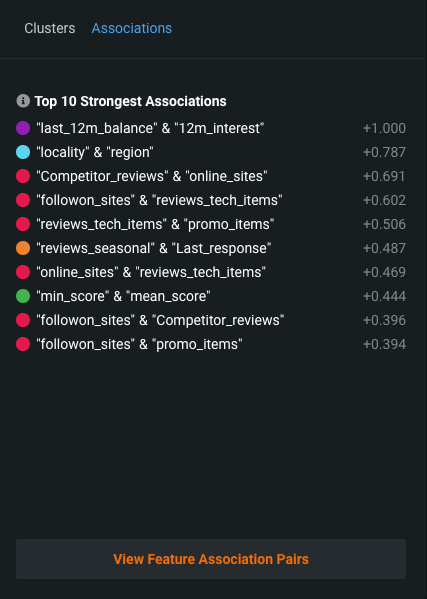
- Displays the strongest associations (Associations tab) found, ranked by association metric score.
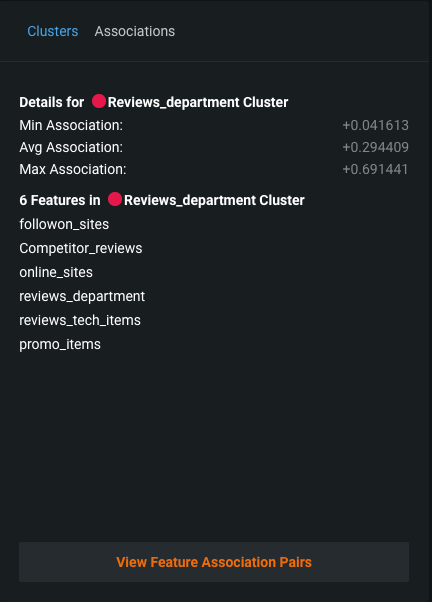
- Displays a list of all identified clusters (Clusters tab) and their average metric score.
- Provides access to charting of feature pair association details.
The listings are based on internal calculations DataRobot runs when creating the matrix.
Associations tab
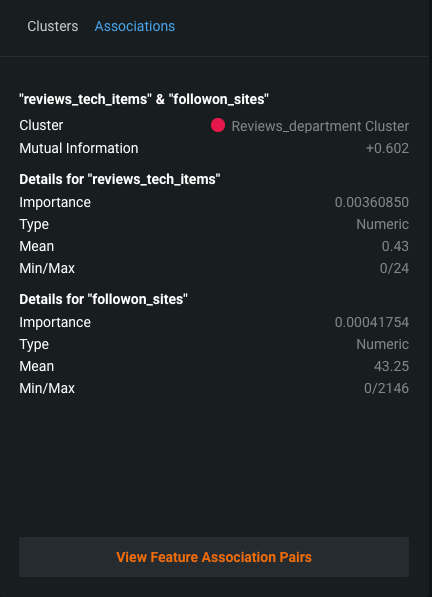
Once a cell is selected in the matrix, the Associations tab updates to reflect information specific to the selected feature pair:
The table below describes the fields:
| Category | Description |
|---|---|
| "feature_1" & "feature_2" | |
| Cluster | The cluster that both features of the pair belong to, or if from different clusters, displays "None." |
| Metric name | A measure of the dependence features have on each other. The value is dependent on the metric set, either Mutual Information or Cramer's V. |
| Details for "feature_1" Details for "feature_2" |
|
| Importance | The normalized importance score, rounded to three digits, indicating a feature's importance to the target. This is the same value as that displayed on the Data page. |
| Type | The feature's data type, either numeric or categorical. |
| Mean | From the Data page, the mean of the feature value. |
| Min/Max | From the Data page, the minimum and maximum values of the feature. |
| Strong associations with "feature_1" | |
| feature_1 | When you select a feature's intersection with itself on the matrix, a list of the five most strongly associated features, based on metric score. |
Clusters tab
By default DataRobot displays all found clusters, ranked by the average metric score. These rankings illustrate the clusters with the strongest dependence on each other. The displayed name is based on the feature in the cluster with the highest importance score relative to the target. Clicking on a point in the matrix changes the Clusters tab display to report:
- Score details for the cluster.
- A list of all member features.
Feature association pairs
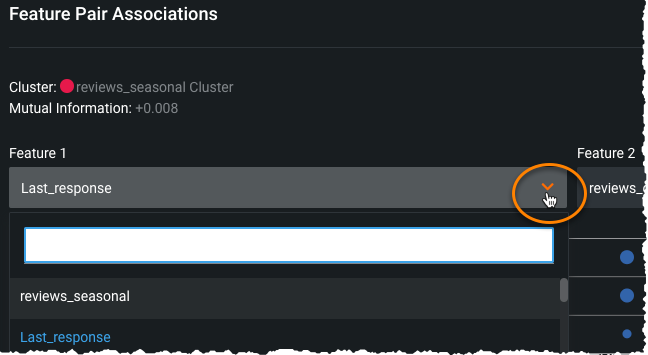
Click View Feature Association Pairs to open a modal that displays plots of the individual association between the two features of a feature pair. From the resulting insights, you can see the values that are impacting the calculation, the "metrics of association." Initially, the plots auto-populate to the points selected in the matrix (which are also those highlighted in the details pane). For each display, DataRobot displays the cluster that the feature with the highest metric score belongs to as well as the metric association score for the feature pair. You can change features directly from the modal (and the cluster and score update):
The insight is the same whether accessed from the Clusters or the Associations tab. Once displayed, click Download PNG to save the insight.
There are three types of plots that display, type being dependent on the data type:
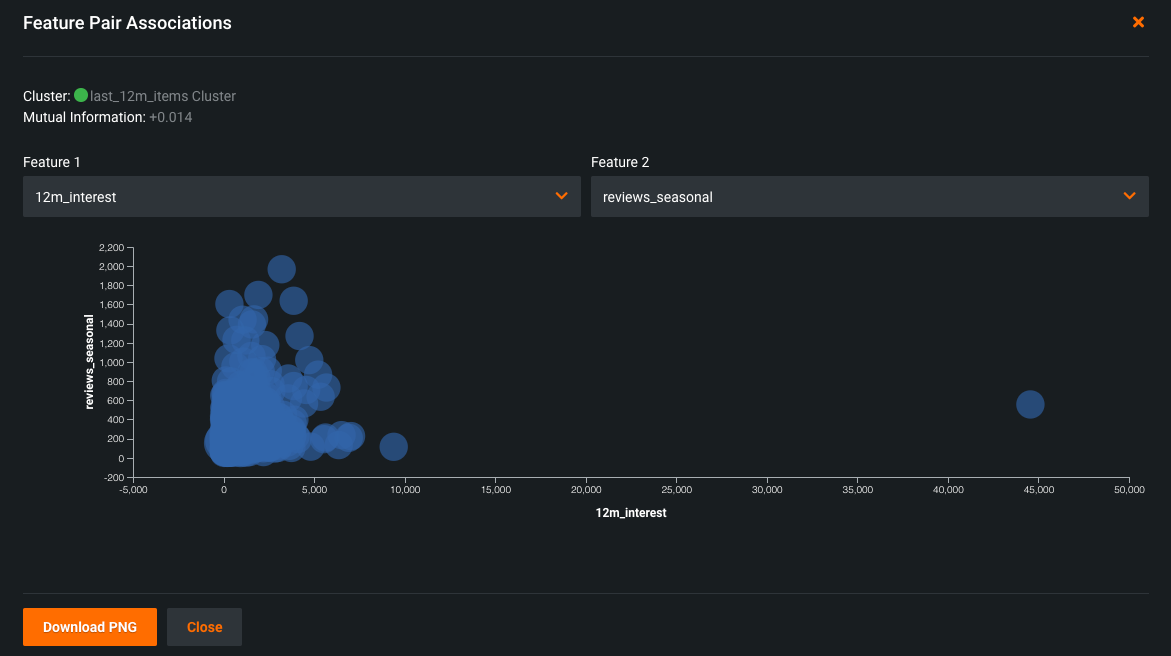
- Scatter plots for numeric vs. numeric features.
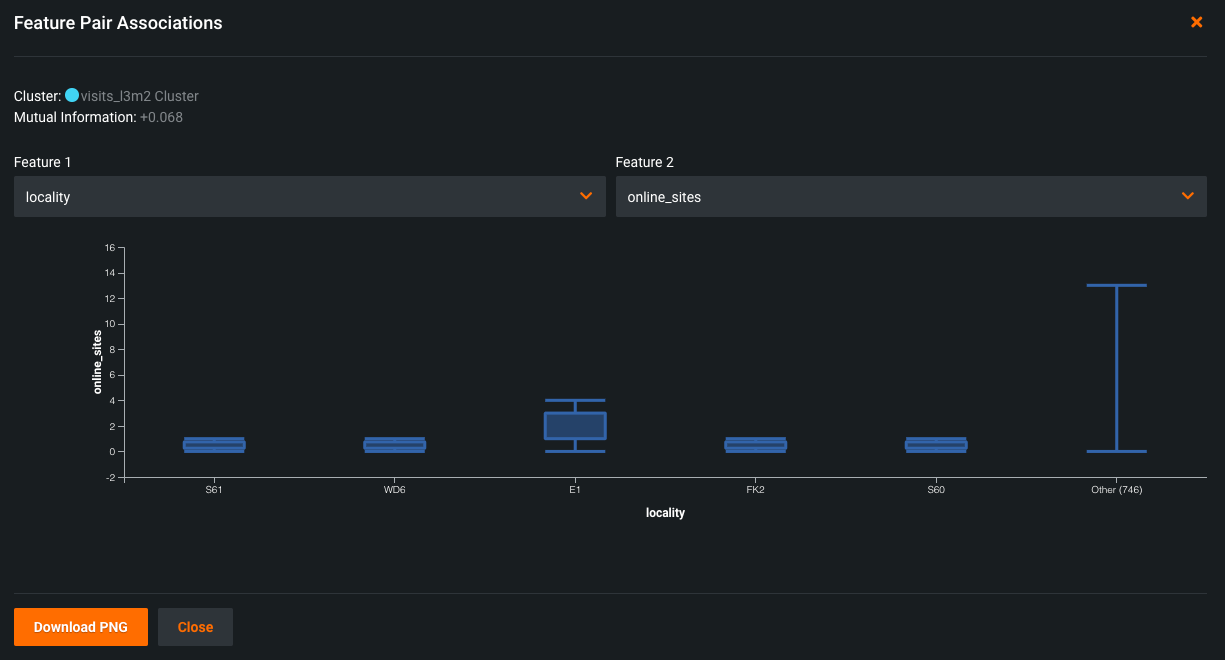
- Box and whisker plots for numeric vs. categorical features.
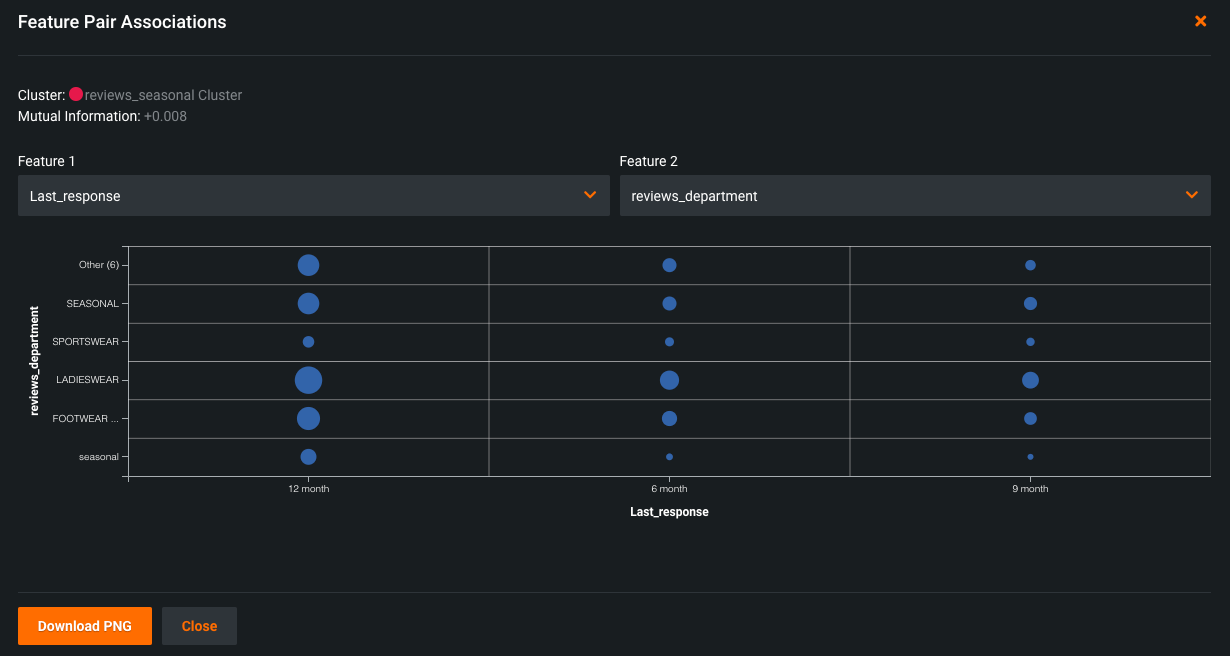
- Contingency tables for categorical vs. categorical features.
The following shows an example of each type, with a brief "reading" of what you can learn from the insight.
Scatter plots
When comparing numeric features against each other, a scatter plot results with the X axis spanning the range of results. The dot size, or overlapping dots, represents the frequency of the value.
For example, in the chart above you might assume there's no discernible dependence of 12m_interest on reviews_seasonal, and as a result, the mutual information they share is very low.
Box and whisker plots
Box and whisker plots graphically display upper and lower quartiles for a group of data. It is useful for helping to determine whether a distribution is skewed and/or whether the dataset contains a problematic number of outliers. Depending on the which feature sets the X or Y axis, the plot may rise vertically or lay horizontally. In either case, the end points represent the upper and lower extremes, with the box illustrating the highest occurrence of a value. DataRobot uses box and whisker plots to create insights for numeric and categorical feature pairs.
In the example above, the plot shows most of the variation of the online_sites feature occurs in the E1 locality. Among the other localities, there is very little dispersion.
Contingency tables
When both features are categorical, DataRobot creates a contingency table which shows a frequency distribution of values for the selected features. The table can contain up to six bins, each representing a unique feature value. For features with more than five unique values, the top five are displayed with the rest accumulated in a bin named Other.
Read the table as follows: The dots are all bigger in the 12 month bucket because there are more total reviews than in the 9 month bucket. Since there is not a lot of variation in the dot sizes across the reviews_department buckets, knowledge about the last_response doesn't improve knowledge about reviews_department. The result is a low metric score.
Control the matrix view
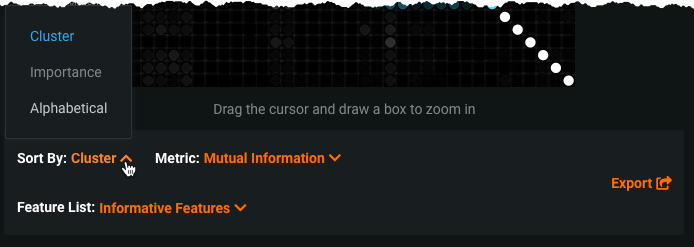
You can modify the matrix view by changing the sort criteria or the metric used to calculate the association. These controls are available below the matrix:
The Sort by option allows you to sort by:
- Cluster (the default).
- Importance to the target (value from the Data page).
- Alphabetically.
The Metric selection determines how DataRobot calculates the association between feature pairs, using either the Mutual Information or Cramer's V correlation algorithms.
The Feature List selection allows you to compute feature association for any of the project's feature lists. If you select a list, the page refreshes and displays the matrix for the selected feature list.
Additionally, if you previously highlighted a section of the matrix for closer observation, click Reset Zoom to return to the full matrix view.
More info...
The following sections include:
- A general discussion about associations.
- Understanding the mutual information and Cramer's V metrics.
- How associations are calculated.
What are associations?
There is a lot of terminology to describe a feature pair's relationship to each other—feature associations, mutual dependence, levels of co-occurrence, and correlations (although technically this is somewhat different) to name the more common examples. The Feature Association tab is a tool to help visualize the association, both through a wide angle lens (the full matrix) and more close up (both matrix zoom and feature association pair details).
Looking at the matrix, each dot tells you, "If I know the value of one of these features, how accurate will my guess be as to the value of the other?" The metric value puts a numeric value on that answer. The closer the metric value is to 0, the more independent the features are of each other. Knowing one doesn't tell you much about the other. A score of 1, on the other hand, says that if you know X, you know Y. Intermediate values indicate a pattern, but aren't completely reliable. The closer they are to "perfect mutual information" or 1, the higher their metric score and the darker their representation on the matrix.
More about metrics
The metric score is responsible for ordering and positioning of clusters and features in the matrix and the detail pane. You can select either the Mutual Information (the default) or Cramer's V metric. These metrics are well-documented on the internet:
- A technical overview of Mutual Information on Wikipedia.
- A longer discussion of Mutual Information on Scholarpedia, with examples.
- A technical overview of Cramer's V on Wikipedia.
- A Cramer's V tutorial of "what and why."
Both metrics measure dependence between features and selection is largely dependent on preference and familiarity. Keep in mind that Cramer's V is more sensitive and, as such, when features depend weakly on each other it reports associations that Mutual Information may not.
How associations are calculated
When calculating associations, DataRobot selects the top 50 numeric and categorical features (or all features if fewer than 50). "Top" is defined as those features with the highest importance score, the value that represents a feature's association with the target. Data from those features is then randomly subsampled to a maximum of 10k rows.
Note the following:
- For associations, DataRobot performs quantile binning of numerical features and does no data imputation. Missing values are grouped as a new bin.
- Outlying values are excluded from correlational analysis.
- For clustering, features below an association threshold of 0.1 are eliminated.
- If all features are relatively independent of each other—no distinct families—DataRobot displays the matrix but all dots are white.
- Features missing over 90% of their values are excluded from calculations.
- High-cardinality categorical features with more than 2000 values are excluded from calculations.
