Metrics
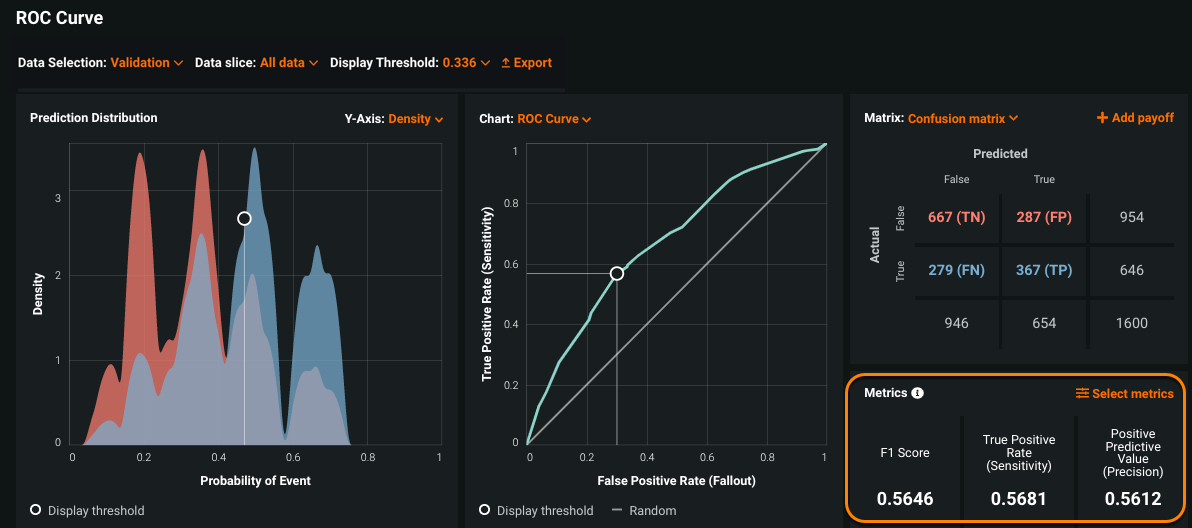
The Metrics pane, on the bottom right of the ROC Curve tab, contains standard statistics that DataRobot provides to help describe model performance at the selected display threshold.
View metrics
-
Select a model on the Leaderboard and navigate to Evaluate > ROC Curve.
-
Select a data source and set the display threshold.
-
View the Metrics pane on the bottom right:
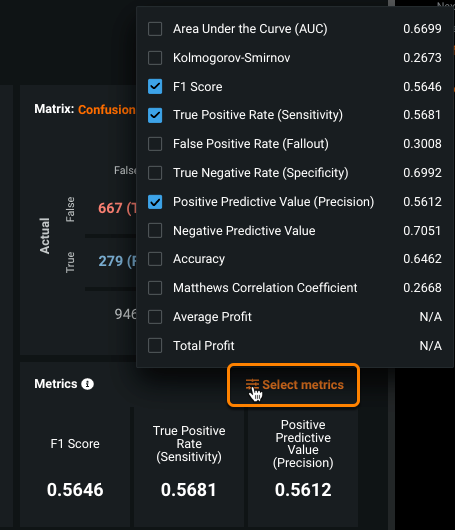
The Metrics pane initially displays the F1 Score, True Positive Rate (Sensitivity), and Positive Prediction Value (Precision). You can set up to six metrics.
-
To view different metrics, click Select metrics and select a new metric.
Note
You can select up to six metrics to display. If you change the selection, new metrics display the next time you access the ROC Curve tab for any model until you change them again.
ROC curve metrics calculations
The metrics values on the ROC curve display might not always match those shown on the Leaderboard. For ROC curve metrics, DataRobot keeps up to 120 of the calculated thresholds that best represent the distribution. Because of this, minute details might be lost. For example, if you select Maximize MCC as the display threshold, DataRobot preserves the top 120 thresholds and calculates the maximum among them. This value is usually very close but may not exactly match the metric value.
Metrics explained
The following table provides a brief description of each statistic, using the detailed classification use case to illustrate.
| Statistic | Description | Sample (from use cases) | Calculation |
|---|---|---|---|
| F1 Score | A measure of the model's accuracy, computed based on precision and recall. | N/A |  |
| True Positive Rate (TPR) | Sensitivity or recall. The ratio of true positives (correctly predicted as positive) to all actual positives. | What percentage of diabetics did the model correctly identify as diabetics? |  |
| False Positive Rate (FPR) | Fallout. The ratio of false positives to all actual negatives. | What percentage of healthy patients did the model incorrectly identify as diabetics? |  |
| True Negative Rate (TNR) | Specificity. The ratio of true negatives (correctly predicted as negative) to all actual negatives. | What percentage of healthy patients did the model correctly predict as healthy? |  |
| Positive Predictive Value (PPV) | Precision. For all the positive predictions, the percentage of cases in which the model was correct. | What percentage of the model’s predicted diabetics are actually diabetic? |  |
| Negative Predictive Value (NPV) | For all the negative predictions, the percentage of cases in which the model was correct. | What percentage of the model’s predicted healthy patients are actually healthy? |  |
| The percentage of correctly classified instances. | What is the overall percentage of the time that the model makes a correct prediction? |  |
|
| Matthews Correlation Coefficient | Measure of model quality when the classes are of very different sizes (unbalanced). | N/A | formula |
| Average Profit | Estimates the business impact of a model. Displays the average profit based on the payoff matrix at the current display threshold. If a payoff matrix is not selected, displays N/A. | What is the business impact of readmitting a patient? | formula |
| Total Profit | Estimates the business impact of a model. Displays the total profit based on the payoff matrix at the current display threshold. If a payoff matrix is not selected, displays N/A. | What is the business impact of readmitting a patient? | formula |

