Bias and Fairness reference
This section defines terminology that is commonly used across the feature.
Protected Feature
The dataset column to measure fairness of model predictions against. That is, a model's fairness is calculated against the protected features from the dataset. Also known as "protected attribute."
Examples: age_group, gender, race, religion
Only categorical features can be marked as protected features. Each categorical value of the protected feature is referred to as a protected class or class of the feature.
Protected Class
One categorical value of the protected feature.
Examples: male can be a protected class (or simply a class) of the feature gender;
asian can be a protected class of the feature race.
Favorable Outcome
A value of the target that is treated as the favorable outcome for the model. Predictions from a binary classification model can be categorized as being a favorable outcome (i.e., good/preferable) or an unfavorable outcome (i.e., bad/undesirable) for the protected class.
Example: To check gender discrimination for loan approvals, the target is_bad indicates whether the loan will default or not.
In this case, the favorable outcome for the prediction is No (meaning the loan "is good") and therefore the value of No is the favorable (i.e., good) outcome for the loaner.
Favorable target outcome is not always the same as the assigned positive class. For example, a common lending use case involves predicting whether or not an applicant will default on their loan. The positive class could be 1 (or "will default"), whereas the favorable target outcome would be 0 (or "will not default"). The favorable target outcome refers to the outcome that the protected individual would prefer to receive.
Fairness Score
A numerical computation of model fairness against the protected class, based on the underlying fairness metric.
Note: A model's fairness scores cannot be compared if the model uses different fairness metrics or if the fairness scores were calculated on different prediction data.
Fairness Threshold
The fairness threshold helps measure if a model performs within appropriate fairness bounds for each protected class and does not affect the fairness score or performance of any protected class. If not specified, the threshold defaults to 0.8.
Fairness Value
Fairness scores normalized against the most favorable protected class (i.e., the class with the highest fairness score).
The fairness value will always be in the range [0.0, 1.0], where 1.0 is assigned to the most favorable protected class.
To ensure trust in the calculated fairness value for a given class of the protected feature, the tools determine if there was enough data in the sample to calculate fairness value with a high level of confidence (see Z score).
Z Score
A metric measuring whether a given class of the protected feature is "statistically significant" across the population.
Example: To measure fairness against gender in a dataset with 10,000 rows identifying male and only 100 rows identifying female, the feature labels the female class as having insufficient data.
In this case, use a different sample of the dataset to ensure trust of the fairness measures over this sample.
Fairness Metrics
Fairness metrics are statistical measures of parity constraints used to assess fairness.
Each fairness metric result is calculated in two steps:
- Calculating fairness scores for each protected class of the model's protected feature.
- Normalizing fairness scores against the highest fairness score for the protected feature.
Metrics that measure Fairness by Error evaluate whether the model's error rate is equivalent across each protected class. These metrics are best suited when you don't have control over the outcome or wish to conform to the ground truth, and simply want a model to be equally right between each protected group.
Metrics that measure Fairness by Representation evaluate whether the model's predictions are equivalent across each protected class. These metrics are best suited when you have control over the target outcome or are willing to depart from ground truth in order for a model's predictions to exhibit more equal representation between protected groups, regardless of the target distribution in the training data.
To help understand the ideal context/use case for applying a given fairness metric, this section covers hypothetical examples for each fairness metric. The examples are based on an HR hiring use case, where the fairness metrics evaluate a model that predicts the target Hired (Yes or No).
Disclaimer: The hypothetical examples do not reflect the views of DataRobot; they are meant solely for illustrative purposes.
Notation
d: decision of the model (i.e.,YesorNo)PF: protected features: predicted probability scoresY: target variable
There are eight individual fairness metrics in total. Certain metrics are best used when paired with a related fairness metric. When applicable, these are noted in the descriptions below.
Proportional Parity
For each protected class, what is the probability of receiving favorable predictions from the model? This metric is based on equal representation of the model's target across protected classes. Also known as "statistical parity," "demographic parity," and "acceptance rate," it is used to score fairness for binary classification models. A common usage for Proportional Parity is the "four-fifths" (i.e. 4/5ths) rule in the Uniform Guidelines on Employee Selection Procedures in context of HR hiring.
Required data:
- Protected feature (i.e.,
genderwith valuesmaleorfemale) - Target with predicted decisions (i.e.,
Hiredwith valuesYesorNo)
Formula:

Example:
A company has a pool of 100 applicants, where:
70applicants are male30applicants are female60males are predicted to be hired and5females are predicted to be hired
Calculate the probability of being hired ("hire rate for each protected class"). The following are the manually calculated fairness scores:
male hiring rate = (number of males hired) / (number of males) = 60/70 = 0.857 = 85.7%
female hiring rate = (number of females hired) / (number of females) = 5/30 = 0.167 = 16.7%
Calculate the disparate impact (the fairness value) for females as follows:
disparate impact = (female hiring rate) / (male hiring rate) = 0.167/0.857 = 0.195 = 19.5%
Compare this relative fairness score (19.5%) against a fairness threshold of 0.8 (i.e., 4/5 = 0.8 = 80%).
The result (19.5% < 80%) indicates that the model does not satisfy the four-fifths rule and is therefore unfairly treating the females in hiring.
Example use case:
According to the 4/5ths Rule in the US for regulating Human Resources, if you're selecting candidates for a job, the selection rate must be equal between protected classes (i.e. proportional parity) within a threshold of 0.8. If you interview 80% of men and only 40% of women, that violates this law. To rectify this bias, you would need to interview at least 64% of women (the 80% selection rate for men * 0.8 fairness threshold).
Equal Parity
For each protected class, what is the total number of records with favorable predictions from the model? This metric is based on equal representation of the model's target across protected classes. It is used for scoring fairness for binary classification models.
Required data:
- Protected feature (i.e.,
genderwith valuesmaleorfemale) - Target with predicted decisions (i.e.,
Hiredwith valuesYesorNo)
Formula:
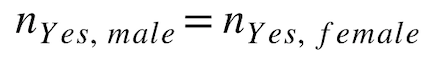
Example:
Using the previous example, the fairness scores for male and female predicted hirings are:
males hired = 60
females hired = 5
Example use case:
In Europe, some countries require equal numbers of men and women on corporate boards.
Prediction Balance
The set of Prediction Balance fairness metrics include favorable and unfavorable class balance, described below.
Favorable Class Balance
For all actuals that were favorable outcomes, what is the average predicted probability for each protected class? This metric is based on equal representation of the model's average raw scores across each protected class and is part of the set of Prediction Balance fairness metrics. A common usage for Favorable Class Balance is ranking hiring candidates by the model's raw scores to select higher-scoring candidates.
Required data:
- Protected feature (i.e.,
genderwith valuesmaleorfemale) - Target with predicted probability scores (i.e.,
Hiredwith values in the range[0.0, 1.0]) - Target with actual outcomes (i.e.,
Hired_actualwith valuesYesorNo)
Formula:

Example:
A company has a pool of 100 applicants, where:
70applicants are male30applicants are female50males were actually hired and20females were actually hired- Range of predicted probability scores for males:
[0.7, 0.9] - Range of predicted probability scores for females:
[0.2, 0.4]
Calculate the average for each protected class, based on a model's predicted probability scores, as follows:
hired males average score = sum(hired male predicted probability scores) / 50 = 0.838
hired females average score = sum(hired female predicted probability scores) / 20  = 0.35
Example use case:
In a hiring context, you can rank candidates by probability of passing hiring manager review and use the model's raw scores to filter out lower-scoring candidates, even if the model predicts that they should be hired.
Unfavorable Class Balance
For all actuals that were unfavorable outcomes, what is the average predicted probability for each protected class? This metric is based on equal representation of the model's average raw scores across each protected class and is part of the set of Prediction Balance fairness metrics. A common usage for Unfavorable Class Balance is ranking hiring candidates by the model's raw scores to filter out lower-scoring candidates.
Required data:
- Protected feature (i.e.,
genderwith valuesmaleorfemale) - Target with predicted probability scores (i.e.,
Hiredwith values in the range[0.0, 1.0]) - Target with actual outcomes (i.e.,
Hired_actualwith valuesYesorNo)
Formula:

Example:
A company has a pool of 100 applicants, where:
70applicants are male30applicants are female20males were actually not hired and10females were actually not hired- Range of predicted probability scores for males:
[0.7, 0.9] - Range of predicted probability scores for females:
[0.2, 0.4]
Calculate the average for each protected class, based on a model's predicted probability scores, as follows:
non-hired males average score = sum(non-hired male predicted probability scores) / 20 = 0.70
non-hired females average score = sum(non-hired female predicted probability scores) / 10 = 0.20
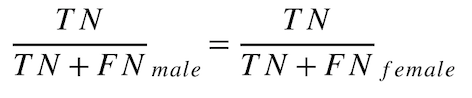
True Favorable Rate Parity
For each protected class, what is the probability of the model predicting the favorable outcome for all actuals of the favorable outcome? This metric (also known as "True Positive Rate Parity") is based on equal error and is part of the set of True Favorable Rate & True Unfavorable Rate Parity fairness metrics.
Required data:
- Protected feature (i.e.,
genderwith valuesmaleorfemale) - Target with predicted decisions (i.e.,
Hiredwith valuesYesorNo) - Target with actual outcomes (i.e.,
Hired_actualwith valuesYesorNo)
Formula:

Example:
A company has a pool of 100 applicants, where:
70applicants are male30applicants are female50males were correctly predicted to be hired10males were incorrectly predicted to be not hired8females were correctly predicted to be hired12females were incorrectly predicted to be not hired
Calculate the True Favorable Rate for each protected class as follows:
male favorable rate = TP / (TP + FN) = 50 / (50 + 10) = 0.8333
female favorable rate = TP / (TP + FN) = 8 / (8 + 12) = 0.4
Example use case:
In healthcare, a model can be used to predict which medication a patient should receive. You would not want to give any protected class the wrong medication in order to ensure that everyone gets the same medication– instead, you want your model to give each protected class the right medication, and you don't want it to make significantly more errors on any group.
True Unfavorable Rate Parity
For each protected class, what is the probability of the model predicting the unfavorable outcome for all actuals of the unfavorable outcome?
This metric (also known as "True Negative Rate Parity") is based on equal error and is part of the set of True Favorable Rate & True Unfavorable Rate Parity fairness metrics.
Required data:
- Protected feature (i.e.,
genderwith valuesmaleorfemale) - Target with predicted decisions (i.e.,
Hiredwith valuesYesorNo) - Target with actual outcomes (i.e.,
Hired_actualwith valuesYesorNo)
Formula:
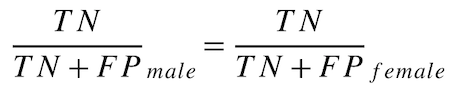
Example:
A company has a pool of 100 applicants, where:
70applicants are male30applicants are female5males were correctly predicted to be not hired5males were incorrectly predicted to be hired8females were correctly predicted to be not hired2females were incorrectly predicted to be hired
Calculate the True Unfavorable Rate for each protected class as follows:
male unfavorable rate = TN / (TN + FP) = 5 / (5 + 5) = 0.5
female unfavorable rate = TN / (TN + FP) = 8 / (8 + 2) = 0.8
Favorable Predictive Value Parity
What is the probability of the model being correct (i.e., the actual results being favorable)? This metric (also known as "Positive Predictive Value Parity") is based on equal error and is part of the set of Favorable Predictive & Unfavorable Predictive Value Parity fairness metrics.
Required data:
- Protected feature (i.e.,
genderwith valuesmaleorfemale) - Target with predicted decisions (i.e.,
Hiredwith valuesYesorNo) - Target with actual outcomes (i.e.,
Hired_actualwith valuesYesorNo)
Formula:
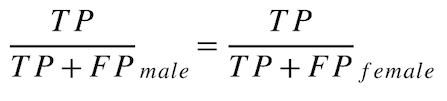
Example:
A company has a pool of 100 applicants, where:
70applicants are male30applicants are female50males were correctly predicted to be hired5males were incorrectly predicted to be hired8females were correctly predicted to be hired2females were incorrectly predicted to be hired
Calculate the Favorable Predictive Value Parity for each protected class as follows:
male favorable predictive value = TP / (TP + FP) = 50 / (50 + 5) = 0.9091
female favorable predictive value = TP / (TP + FP) = 8 / (8 + 2) = 0.8
Example use case:
Insurance companies consider it ethical to charge men more than women, as men are considered significantly more reckless drivers than women. In this case, you would want the model to charge men the correct amount relative to their actual risk, even if the amount is different for women.
Unfavorable Predictive Value Parity
What is the probability of the model being correct (i.e., the actual results being unfavorable)?
This metric (also known as "Negative Predictive Value Parity") is based on equal error and is part of the set of Favorable Predictive & Unfavorable Predictive Value Parity fairness metrics.
Required data:
- Protected feature (i.e.,
genderwith valuesmaleorfemale) - Target with predicted decisions (i.e.,
Hiredwith valuesYesorNo) - Target with actual outcomes (i.e.,
Hired_actualwith valuesYesorNo)
Formula:
Example:
A company has a pool of 100 applicants, where:
70applicants are male30applicants are female5males were correctly predicted to be not hired10males were incorrectly predicted to be not hired8females were correctly predicted to be not hired12females were incorrectly predicted to be not hired
Calculate the Unfavorable Predictive Value Parity for each protected class as follows:
male unfavorable predictive value = TN / (TN + FN) = 5 / (5 + 10) = 0.333
female unfavorable predictive value = TN / (TN + FN) = 8 / (8 + 12) = 0.4