View prediction results
The prediction results page displays prediction information and insights based on the values entered for an individual prediction. This page automatically opens after making a single record prediction, but you can also view prediction results by selecting a row in the All rows widget.
The General Information widget displays helpful values for features that don't necessarily impact the prediction results. The Prediction Information widget, on the other hand, displays the values for features likely to impact the prediction, as well as Prediction Explanations.
Add or remove fields
To add or remove feature fields, see the documentation on managing widget features.
Prediction Explanations
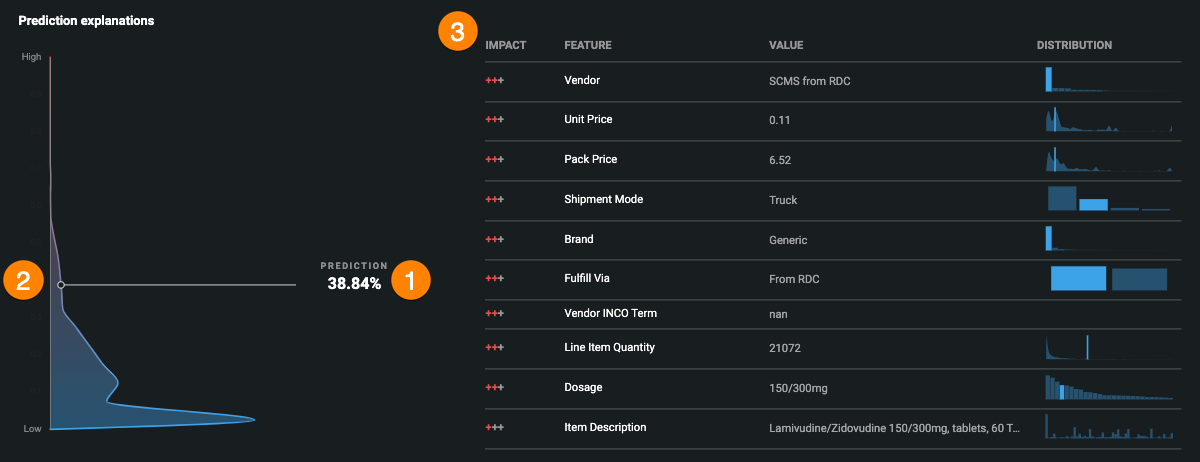
The Prediction Explanations widget displays a chart with your predictions results, as well as a table with Prediction Explanations (either XEMP-based or, as shown in the example below, SHAP-based)—a measure of how features in the model impact a prediction based on their relationship to the target.
| Element | |
|---|---|
| 1 | The predicted value for the row. |
| 2 | The basis of the prediction classification, determined by the dataset the app deployed from. |
| 3 | A table displaying the top 10 Prediction Explanations as well as a visualization representing how the feature is distributed in the training data. |
Note
You must compute Prediction Explanations for the model before making a prediction.
Prediction Explanation table
The Prediction Explanation table displays the top 10 features with the largest impact on a prediction based on their relationship in the training data.
See the table below for a description of each field:
| Field | Description |
|---|---|
| Impact | The measured impact of a given feature on the prediction. For a description of the icons used, see the "qualitativeStrength" indicator description. |
| Feature | The feature in the training data impacting the prediction. |
| Value | The feature value causing the feature's measured impact on the prediction. |
| Distribution | A histogram that represents the distribution of a given feature in the training data. Hover over the visualization for additional information that can then be used to add context to the Prediction Explanation. |
What-if and Optimizer
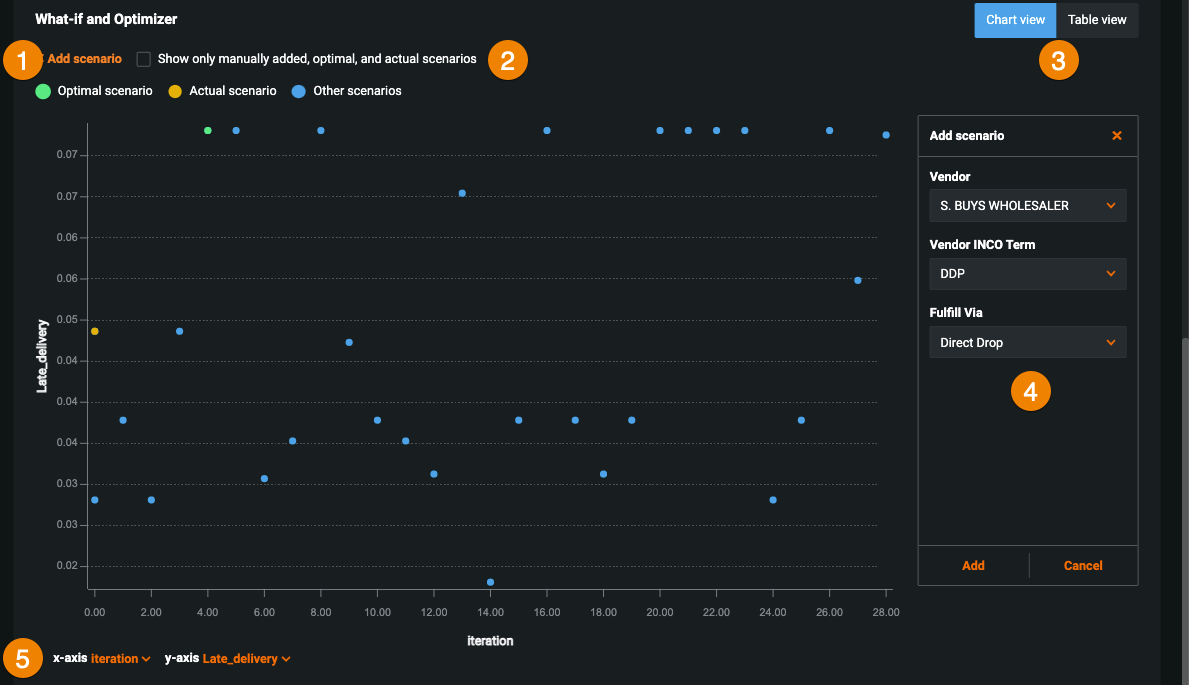
The What-if and Optimizer widget displays various scenarios in a chart or a table view. To learn how to configure this widget, see the documentation on building applications
The table below describes the components of the What-if and Optimizer widget
| Description | |
|---|---|
| 1 | Opens the Add scenario pane. |
| 2 | Filters the display to show only actual, optimal, and all manually added scenarios. |
| 3 | Displays prediction insights in chart or table view. |
| 4 | Adds new scenarios to the widget. |
| 5 | Selects features for the x- and y-axis. |
Tip
Check Show only manually added, optimal, and actual scenarios to more easily find your simulations.
Create simulations
If the What-if functionality is enabled, you can manually add scenarios to the widget's display.
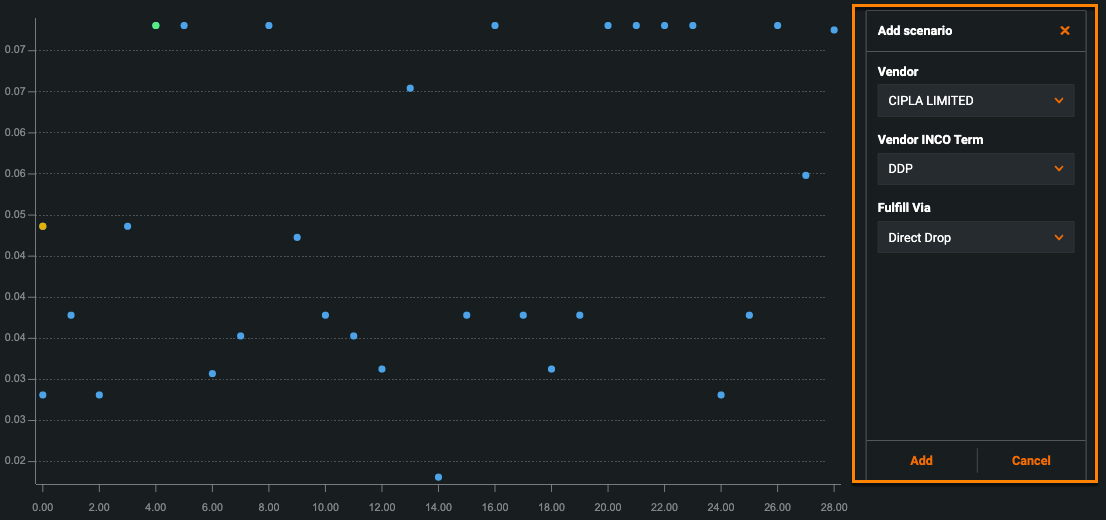
To create a simulation, click Add scenario.
Provide values for each variable selected on the Build page. When you have entered values for each feature, click Add. This triggers a prediction request to a DataRobot prediction server and returns a predicted value for your target feature.
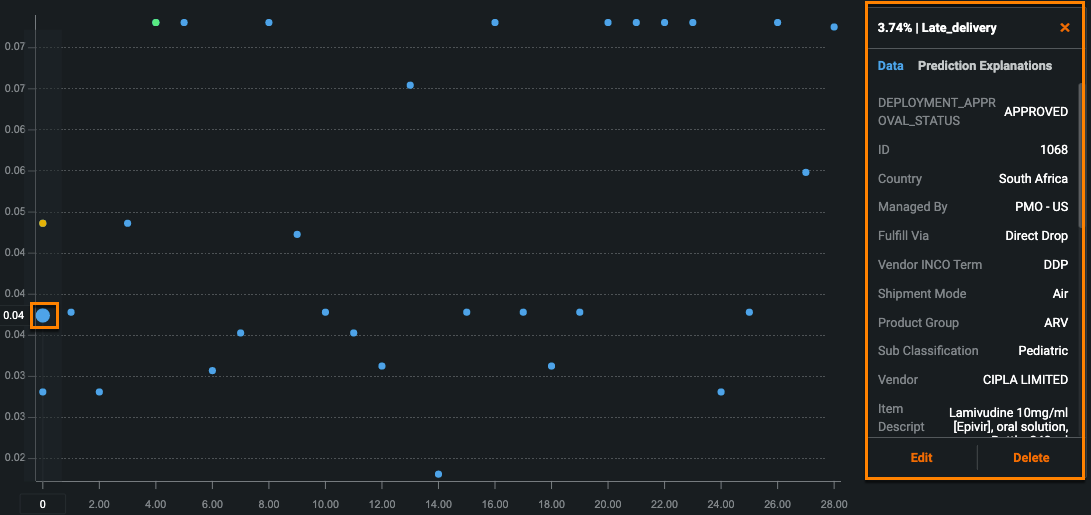
Selecting a point on the chart (data point) opens a pane on the right that displays prediction results and feature values for the selected scenario. If Prediction Explanations are available for your prediction request, they appear in the Prediction Explanations tab in the same pane.
You can continue to make predictions by updating the variable inputs with new values and repeating this process. After making several predictions, click Table view. This view allows you to drag-and-drop scenarios for side-by-side comparison.
Optimization simulation results
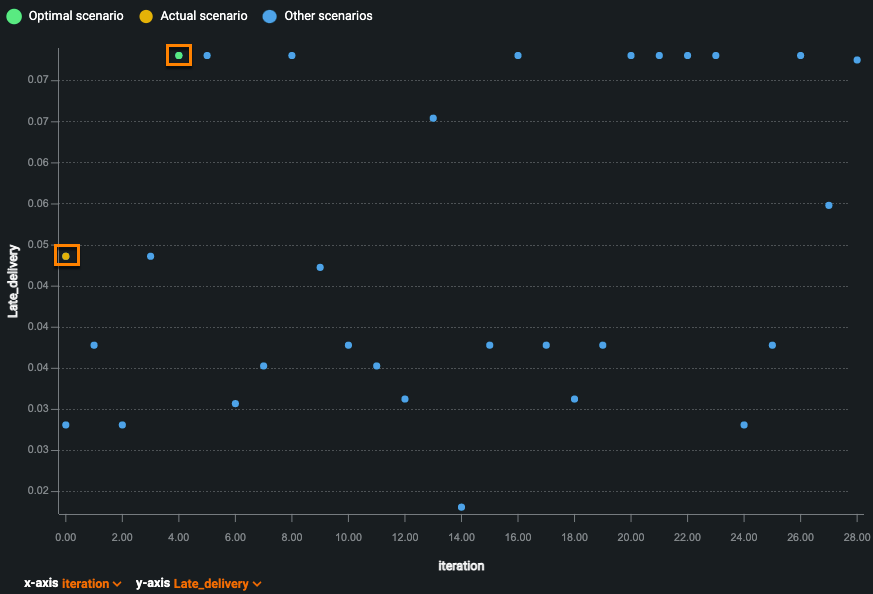
If the Optimizer functionality is enabled, the chart displays an optimal scenario, as well as different outcomes based on the flexible features added to the widget's configuration.
Once DataRobot completes running simulations, the chart populates the results. The y-axis measures the values of the target feature, and the x-axis indicates the simulation iteration. Each point on the graph represents the predicted value for each simulation run.
The orange data point represents your prediction and the green data point represents the optimal scenario—the values of the feature that most often produce the optimal result for your target (the minimal or maximal, based on your settings). The selected values are those you selected for a given iteration, allowing you to compare the selected values for each iteration to the overall most optimal values determined by the app.

