Advanced Tuning
Advanced Tuning allows you to manually set model parameters, overriding the DataRobot selections for a model, and create a named “tune.” In some cases, by experimenting with parameter settings you can improve model performance. When you create models with Advanced Tuning, DataRobot generates new, additional Leaderboard models that you can later blend together or further tune. To compute scores for tuned models, DataRobot uses an internal "grid search" partition inside of the training dataset. Typically the partition is a 80/20 training/validation split, although in some cases DataRobot applies five-fold cross-validation.
Note
See also architecture, augmentation, and tuning options specific to Visual AI projects.
You cannot use Advanced Tuning with blended models. Also, baseline models do not offer any tunable parameters.
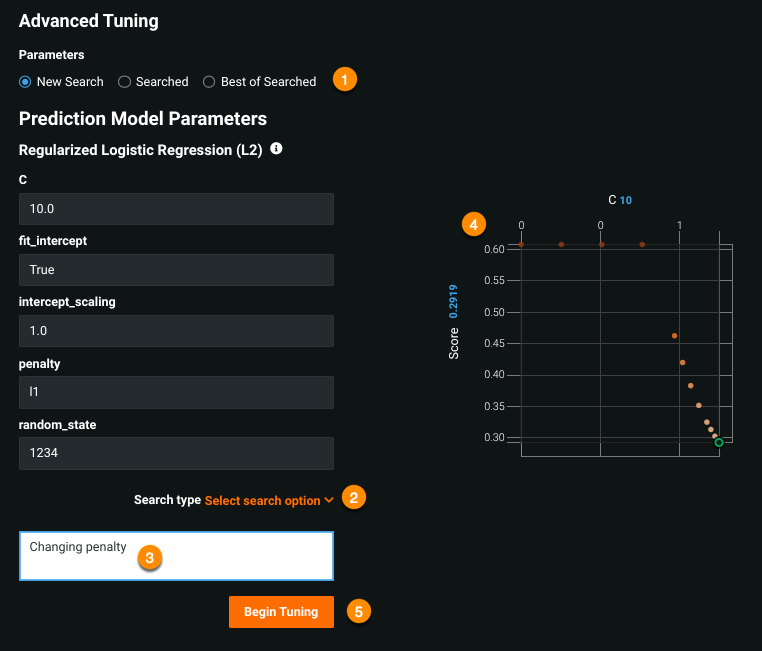
To display the advanced parameter settings, expand a model on the Leaderboard list and click Evaluate > Advanced Tuning. A window opens displaying parameter settings on the left and a graph on the right.
The following table describes the fields of the Advanced Tuning page:
| Element | Description |
|---|---|
| Parameters (1) | Displays either all parameters searched or the single best value of all searched values for preprocessing or final prediction model parameters. Refer to the acceptable values guidance to set a value for your next search. Click the documentation link in the upper right corner to access the documentation specific to the model type. See the Eureqa Advanced Tuning Guide for information about Eureqa model tuning parameters. |
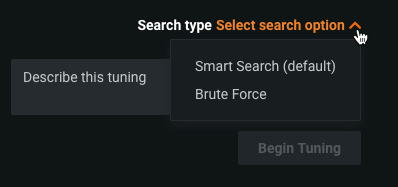
| Search type (2) | Defines the search type, either Smart Search or Brute Force. The types set the level of search detail, which in turn affects resource usage. |
| Naming (3) | Appends descriptive text to the tune. |
| Graph (4) | Plots parameters against score. |
| Begin tuning (5) | Launches a new tuning session, using the parameters displayed in the New Search parameter list. |
See below for information on exploring Advanced Tuning, including definitions of, and settings for, display options.
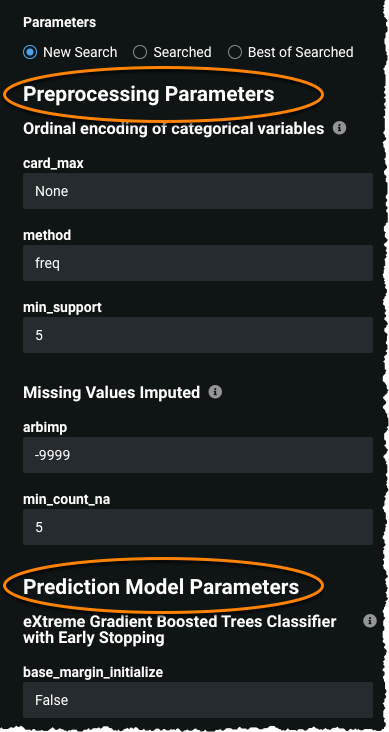
DataRobot allows you to tune parameters not only for the final model used for prediction but for preprocessing tasks as well.
With Advanced Tuning, you can set values for a large number of preprocessing tasks, with availability dependent on the model and project type. When you tune a parameters, DataRobot adds that information below the model description on the Leaderboard.
Use Advanced Tuning
Once you understand how to set options, you can create a tune. Advanced Tuning consists of the three steps:
Avoid memory errors
The following situations can cause memory errors:
-
Setting any Advanced Tuning parameter that accepts multiple values such that it results in a grid search that exceeds 25 grid points. Be aware that the search is multiplicative not additive (for example,
max_depth=1,2,3,4,5withlearning_rate=.1,.2,.3,.4,.5results in 25 grid points, not 10). -
Increasing the range of hyperparameters searched so that they result in larger model sizes (for example, by increasing the number of estimators or tree depth in an XGBoost model).
Set a parameter
To change one of the parameter values:
-
Click the down arrow next to the parameter name:
-
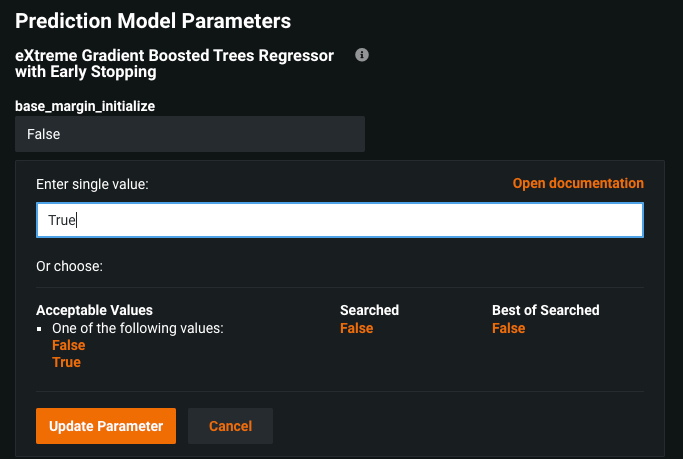
Enter a new value in the Enter value field in one of the following ways:
- Select one of the pre-populated values (clicking any value listed in orange enters it into the value field.)
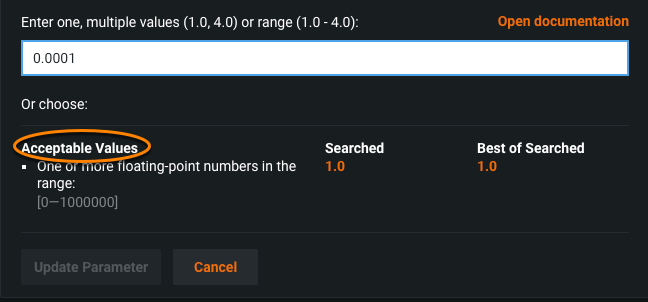
- Type a value into the field. Refer to the Acceptable Values field, which lists either constraints for numeric inputs or predefined allowed values for categorical inputs (“selects”). To enter a specific numeric, type a value or range meeting the criteria of Acceptable Values:
Note
Categorical values inside of parameters that also accept other types (“multis”), as well as preprocessing parameters, are not tunable. For models created prior to the introduction of this feature, additional instances of selects may not be tunable.
In the screenshot above you can enter various values between 0.00001 and 1, for example:
0.2to select an individual value.0.2, 0.4, 0.6to list values that fall within the range; use commas to separate a list.0.2-0.6to specify the range and let DataRobot select intervals between the high and low values; use hyphen notation to specify a range.
For floating-point parameters that accept multiple values, when you enter a range (e.g.,
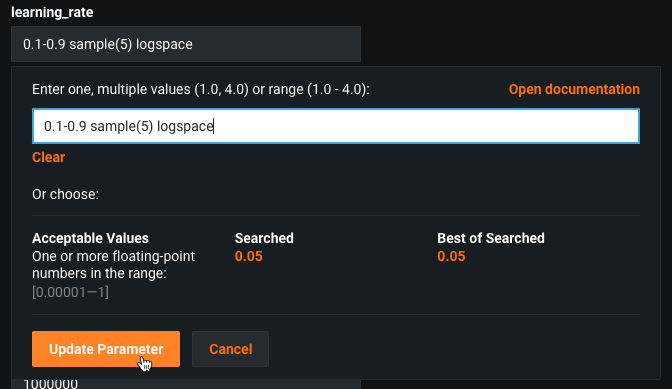
0.5-1.0), DataRobot samples 10 points linearly from that range by default. However, you can customize the sampling. For example, use0.1-0.9 sample(5) logspaceto sample 5 values in log space rather than in linear space.
Set the search type
Click on the Advanced link to set your search type to either:
-
Smart Search (default) performs a sophisticated pattern search (optimization) that emphasizes areas where the model is likely to do well and skips hyperparameter points that are less relevant to the model.
-
Brute Force evaluates each data point, which can be more time and resource intensive.
There are situations, however, in which Brute Force will outperform Smart Search. This is because Smart Search is heuristic-based—meaning it's about saving time not increasing accuracy (it doesn’t search the whole grid).
Deep dive: Smart Search heuristics
The following describes how DataRobot performs Smart Search:
- Use a start value if specified. Otherwise, initialize the first grid pass to be the cross-product of the 25th and 75th percentile among each parameter's grid points and score.
- Find the best-performing grid points among those that were searched.
- From the unsearched grid points, find the neighbor grid points of the best-performing searched grid point and score for those points.
- Add those values to the "searched" list and repeat from Step 2.
- If no neighbors are found, search all adjacent neighbors (
edges). If neighbors are found, repeat from Step 2. - If still no neighbors are found, reduce the search radius for neighbors. If neighbors are found, repeat from Step 2.
- Repeat Steps 2-5 until there are no new neighbors to search or the maximum number of iterations (
max_iter) is reached.
Run the tune
To run your tune:
-
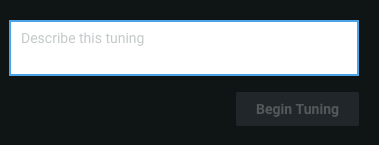
(Optional) Use Describe this tuning to append text (for example, a name and comment) to the tune. DataRobot displays your comments on the Leaderboard when the model has finished, in small text underneath the model title.
-
Click Begin Tuning.
When you click Begin Tuning, a new model, with your selected parameters, begins to build. DataRobot displays progress in the right-side worker usage pane and adds the new model to the Leaderboard. The Leaderboard entry is only partially complete, however, until the model finishes running. The listing displays a TUNED badge to the right of the model name and any descriptive text from the Describe this tuning box in the line beneath the title:
Interpret the graph
The graph(s) displayed by the Advanced Tuning feature map an individual parameter to a score and also provide parameter-to-parameter graphs for analyzing pairs of parameter values run together. The number and detail of the graphs vary based on model type.
More info...
The sections below describe the parameters section in more detail and also explain the Advanced Tuning graph.
Explore Advanced Tuning
The Parameters area provides three tabs—two different ways to view the parameters for the existing model and a third tab for launching a new model. Parameters are model-dependent but sample-size independent. Display options are:
-
Searched: lists the parameter values used to run the current model, create the displayed graphs, and obtain the validation score shown on the Leaderboard.
-
Best of Searched: displays the single value for each parameter values that resulted in the optimal validation score.
-
New Search: provides, for each parameter, an editable field where you can modify the parameter value used for the next search. You launch the tune from this tab.
Tip
Regardless of the section you are in, when you click the down arrow to modify parameters you are taken to the New Search.
Once you open the Advanced Tuning page, DataRobot displays the model’s parameters on the left (listed parameters are model-specific). Click on Searched and Best of Searched to display the parameter information DataRobot makes available.
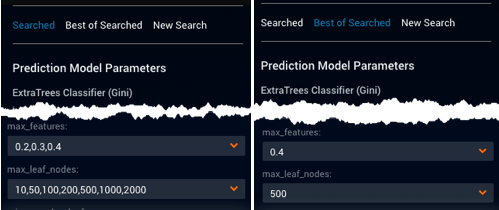
In the example below, you can see that the values displayed for the parameters max_features and max_leaf_nodes differ.
Search lists all the values searched; Best of Searched lists only the value that yielded the best model results—in this case, 0.4 for max_features and 500 for max_leaf_nodes.
Click on New Search to display the parameter values that will be used for the next tune. The values that populate New Search are, by default, the same as those in B. DataRobot displays any changes from the Best of Searched parameter values in blue on the New Search screen.
Advanced Tuning graph details
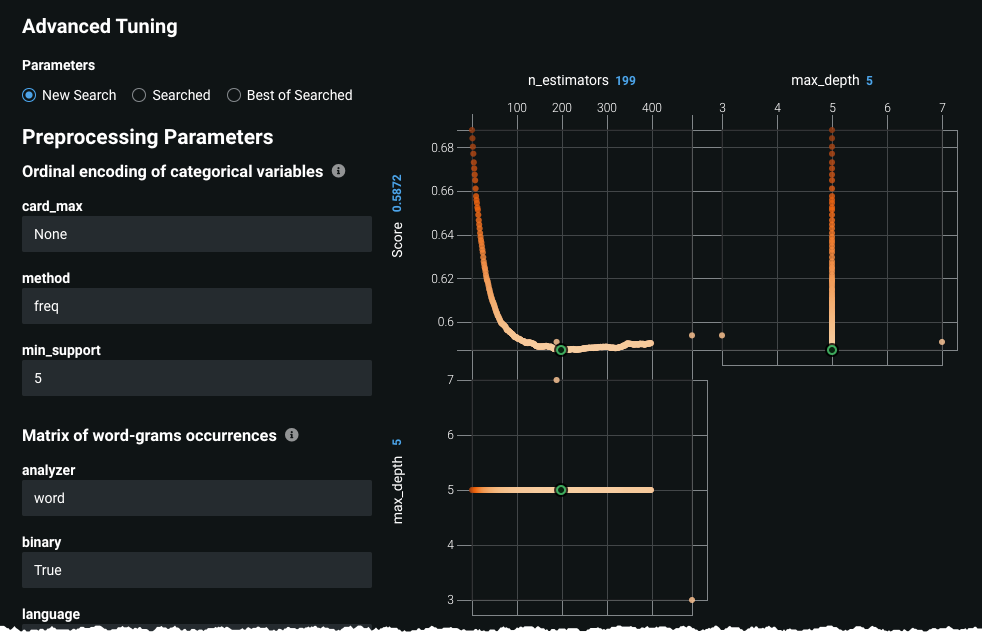
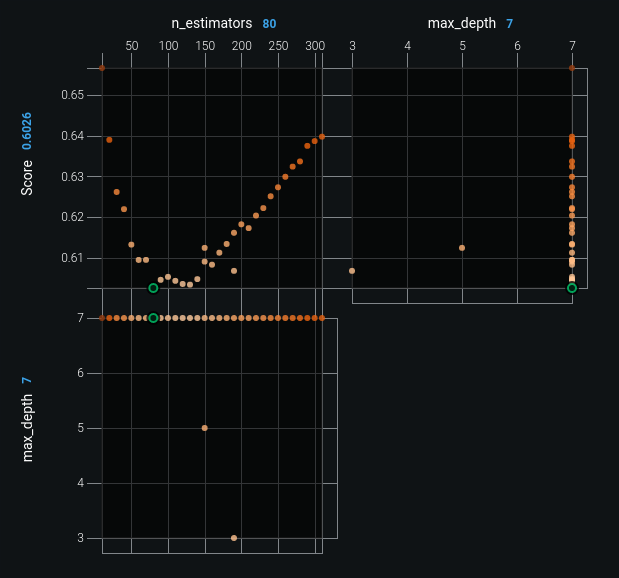
The following shows a sample Advanced Tuning graph:
DataRobot graphs those parameters that take a numeric or decimal value and displays them against a score. In the example above, the top two graphs each plot one of the parameters used to build the current model. The points on the graph indicate each value DataRobot tried for that parameter. The largest dot is the value selected, and dots are represented in a “warmer to colder” color scheme.
The third graph, in the bottom left, is a parameter-to-parameter graph that illustrates an analysis of co-occurrence. It plots the parameter values against each other. In the sample graph above, the comparison graph shows gamma on the Y axis and C on the X axis. The large dot in the comparison graph is the point of best score for the combination of those parameters.
This final parameter-to-parameter graph can be helpful in experimenting with parameter selection because it provides a visual indicator of the values that DataRobot tried. So, for example, to try something completely different, you can look for empty regions in the graph and set parameter values to match an area in the empty region. Or, if you want to try tweaking something that you know did well, you can identify values in the region near to the large dot that represents the best value.
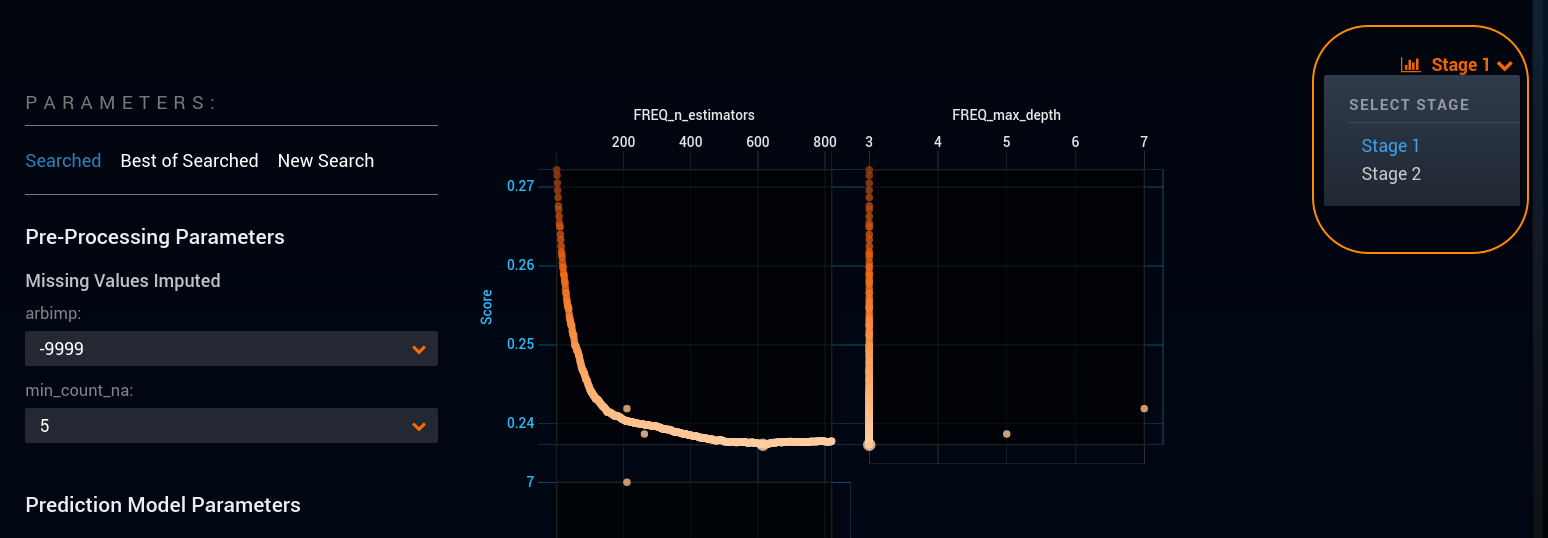
If the main model uses a two-stage modeling process (Frequency-Severity eXtreme Gradient Boosted Trees, for example), you can use the dropdown to select a stage. DataRobot then graphs parameters corresponding to the selected stage.
