Quantile regression analysis
Availability information
Quantile regression analysis is off by default. Contact your DataRobot representative or administrator for information on enabling the feature.
Feature flag: Enable Quantile Metric
For some projects, predicting the tendency (average or median, for example) of the target variable is not the prime concern. Some projects are more interested in predicting a conditional value (a quantile), such as an insurer that wants to be 95% confident that the loss will not exceed a specific amount.
Note
You must enable the Quantile Metric feature flag before dataset ingestion to the AI Catalog. That is, you cannot use a dataset that was loaded into the AI Catalog prior to enabling the flag.
To set the metric and quantile level:
-
Start a regression project. When EDA1 completes, click Show Advanced options and select Additional.
-
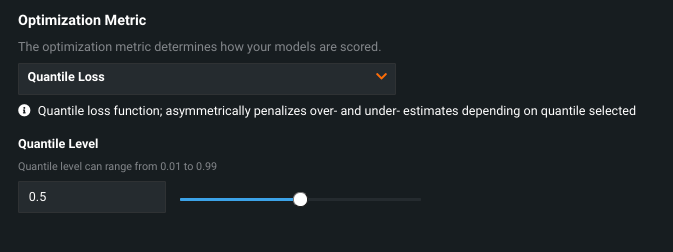
From the Optimization Metric dropdown select the Quantile Loss (or Weighted Quantile Loss) metric.
-
Set the value for the quantile level, in the range of 0.01 to 0.99 (acceptable values must be to the tenth or hundredths place only).
-
Select a modeling mode and click Start. Quantile-specific models available to Autopilot or from the Repository include:
- Quantile Regression
- Statsmodel Quantile Regression
- Keras
- Gradient Boosted Trees
DataRobot returns a message if it determines there is not enough data to provide a meaningful value. If this happens, consider adding more data or lowering the quantile level. If the available data is limited but DataRobot can continue training, you'll see a Quantile Target Sparcity report in the data quality assessment. Too little data can result in unreliable results.
-
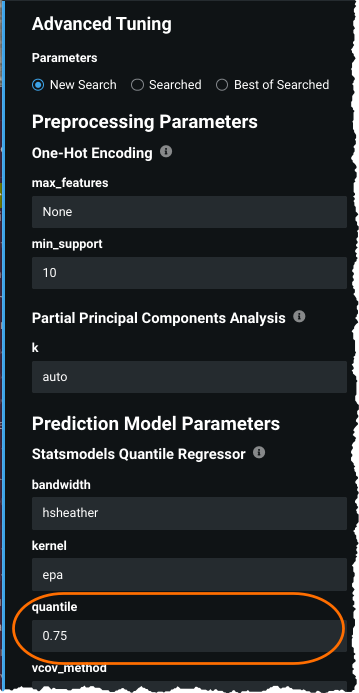
When building completes, you can see the value quantile parameter
quantilevalue that was used to build the model in Advanced Tuning. To experiment with different values, set thequantileparameter and press Begin Tuning. Note that when you tune the quantile this way, it applies only to this model and does not impact the optimization level set for the entire project.
Note
When using quantile loss, some insights may look unusual or need to be interpreted differently. For example, Lift Chart and Residuals should not be interpreted in the same way as they would be in a standard regression project.
Quantile regression metric
The following describes the Quantile Loss metric.
| Display | Full name | Description | Project type |
|---|---|---|---|
| Quantile Loss | Quantile Loss | The quantile loss, sometimes called “pinball loss”, asymmetrically penalizes over- and under-estimates depending on the quantile level selected. | Regression (non-time series) |
The Quantile Loss, sometimes called "pinball loss," is a metric that can be used to compare performance of quantile-optimized regression models. For example, with y as the true outcome and ŷ the prediction, the quantile loss function for a single observation is defined as follows:
Where q is a user-provided value between 0.01 and 0.99, indicating the quantile level at which the loss function is optimized. When the Quantile Loss metric is selected, a slider becomes available that allows you to select the quantile level (q) at which you would like to evaluate loss for the project.
This means that:
- when
q=0.5, the quantile loss is identical to Mean Absolute Error, which optimizes to the median. - when
q > 0.5, the algorithm is effectively preferring an overestimate to an underestimate: the loss will be steeper for predictions that undershoot. - when
q < 0.5, the reverse is true—the algorithm overpenalizes estimates that miss high relative to those that miss low.


