Feature Effects
Feature Effects shows the effect of changes in the value of each feature on the model’s predictions. It displays a graph depicting how a model "understands" the relationship between each feature and the target, with the features sorted by Feature Impact. The insight is communicated in terms of partial dependence, which illustrates how a change in a feature's value, while keeping all other features as they were, impacts a model's predictions. Literally, "what is the feature's effect, how is this model using this feature?" To compare the model evaluation methods side by side:
- Feature Impact conveys the relative impact of each feature on a specific model.
- Feature Effects (with partial dependence) conveys how changes to the value of each feature change model predictions.
Clicking Compute Feature Effects causes DataRobot to first compute Feature Impact (if not already computed for the model) on all data. If you change the data slice for Feature Effects or the quick-compute setting for Feature Impact, Feature Effects will still use the original Feature Impact settings. In other words, DataRobot does not change the basis of (recalculate) Feature Effects visualizations that have already been calculated. If you subsequently change the Feature Impact quick-compute setting, all new calculations will use the new Feature Impact calculations.
See below for more information on how DataRobot calculates values, explanation of tips for using the displays, and how Exposure and Weight change the output.
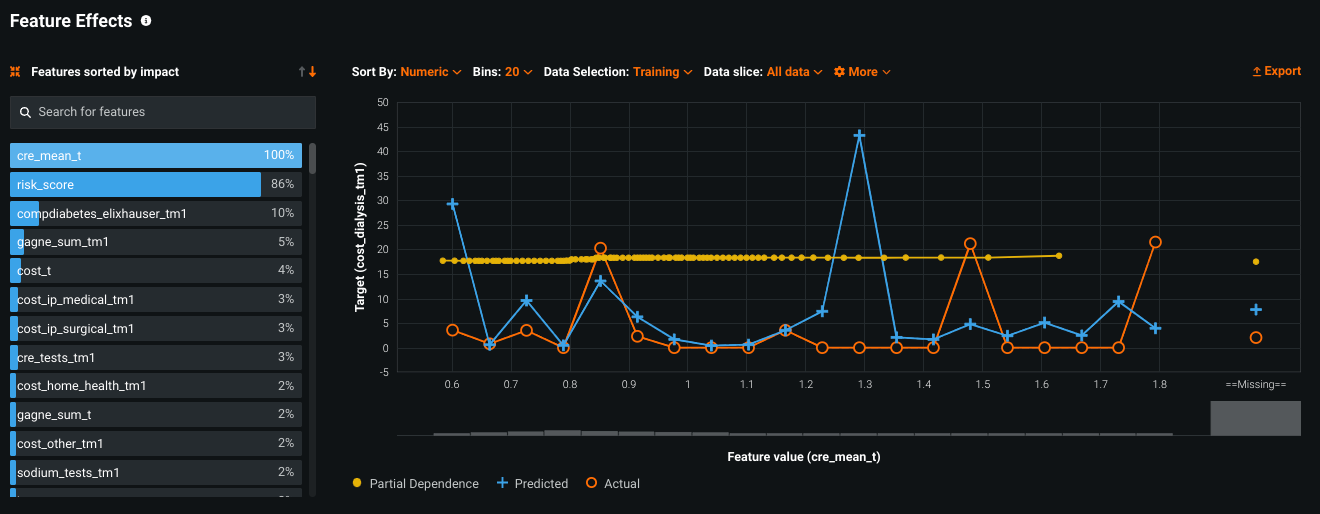
The completed result looks similar to the following, with three main screen components:
Display options
The following table describes the display control options for Feature Effects:
| Element | Description | |
|---|---|---|
| 1 | Sort by | Provides controls for sorting. |
| 2 | Bins | For qualifying feature types, sets the binning resolution for the feature value count display. |
| 3 | Data Selection | Controls which partition fold is used as 1) the basis of the Predicted and Actual values and 2) the sample used for the computation of partial dependence. Options for OTV projects differ slightly. |
| 4 | Data slice | Binary classification and regression only. Selects the filter that defines the subpopulation to display within the insight. |
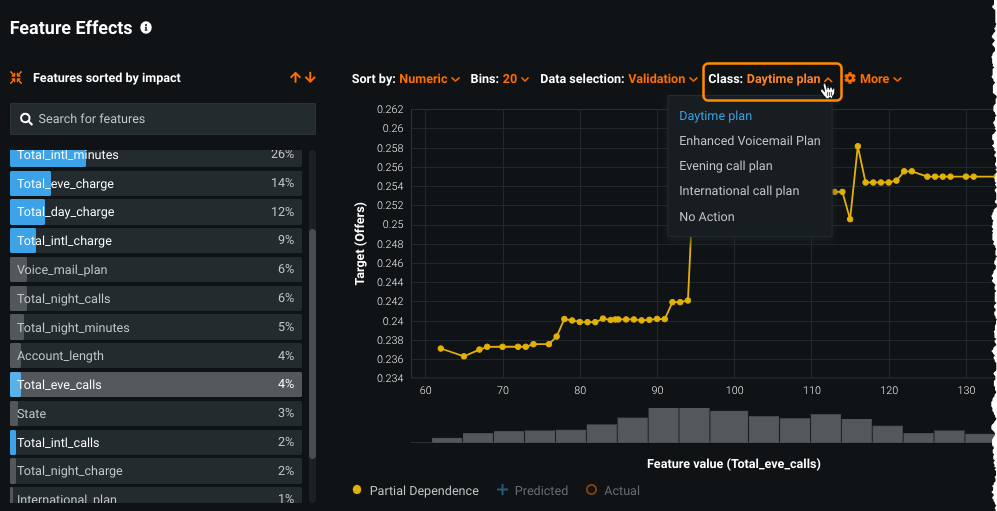
| Not shown | Class | Multiclass only. Provides controls to display graphed results for a particular class within the target feature. |
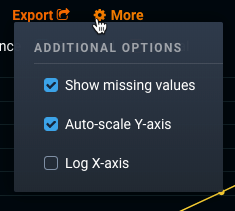
| 5 | More | Controls whether to display missing values and changes the Y-axis scale. |
| 6 | Export | Provides options for downloading data. |
Tip
This visualization supports sliced insights. Slices allow you to define a user-configured subpopulation of a model's data based on feature values, which helps to better understand how the model performs on different segments of data. See the full documentation for more information.
Sort options
The Sort by dropdown provides sorting options for plot data. For categorical features, you can sort alphabetically, by frequency, or by size of the effect (partial dependence). For numeric features, sort is always numeric.
Set the number of bins
The Bins setting allows you to set the binning resolution for the display. This option is only available when the selected feature is a numeric or continuous variable; it is not available for categorical features or numeric features with low unique values. Use the feature value tooltip to view bin statistics.
Select the partition fold
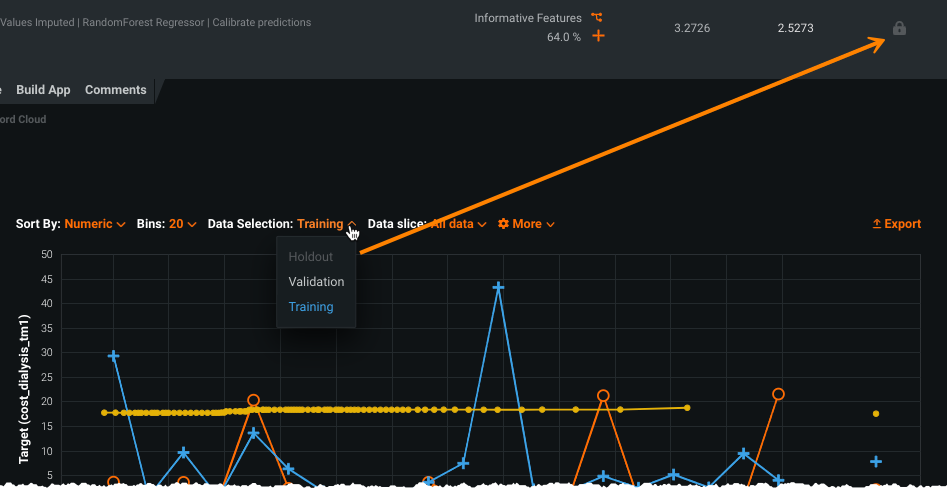
You can set the partition fold used for predicted, actual, and partial dependence value plotting with the Data Selection dropdown—Training, Validation, and, if unlocked, Holdout. While it may not be immediately obvious, there are good reasons to investigate the training dataset results.
When you select a partition fold, that selection applies to all three display controls, whether or not the control is checked. Note, however, that while performed on the same partition fold, the partial dependence calculation uses a different range of the data.
Note that Data Selection options differ depending on whether or not you are investigating a time-aware project:
For non-time-aware projects: In all cases you can select the Training or Validation set; if you have unlocked holdout, you also have an option to select the Holdout partition.
For time-aware projects: For time-aware projects, you can select Training, Validation, and/or Holdout (if available) as well as a specific backtest. See the section on time-aware Data Selection settings for details.
Select the class (multiclass only)
In a multiclass project, you can additionally set the display to chart per-class results for each feature in your dataset.
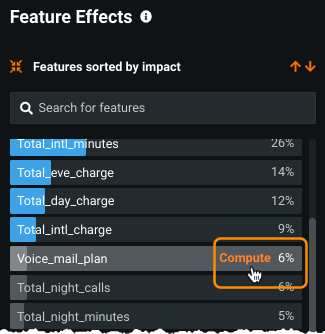
By default, DataRobot calculates effects for the top 10 features. To view per-class results for features ranked lower than 10, click Compute next to the feature name:
Export
The Export option allows you to export the graphs and data associated with the model's details and for individual features. If you choose to export a ZIP file, you will get all of the chart images and the CSV files for partial dependence and predicted vs actual data.
More options
The Feature Effects insight provides tools for re-displaying the chart to help you focus on areas of importance.
Note
This option is only available when one of the following conditions is met: there are missing values in the dataset, the chart's access is scalable, the project is binary classification.
Click the gear setting to view the choices:
Check or uncheck the following boxes to activate:
-
Show Missing Values: Shows or hides the effect of missing values. This selection is available for numeric features only. The bin corresponding to missing values is labeled as =Missing=.
-
Auto-scale Y-axis: Resets the Y-axis range, which is then used to chart the actual data, the prediction, and the partial dependence values. When checked (the default), the values on the axis span the highest and lowest values of the target feature. When unchecked, the scale spans the entire eligible range (for example, 0 through 1 for binary projects).
-
Log X-Axis: Toggles between the different X-axis representations. This selection is available for highly skewed (distribution where one of tail is longer than the other) with numeric features having values greater than zero.
List of features
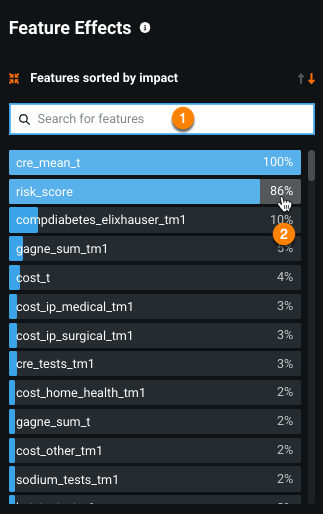
The following table describes the feature list output of the Feature Effects display:
| Element | Description | |
|---|---|---|
| 1 | Search for features | Lists of the top features that have more than zero-influence on the model, based on the Feature Impact (Feature Effects) score. |
| 2 | Score | Reports the relevance to the target feature. This is the value displayed in the Feature Impact display. |
To the left of the graph, DataRobot displays a list of the top 500 predictors. Use the arrow keys or scroll bar to scroll through features, or the search field to find by name. If all the sample rows are empty for a given feature, the feature is not available in the list. Selecting a feature in the list updates the display to reflect results for that feature.
Each feature in the list is accompanied by its feature impact score. Feature impact measures, for each of the top 500 features, the importance of one feature on the target prediction. It is estimated by calculating the prediction difference before and after shuffling the selected rows of one feature (while leaving other columns unchanged). DataRobot normalizes the scores so that the value of the most important column is 1 (100%). A score of 0% indicates that there was no calculated relationship.
Feature Effects results
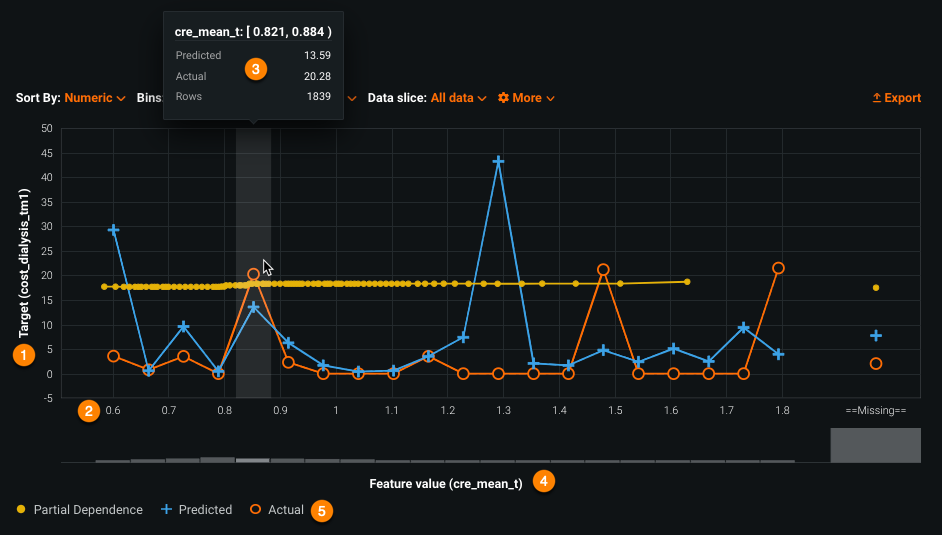
| Element | Description | |
|---|---|---|
| 1 | Target range | Displays the value range for the target; the Y-axis values can be adjusted with the scaling option. |
| 2 | Feature values | Displays individual values of the selected feature. |
| 3 | Feature values tooltip | Provides summary information for a feature's binned values. |
| 4 | Feature value count | Sets, for the selected feature, the feature distribution for the selected partition fold. |
| 5 | Display controls | Sets filters that control the values plotted in the display (partial dependence, predicted, and/or actual). |
Target range (Y-axis)
The Y-axis represents the value range for the target variable. For binary classification and regression problems, this is a value between 0 and 1. For non-binary projects, the axis displays from min to max values. Note that you can use the scaling feature to change the Y-axis and bring greater focus to the display.
Feature values (X-axis)
The X-axis displays the values found for the feature selected in the list of features. The selected sort order controls how the values are displayed. See the section on partial dependence calculations for more information.
For numeric features
The logic for a numeric feature depends on whether you are displaying predicted/actual or partial dependence.
Predicted/actual logic
-
If the value count in the selected partition fold is greater than 20, DataRobot bins the values based on their distribution in the fold and computes Predicted and Actual for each bin.
-
If the value count is 20 or less, DataRobot plots Predicted/Actuals for the top values present in the fold selected.
Partial dependence logic
-
If the value count of the feature in the entire dataset is greater than 99, DataRobot computes partial dependence on the percentiles of the distribution of the feature in the entire dataset.
-
If the value count is 99 or less, DataRobot computes partial dependence on all values in the dataset (excluding outliers).
Chart-specific logic
Partial dependence feature values are derived from the percentiles of the distribution of the feature across the entire dataset. The X-axis may additionally display a ==Missing== bin, which contains the effect of missing values. Partial dependence calculation always includes "missing values," even if the feature is not missing throughout dataset. The display shows what would be the average predictions if the feature were missing—DataRobot doesn't need the feature to actually be missing, it's just a "what if."
For categorical features
For categorical, the X-axis displays the 25 most frequent values for predicted, actual, and partial dependence in the selected partition fold. The categories can include, as applicable:
=All Other=: For categorical features, a single bin containing all values other than the 25 most frequent values. No partial dependence is computed for=All Other=. DataRobot uses one-hot encoding and ordinal encoding preprocessing tasks to automatically group low-frequency levels.
For both tasks you can use the min_support advance tuning parameter to group low-frequency values. By default, DataRobot uses a value of 10 for the one-hot encoder and 5 for the ordinal encoder. In other words, any category that has fewer than 10 levels (one-hot encoder) or 5 (ordinal encoder) is combined into 1 group.
-
==Missing==: A single bin containing all rows with missing feature values (that is, NaN as the value of one of the features). -
==Other Unseen==: A single bin containing all values that were not present in the Training set. No partial dependence is computed for=Other Unseen=. See the explanation below for more information.
Feature value tooltip
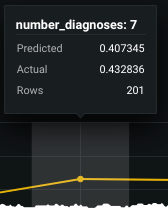
For each bin, to display a feature's calculated values and row count, hover in the display area above the bin. For example, this tooltip:
Indicates:
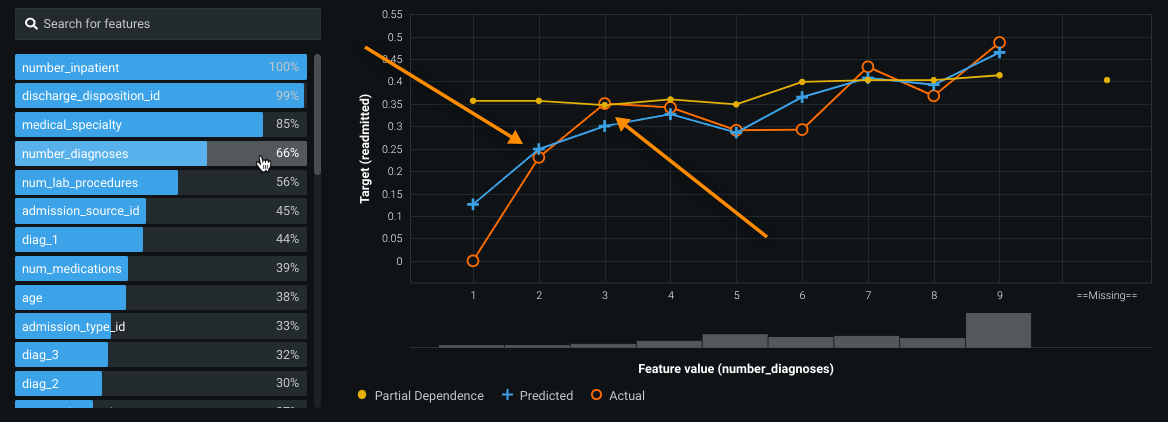
For the feature number diagnoses when the value is 7, the partial dependence average was (roughly) 0.407 and the actual values average was 0.432. These averages were calculated from 201 rows in the dataset (in which the number of diagnoses was seven). Select the Predicted label to see the predicted average.
Feature value count
The bar graph below the X-axis provides a visual indicator, for the selected feature, of each of the feature's value frequencies. The bars are mapped to the feature values listed above them, and so changing the sort order also changes the bar display. This is the same information as that presented in the Frequent Values chart on the Data page. For qualifying feature types, you can use the Bins dropdown to set the number of bars (determine the binning).
Display controls
Use the display control links to set the display of plotted data. Actual values are represented by open orange circles, predicted valued by blue crosses, and partial dependence points by solid yellow circles. In this way, points lie on top without blocking view of each other. Click or unclick the label in the legend to focus on a particular aspect of the display. See below for information on how DataRobot calculates and displays the values.
More info...
The following sections describe:
- How DataRobot calculates average values and partial dependence
- Interpreting the displays
- Time-aware data selection
- Understanding unseen values
- How Exposure and Weight change output
Average value calculations
For the predicted and actual values in the display, DataRobot plots the average values. The following simple example explains the calculation.
In the following dataset, Feature A has two possible values—1 and 2:
| Feature A | Feature B | Target |
|---|---|---|
| 1 | 2 | 4 |
| 2 | 3 | 5 |
| 1 | 2 | 6 |
| 2 | 4 | 8 |
| 1 | 3 | 1 |
| 2 | 2 | 2 |
In this fictitious dataset, the X axis would show two values: 1 and 2. When target value A=1, DataRobot calculates the average as 4+6+1 / 3. When A=2, the average is 5+8+2 / 3. So the actual and predicted points on the graph show the average target for each aggregated feature value.
Specifically:
- For numeric features, DataRobot generates bins based on the feature domain. For example, for the feature
Agewith a range of 16-101, bins (the user selects the number) would be based on that range. - For categorical features, for example
Gender, DataRobot generates bins based on the top unique values (perhaps 3 bins—M,F,N/A).
DataRobot then calculates the average values of prediction in each bin and the average of the actual values of each bin.
Interpret the displays
In the Feature Effects display, categorical features are represented as points; numerical features are represented as connected points. This is because each numerical value can be seen in relation to the other values, while categorical features are not linearly related. A dotted line indicates that there were not enough values to plot.
Note
If you are using the Exposure parameter feature available from the Advanced options tab, line calculations differ.
Consider the following Feature Effects display:
The orange open circles depict, for the selected feature, the average target value for the aggregated number_diagnoses feature values. In other words, when the target is readmitted and the selected feature is number_diagnoses, a patient with two diagnoses has, on average, a roughly 23% chance of being readmitted. Patients with three diagnoses have, on average, a roughly 35% chance of readmittance.
The blue crosses depict, for the selected feature, the average prediction for a specific value. From the graph you can see that DataRobot averaged the predicted feature values and calculated a 25% chance of readmittance when number_diagnoses is two. Comparing the actual and predicted lines can identify segments where model predictions differ from observed data. This typically occurs when the segment size is small. In those cases, for example, some models may predict closer to the overall average.
The yellow Partial Dependence line depicts the marginal effect of a feature on the target variable after accounting for the average effects of all other predictive features. It indicates how, holding all other variables except the feature of interest as they were, the value of this feature affects your prediction. The value of the feature of interest is then reassigned to each possible value, calculating the average predictions for the sample at each setting. (From the simple example above, DataRobot calculates the average results when all 1000 rows use value 1 and then again when all 1000 rows use value 2.) These values help determine how the value of each feature affects the target. The shape of the yellow line "describes" the model’s view of the marginal relationship between the selected feature and the target. See the discussion of partial dependence calculation for more information.
Tips for using the displays:
-
To evaluate model accuracy, uncheck the partial dependence box. You are left with a visual indicator that charts actual values against the model's predicted values.
-
To understand partial dependence, uncheck the actual and predicted boxes. Set the sort order to Effect Size. Consider the partial dependence line carefully. Isolating the effect of important features can be very useful in optimizing outcomes in business scenarios.
-
If there are not enough observations in the sample at a particular level, the partial dependency computation may be missing for a specific feature value.
-
A dashed instead of solid predicted (blue) and actual (orange) line indicates that there are no rows in the bins created at the point in the chart.
-
For numeric variables, if there are more than 18 values, DataRobot calculates partial dependence on values derived from the percentiles of the distribution of the feature across the entire dataset. As a result, the value is not displayed in the hover tooltip.
Training data as the viewing subset
Viewing Feature Effect for training data provides a few benefits. It helps to determine how well a trained model fits the data it used for training. It also lets you compare the difference between seen and unseen data in the model performance. In other words, viewing the training results is a way to check the model against known values. If the predicted vs the actual results from the training set are weak, it is a sign that the model is not appropriately selected for the data.
When considering partial dependence, using training data means the values are calculated based on training samples and compared against the maximum possible feature domain. It provides the option to check the relationship between a single feature (by removing marginal effects from other features) and the target across the entire range of the data. For example, suppose the validation set covers January through June but you want to see partial dependence in December. Without that month's data in validation, you wouldn't be able to. However, by setting the data selection subset to Training, you could see the effect.
Partial dependence calculations
Predicted/actual and partial dependence values are computed very differently for continuous data. The calculations that bin the data for predicted/actual (for example, (1-40], (40-50]...) are created to result in sufficient material for computing averages. DataRobot then bins the values based on the distribution of the feature for the selected partition fold.
Partial dependence, on the other hand, uses single values (for example, 1, 5, 10, 20, 40, 42, 45...) that are percentiles of the distribution of the feature across the entire dataset. It uses up to 1000-row samples to determine the scale of the curve. To make the scale comparable with predicted/actual, the 1000 samples are drawn from the data of the selected fold. In other words, partial dependence is calculated for the maximum possible range of values from the entire dataset but scaled based on the Data Selection fold setting.
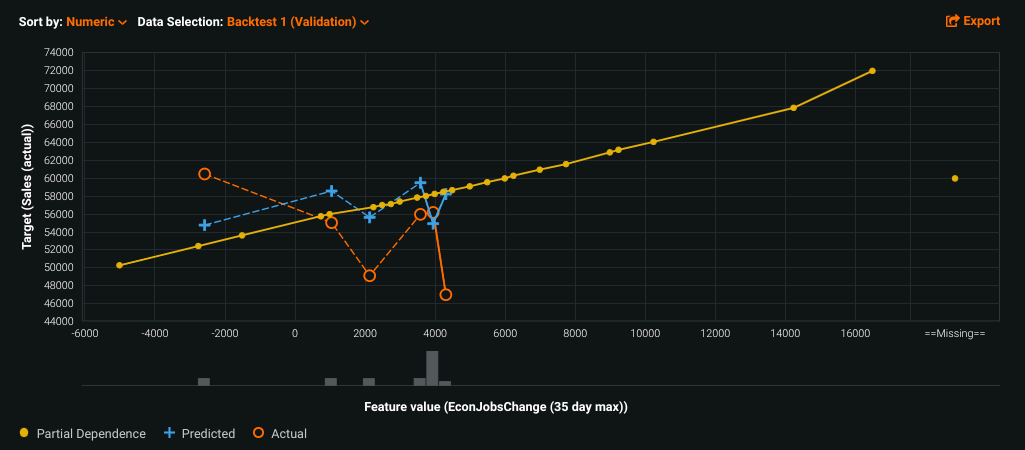
For example, consider a feature year. For partial dependence, DataRobot computes values based on all the years in the data. For predicted/actual, computation is based on the years in the selected fold. If the dataset dates range from 2001-01-01 to 2010-01-01, DataRobot uses that span for partial dependence calculations. Predicted/actual calculations, in contrast, contain only the data from the corresponding, selected fold/backtest. You can see this difference when viewing all three control displays for a selected fold:
Deep dive: Partial dependence calculations
The partial dependence plot shows the marginal effect a feature has on the predicted outcome of a machine learning model—or how the prediction varies if we just change one feature and keep everything else constant. The following calculation illustrates this for one feature, X1, on a sample of 1000 records of training data.
Assume that X1 has 5 different values (like 0, 5, 10, 15, 20). For all 1000 records, DataRobot creates artificial data points by keeping all features constant except the feature X1, which translates to 5,000 records (each row duplicated 5 times with one value of the different levels of X1). Then it makes predictions for all 5,000 records and averages the predictions for each level of X1. This average prediction now corresponds to the marginal effect of feature X1, as displayed on the partial dependence plot.
If there are 10 features, and each feature has 5 different values in a training dataset of 10K records, creating the marginal effect using all the data would require making predictions using 500k records (computationally expensive). Because it can obtain similar results for less "cost," DataRobot only uses a representative sample of the data to calculate partial dependence.
Why is the partial dependence plot short compared to the range of the actual data?
Note that because calculations are based on 1000 rows, it is quite possible that values from the tail ends of the distribution aren't captured by the sample. Also, the selected partition (holdout or validation) may not contain the full range of data, which can be especially true in the case of OTV or group partitioning. Finally, Feature Effects uses its own outlier logic to improve the clarity of the chart. If in the given sample, 4% of the tail ends represent more than 20% of X-axis, DataRobot limits the calculations to a range between the 2-98 percentiles.
Data selection for time-aware projects
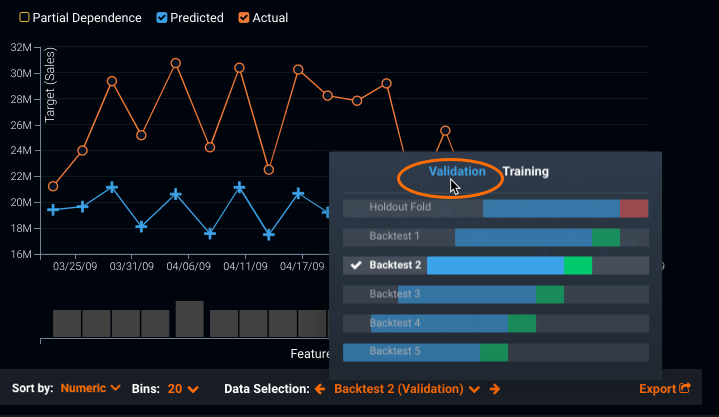
When working with time-aware projects, Data Selection dropdown works a bit differently because of the backtests. Select the Feature Effects tab for your model of interest. If you haven't already computed values for the tab, you are prompted to compute for Backtest 1 (Validation).
Note
If the model you are viewing uses start and end dates (common for the recommended model), backtest selection is not available.
When DataRobot completes the calculations, the insight displays with the following Data Selection setting:
Calculate backtests
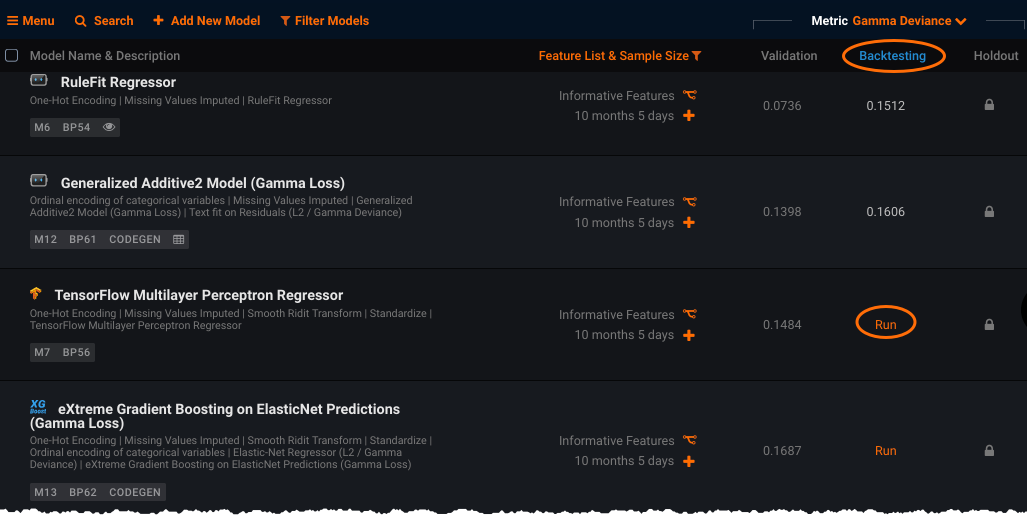
The results of clicking on the backtest name depend on whether backtesting has been run for the model. DataRobot automatically computes backtests for the highest scoring models; for lower-scoring models, you must select Run from the Leaderboard to initiate backtesting:
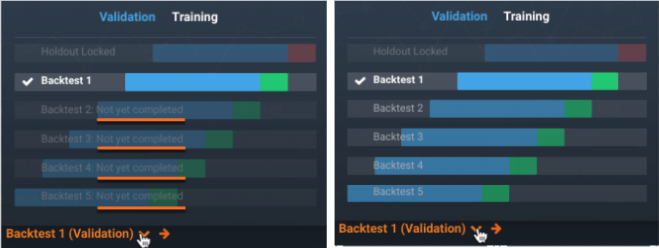
For comparison, the following illustrates when backtests have not been run and when they have:
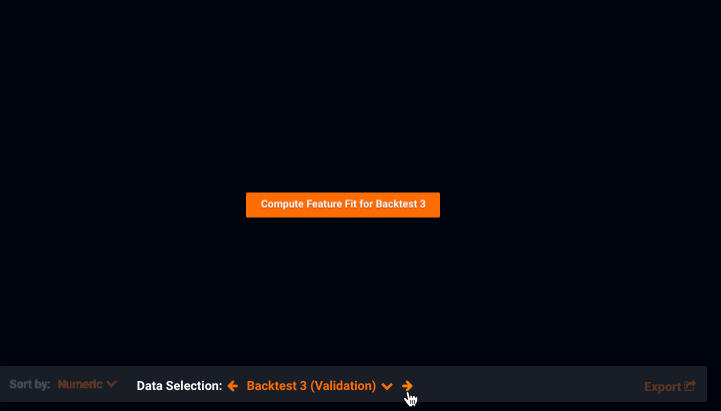
When calculations are complete, you must then run Feature Effect calculations for each backtest you want to display, as well as for the Holdout fold, if applicable. From the dropdown, click a backtest that is not yet computed and DataRobot provides a button to initiate calculations.
Set the partition fold
Once backtest calculations are complete for your needs, use the Data Selection control to choose the backtest and partition for display. The available partition folds are dependent on the backtest:
Options are:
- For numbered backtests: Validation and Training for each calculated backtest
- For the Holdout Fold: Holdout and Training
Click the down arrow to open the dialog and select a partition:
Or, click the right and left arrows to move through the options for the currently selected partition—Validation or Training—plus Holdout. If you move to an option that has yet to be computed, DataRobot provides a button to initiate the calculation:
Interpret days as numerics
When interpreting the results of a Feature Effects chart within a time series project, the derived Datetime (Day of Week) (actual) feature correlates a day to a numeric. Specifically, Monday is always 0 in a Day of Week feature (Tuesday is 1, etc.). DataRobot uses the Python time access and conversion module (tm_wday) for this time-related function.
Binning and top values
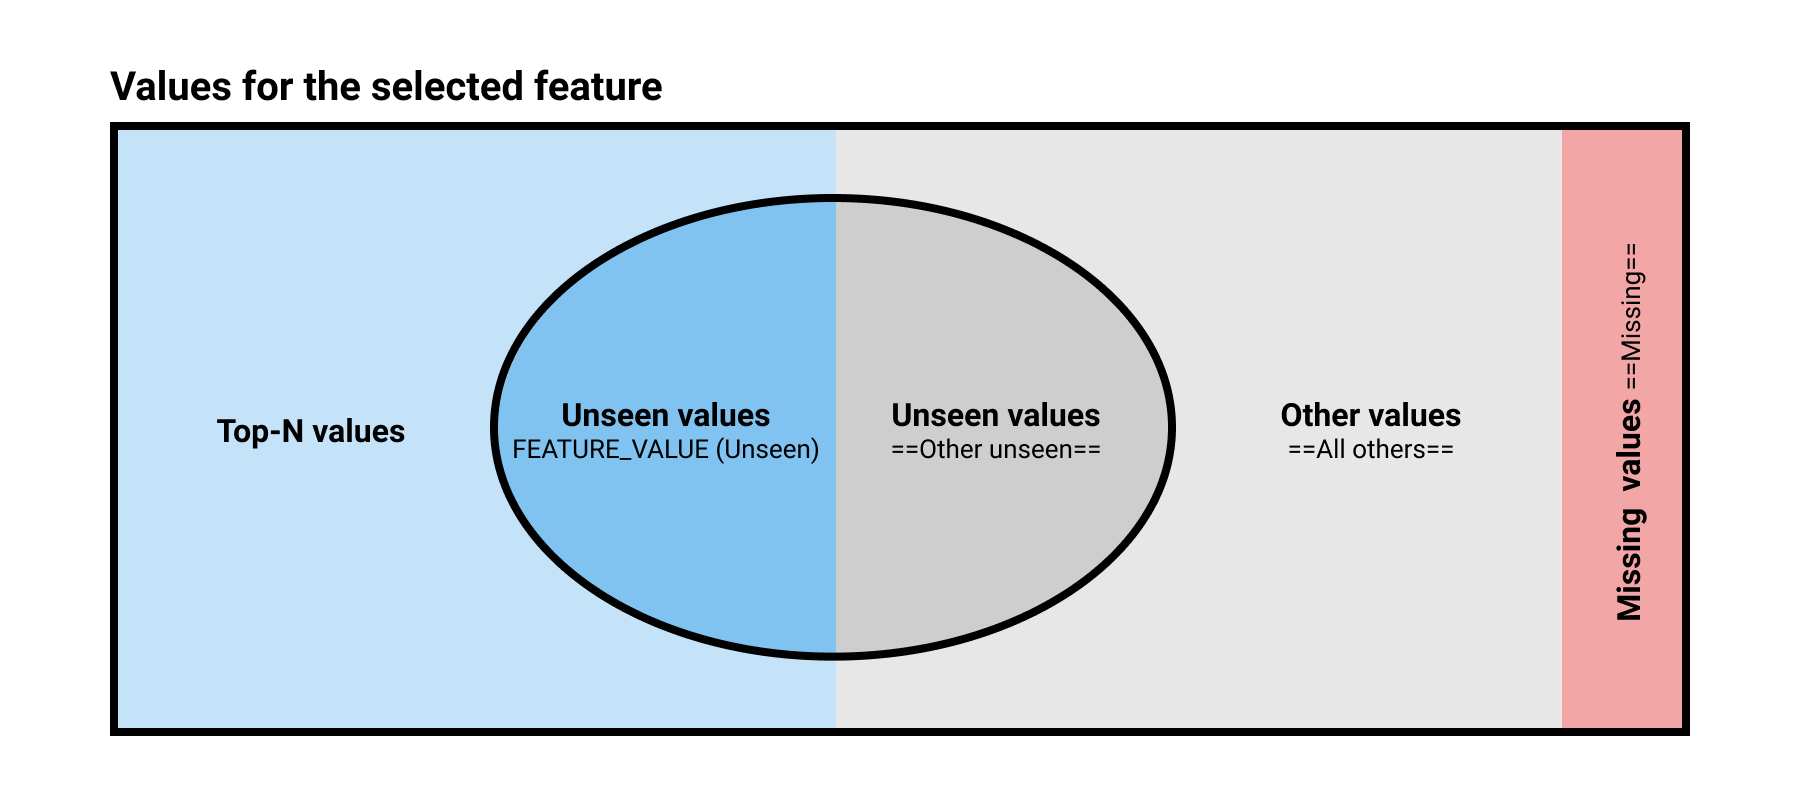
By default, DataRobot calculates the top features listed in Feature Effects using the training dataset. For categorical feature values, displayed as discrete points on the X-axis, the segmentation is affected if you select a different data source. To understand the segmentation, consider the illustration below and the table describing the segments:
| As illustrated in chart | Label in chart | Description |
|---|---|---|
| Top-N values | <feature_value> | Values for the selected feature, with a maximum of 20 values. For any feature with more than 10 values, DataRobot further filters the results, as described in the example below. |
| Other values | ==All Other== |
A single bin containing all values other than the Top-N most frequent values. |
| Missing values | ==Missing== |
A single bin containing all records with missing feature values (that is, NaN as the value of one of the features). |
| Unseen values | <feature_value> (Unseen) |
Categorical feature values that were not "seen" in the Training set but qualified as Top-N in Validation and/or Holdout. |
| Unseen values | ==Other Unseen== |
Categorical feature values that were not "seen" in the Training set and did not qualify as Top-N in Validation and/or Holdout. |
A simple example to explain Top-N:
Consider a dataset with categorical feature Population and a world population of 100. DataRobot calculates Top-N as follows:
- Ranks countries by their population.
- Selects up to the top-20 countries with the highest population.
- In cases with more than 10 values, DataRobot further filters the results so that accumulative frequency is >95%. In other words, DataRobot displays in the X-axis those countries where their accumulated population hits 95% of the world population.
A simple example to explain Unseen:
Consider a dataset with the categorical feature Letters. The complete list of values for Letters is A, B, C, D, E, F, G, H. After filtering, DataRobot determines that Top-N equals three values. Note that, because the feature is categorical, there is no Missing bin.
| Fold/set | Values found | Top-3 values | X-axis values |
|---|---|---|---|
| Training set | A, B, C, D | A, B, C | A, B, C, =All Other= |
| Validation set | B, C, F, G+ | B, C, F* | B, C, F (unseen), =All Other=, Other Unseen+ |
| Holdout set | C, E, F, H+ | C, E, F | C, E (unseen), F (unseen), =All Other=, Other Unseen+ |
* A new value in the top 3 but not present in the Training set, flagged as Unseen
+ A new value not present in Training or in top-3, flagged as Other Unseen
How Exposure changes output
If you used the Exposure parameter when building models for the project, the Feature Effects tab displays the graph adjusted to exposure. In this case:
-
The orange line depicts the sum of the target divided by the sum of exposure for a specific value. The label and tooltip display Sum of Actual/Sum of Exposure, which indicates that exposure was used during model building.
-
The blue line depicts the sum of predictions divided by the sum of exposure and the legend label displays Sum of Predicted/Sum of Exposure.
-
The marginal effect depicted in the yellow partial dependence is divided by the sum of exposure of the 1000-row sample. This adjustment is useful in insurance, for example, to understand the relationship between annualized cost of a policy and the predictors. The label tooltip displays Average partial dependency adjusted by exposure.
How Weight changes output
If you set the Weight parameter for the project, DataRobot weights the average and sum operations as described above.
