Learning Curves
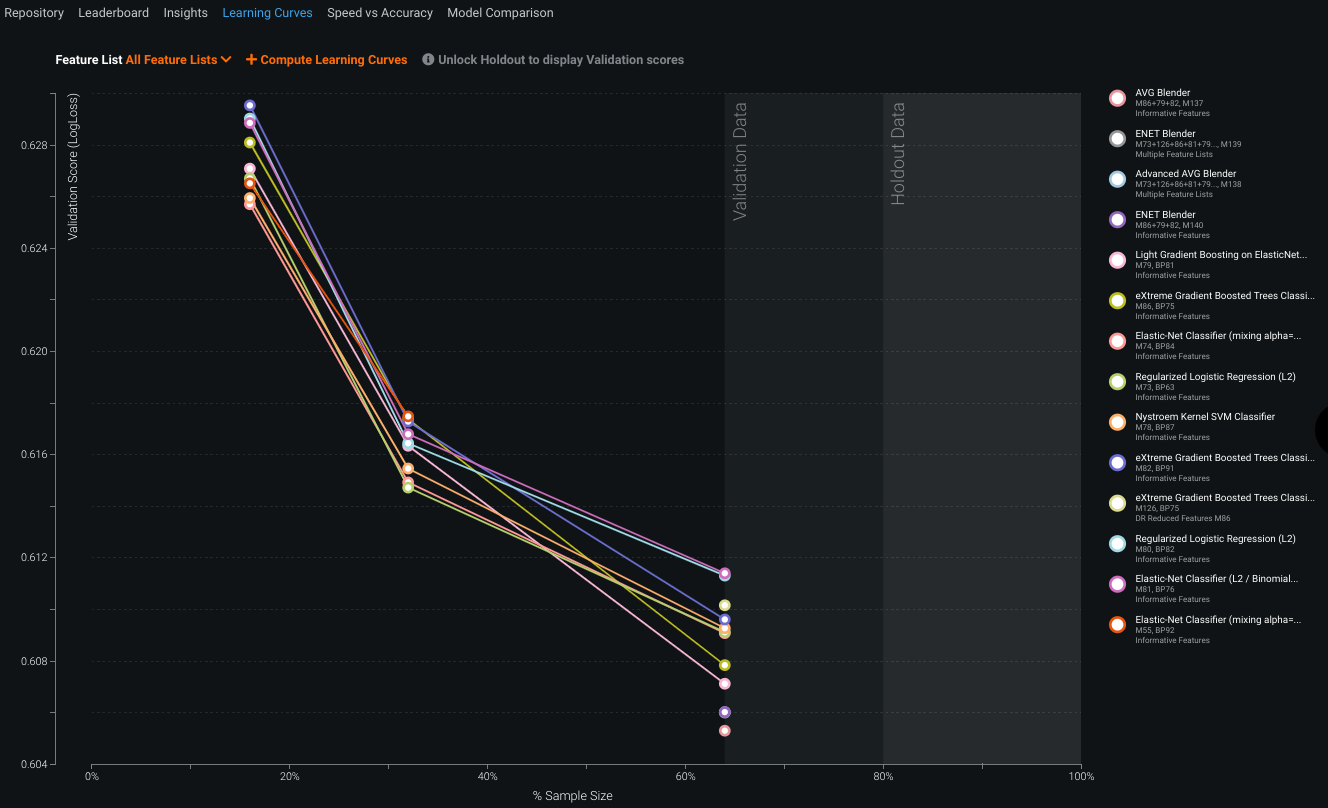
Use the Learning Curve graph to help determine whether it is worthwhile to increase the size of your dataset. Getting additional data can be expensive, but may be worthwhile if it increases model accuracy. The Learning Curve graph illustrates, for the top-performing models, how model performance varies as the sample size changes. It is based on the current metric set to sort the Leaderboard. (See below for information on how DataRobot calculates model selection for display.)
After you have started a model build, select Learning Curves to display the graph, which shows the stages (sample sizes) used by Autopilot. The display updates as models finish building, reprocessing the graphs with the new model score(s). The image below shows a graph for an AutoML project. For time-aware models, you can set the view (OTV only) and you cannot modify sample size.
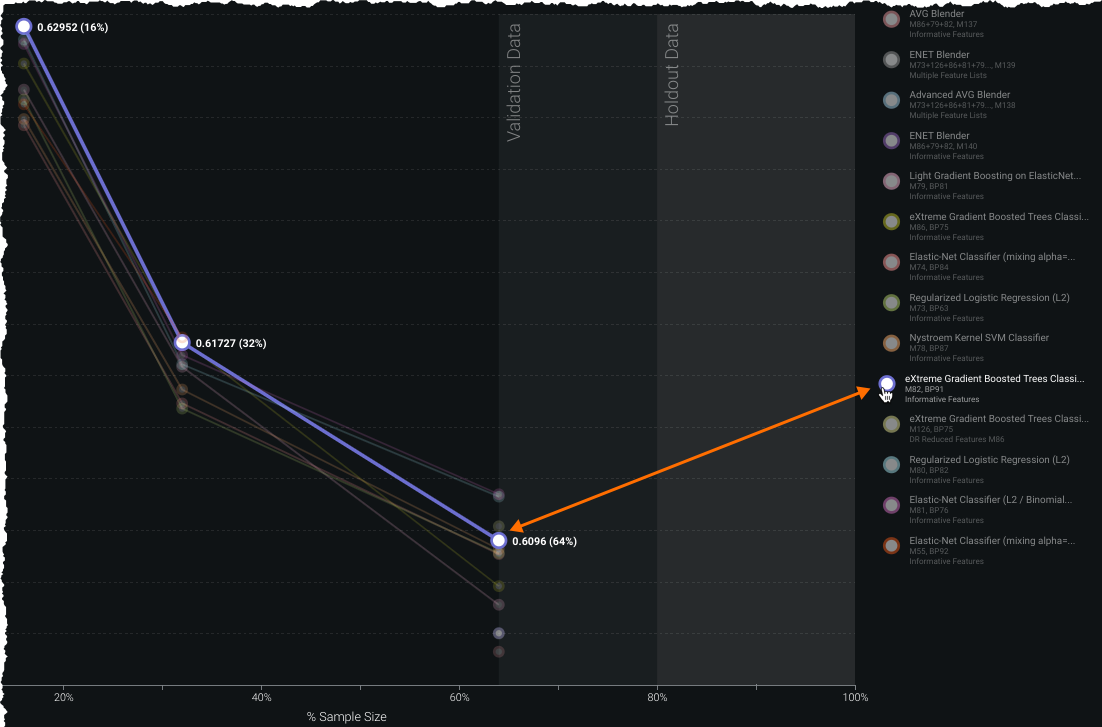
To see the actual values for a data point, mouse over the point on the graph's line or the color bar next to the model name to the right of the graph:
Not all models show three sample sizes in the Learning Curves graph. This is because as DataRobot reruns data with a larger sample size, only the highest scoring models from the previous run progress to the next stage. Additionally, blenders are only run on the highest sample percent (which is determined by partitioning settings). Also, the number of points for a given model depend on the number of rows in your dataset. Small datasets (AutoML and time-aware) also impact the number of stages run and shown.
Interpret Learning Curves
Consider the following when evaluating the Learning Curves graph:
-
You must unlock holdout to display Validation scores.
-
Study the model for any sharp changes or performance decrease with increased sample size. If the dataset or the validation set is small, there may be significant variation due to the exact characteristics of the datasets.
-
Model performance can decrease with increasing sample size, as models may become overly sensitive to particular characteristics of the training set.
-
In general, high-bias models (such as linear models) may do better at small sample sizes, while more flexible, high-variance models often perform better at large sample sizes.
-
Preprocessing variations can increase model flexibility.
Compute new sample sizes
You can compute the Learning Curves graph for several models in a single click across a set of different sample sizes. By default, the graph auto-populates with sample sizes that map to the stages that were part of your modeling mode selection—three points (full Autopilot and the model recommended and prepared for deployment).
Learning Curves with Quick Autopilot
Because Quick Autopilot uses one-stage training, the Learning Curves graph that was initially populated will show only a single point. To use the Quick run as the basis for this visualization, you can manually run models at various sample sizes or run a different Autopilot mode.
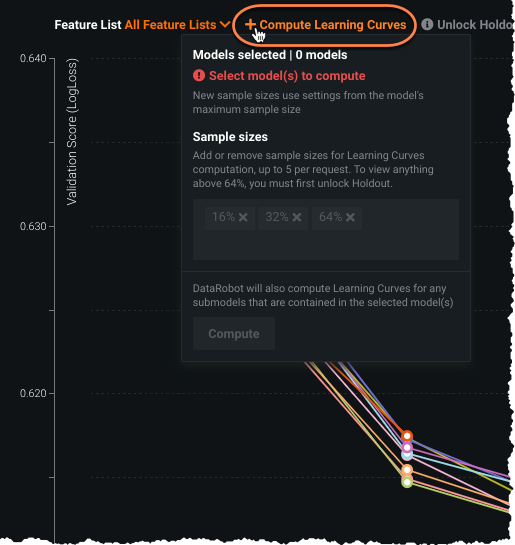
To compute and display additional sample sizes with the Compute Learning Curves option:
Adding sample sizes and clicking Compute causes DataRobot to recompute for the newly entered sizes. Computation is run for all models, or, if you selected one or more models from the list of the right, only for the selected model(s). While per-request size is limited to five sample sizes, you can display any number of points on the graph (using multiple requests). The sample size values you add via Compute Learning Curves are only remembered and auto-populated for that session; they do not persist if you navigate away from the page. To view anything above 64%, you must first unlock holdout.
Some notes on adding new sample sizes:
-
If you trained on a new sample size from the Leaderboard (by clicking the plus (
 ) sign), any atypical size (a size not available from the snap-to choices in the dialog to add a new model) does not automatically display on the Learning Curves graph, although you can add it from the graph.
 -
Initially, the sample size field populates with the default snap-to sizes (usually 16%, 32%, and 64%). Because the field only accepts five sizes per request, if you have more than two additional custom sizes you can delete the defaults if they are already plotted. (Their availability on the graph is dependent on the modeling mode you used to build the project.)
Learning Curves with OTV
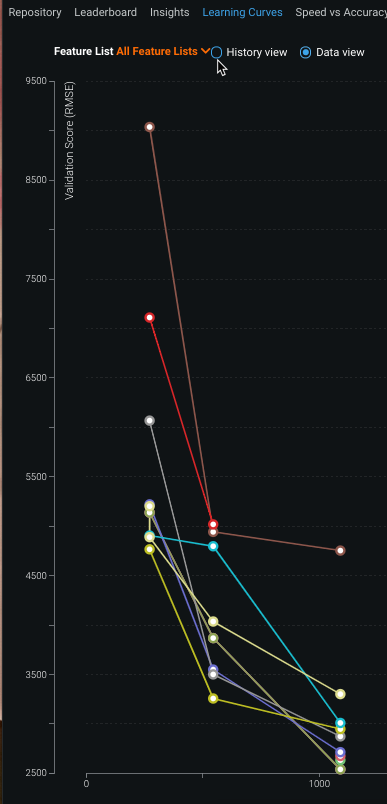
The Learning Curves graph is based on the mode used for selecting rows (rows, duration, or project settings and the sampling method (random or latest). Because these settings can result in different time periods in the training data, there are two views available to make the visualization meaningful to the mode—History view (charts top models by duration) and Data view (charts top models based on number of rows).
Switch between the views to see the one appropriate for your data. A straight line in history view suggests models were trained on datasets with the same observable history. For example, in Project Settings mode, 25%/50%/100%, if selected randomly, results in a different number or rows but with the same time period (in other words, different data density in the time period). Models that use start/end duration are not included in the Learning Curves graph because you can't directly compare these durations. While using the same time period, it could be from the start or end of the dataset, and applying that against a backtest does not provide comparable results.
Learning Curves additional info
The Learning Curves graph uses log loss (logarithmic loss) to plot model accuracy—the lower the log loss, the higher the accuracy. The display plots, for the top 10 performing models, log loss for each size data run. The resulting curves helps to predict how well each model will perform for a given quantity of training data.
Learning Curves charts how well a model group performs when it is computed across multiple sample sizes. This grouping represents a line in the graph, with each dot on the line representing the sample size and score of an individual model in that group.
DataRobot groups models on the Leaderboard by the blueprint ID and Feature List. So, for example, every Regularized Logistic Regression model, built using the Informative Features feature list, is a single model group. A Regularized Logistic Regression model built using a different feature list is part of a different model group.
By default, DataRobot displays:
- up to the top 10 grouped models. There may be fewer than 10 models if, for example, one or more of the models highly diverges from the top model. To preserve graph integrity, that divergent model is treated as a kind of outlier and is not plotted.
- any blenders models with scores that fall within an automatically determined threshold (that emphasizes important data points and graph legibility).
If the holdout is locked for your project, the display only includes data points computed based on the size of your training set. If the holdout is unlocked, data points are computed on training and validation data.
Filtering display by feature list
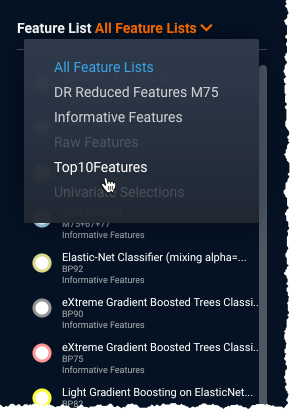
The Learning Curves graph plots using the Informative Features feature list. You can filter the graph to show models for a specific feature list that you created (and ran models for) by using the Feature List dropdown menu. The menu lists all feature lists that belong to the project. If you have not run models on a feature list, the option is displayed but disabled.
When you select an alternate feature list, DataRobot displays, for the selected feature list:
- the top 10 non-blended models
- any blenders models with scores that fall within an automatically determined threshold (that emphasizes important data points and graph legibility).
How Model Comparison uses actual value
What follows is a very simple example to illustrate the meaning of actual value on the Model Comparison page (Lift and Dual Lift Charts):
Imagine a simple dataset of 10 rows and the Lift Chart is displaying using 10 bins. The value of the target for rows 1 through 10 is:
0, 0, 0, 0, 0, 1, 1, 1, 1, 1
Model A is perfect and predicts:
0, 0, 0, 0, 0, 1, 1, 1, 1, 1
Model B is terrible and predicts:
1, 1, 1, 1, 1, 0, 0, 0, 0, 0
Now, because DataRobot sorts before binning, Model B sorts to:
0, 0, 0, 0, 0, 1, 1, 1, 1, 1
As a result, the bin 1 prediction is 0 for both models. Model A is perfect, so the bin 1 actual is also 0. With Model B, however, the bin 1 actual is 1.
