Make predictions
There are two ways to make predictions in No-Code AI Apps: batch predictions or single record predictions.
Note
All prediction requests are sent to DataRobot for processing, therefore, applications have the same prediction limits as the main DataRobot platform.
Batch predictions
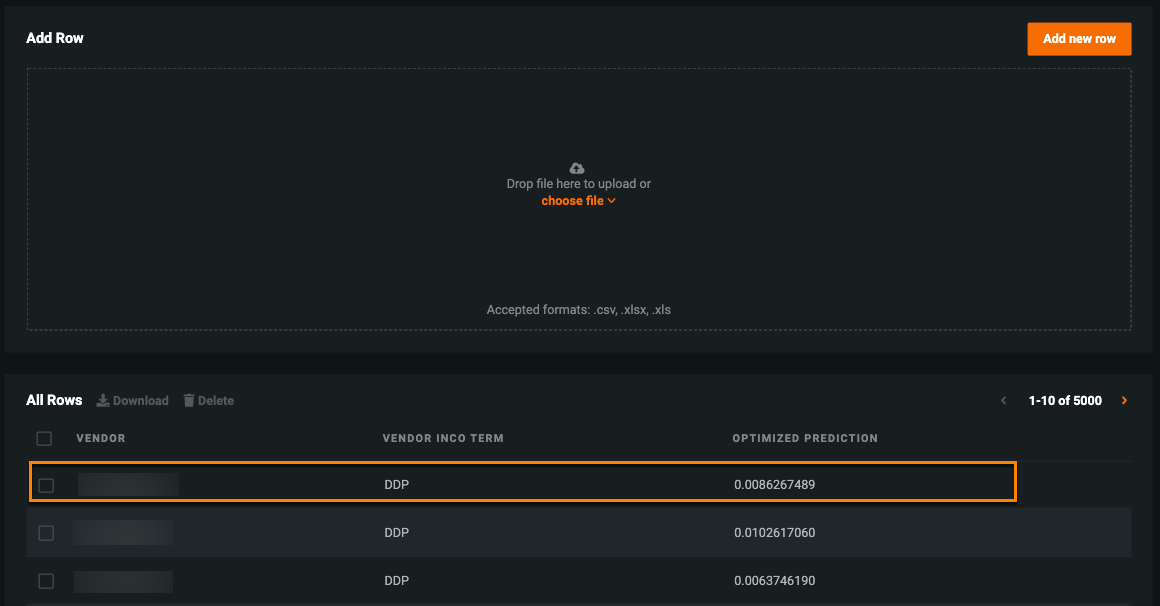
To make multiple prediction requests at once from the Home page, click choose file or drag the files into the box.
Note
Anonymous users (i.e., those accessing an application through a sharing link) can only submit batch predictions using a local file (CSV), while signed-in users can submit batch predictions using a local file (XLSX or CSV) or the AI Catalog. When signed-in users submit a batch prediction using a local XLSX file, it is automatically registered in the catalog.
After adding new files, the application processes your predictions and displays them in the All Rows widget on the Home page. Click on any record to view the prediction results.
Single record predictions
To make a new prediction:
-
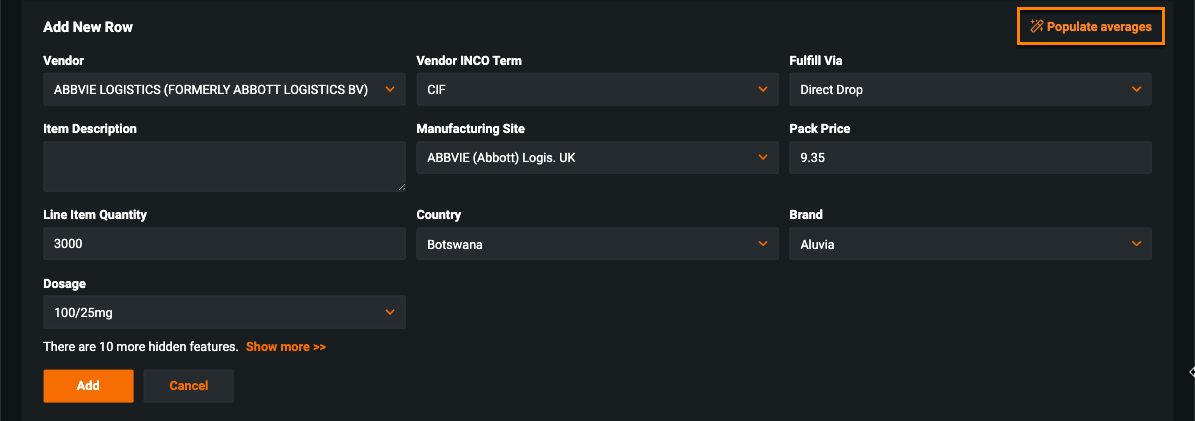
Click Add new row, bringing you to the Create Prediction page with the Add New Row widget, which displays the features available to make a prediction.
Why aren't some of my features showing up?
Reason 1: By default, the Add New Row widget only displays 10 features.
To display additional features, click Show more at the bottom of the widget. If there are still features missing, you must add them to the widget in Build mode. To add features, see the documentation on managing widget features.
Reason 2: No-Code AI Apps only uses "prediction features," meaning features that impact the deployment's predictions.
-
Fill in the feature fields—at least one field must have a value— and the association ID if one was added for the deployment. If a field is left blank, the feature field displays N/A on the prediction results page. Alternatively, you can click Populate averages to fill in the fields with the average value for each numeric feature and the first alphabetically ordered value of a categorical feature.
Location features for geospatial projects
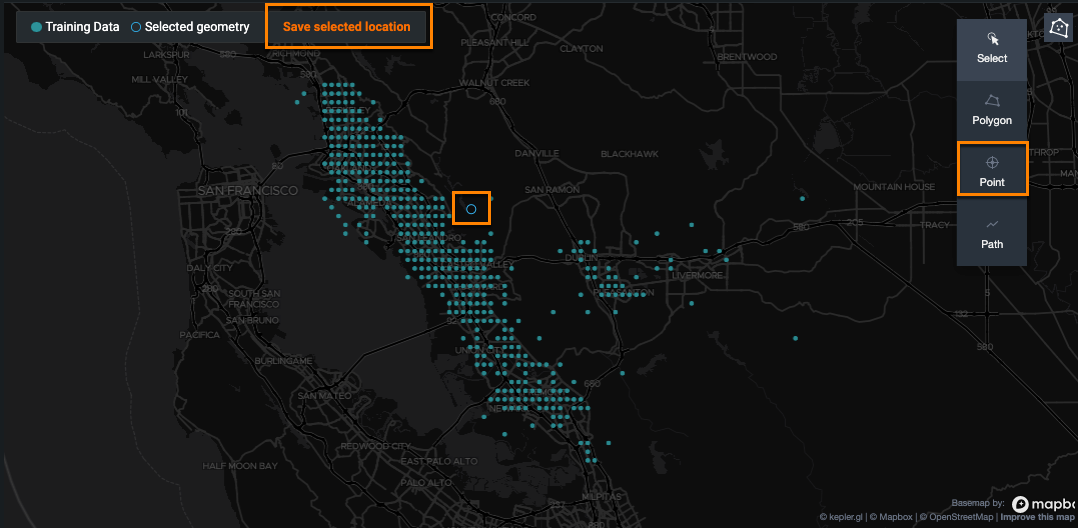
If the dataset contains a location feature, a globe icon appears in the feature field. You can manually enter a feature value in the field, or click the globe icon to view a visual representation of the training data.
The geometry type of the location feature determines the appearance of the training data on the map and affects which draw tool—Point, Polygon, or Path—you can use to highlight your prediction. In the example below, the location feature uses point geometry, so use the Point tool to add a new point to the map. With the point selected, click Save selected location; the point is then converted to a geojson string to make your prediction.
Click Add. After DataRobot completes the request, the prediction results page opens.
To add or remove feature fields, click Build and navigate to the Create Prediction page.


