Test custom models
You can test custom models in the Custom Model Workshop. Alternatively, you can test custom models prior to uploading them by testing locally with DRUM.
Testing workflow
Testing ensures that the custom model is functional before it is deployed by using the environment to run the model with prediction test data. Note that there are some differences in how predictions are made during testing and for a deployed custom model:
- Testing bypasses the prediction servers, but predictions for a deployment are done by using the deployment's prediction server.
- For both custom model testing and a custom model deployment, the model's target and partition columns are removed from prediction data before making predictions.
- A deployment can be used to make predictions with a dataset containing an association ID. In this case, run custom model testing with a dataset that contains the association ID to make sure that the custom model is functional with the dataset.
Read below for more details about the tests run for custom models.
-
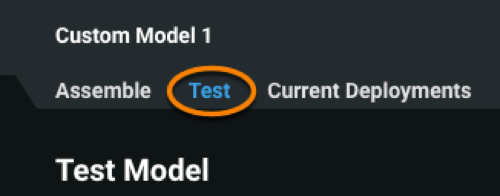
To test a custom inference model, navigate to the Test tab.
-
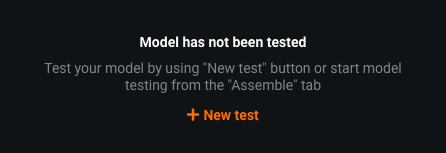
Select New test.
-
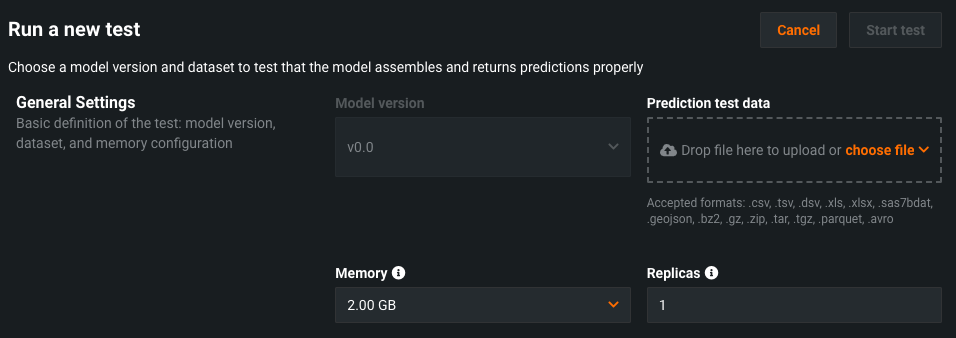
Confirm the model version and upload the prediction test data. You can also configure the resource settings, which are only applied to the test (not the model itself).
-
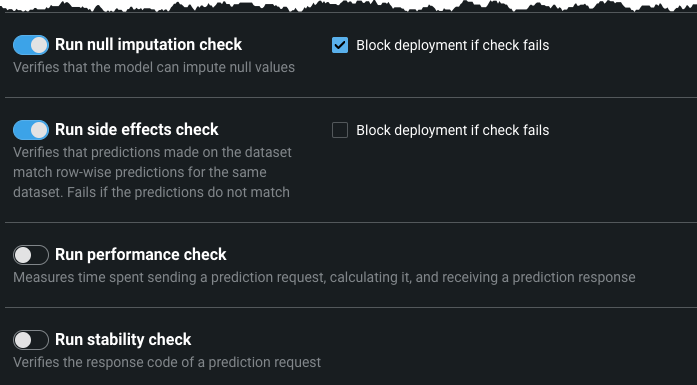
After configuring the general settings, toggle the tests that you want to run. For more information about a test, reference the testing overview section.
When a test is toggled on, an unsuccessful check returns "Error", blocking the deployment of the custom model and aborting all subsequent tests. If toggled off, an unsuccessful check returns "Warning", but still permits deployment and continues the testing suite.
Additionally, you can configure the tests' parameters (where applicable):
- Maximum response time: The amount of time allotted to receive a prediction response.
- Check duration limit: The total allotted time for the model to complete the performance check.
- Number of parallel users: The amount of users making prediction request in parallel.
-
Click Start Test to begin testing.
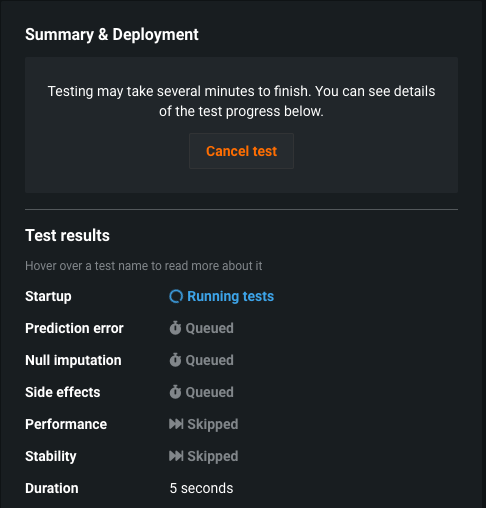
As testing commences, you can monitor the progress and view results for individual tests under the Summary & Deployment header in the Test tab. For more information about a test, hover over the test name in the testing modal (displayed below) or reference the testing overview.
-
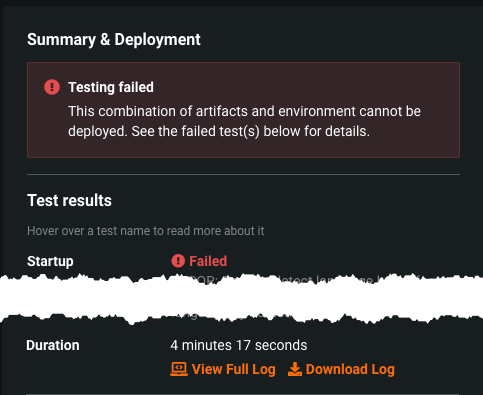
When testing is complete, DataRobot displays the results. If all testing succeeds, the model is ready to be deployed. If you are satisfied with the configured resource settings, you can apply those changes from the Assemble tab and create a new version of the model.
To view any errors that occurred, select View Full Log (the log is also available for download by selecting Download Log).
-
After assessing any issues and fixing them locally for a model, upload the fixed file(s) and update the model version(s). Run testing again with the new model version.
Testing overview
The following table describes the tests performed on custom models to ensure they are ready for deployment. Note that unstructured custom inference models only perform the "Startup Check" test, and skip all other procedures.
| Test name | Description |
|---|---|
| Startup | Ensures that the custom model image can build and launch. If the image cannot build or launch, the test fails and all subsequent tests are aborted. |
| Prediction error | Checks that the model can make predictions on the provided test dataset. If the test dataset is not compatible with the model or if the model cannot successfully make predictions, the test fails. |
| Null imputation | Verifies that the model can impute null values. Otherwise, the test fails. The model must pass this test in order to support Feature Impact. |
| Side effects | Checks that the batch predictions made on the entire test dataset match predictions made one row at a time for the same dataset. The test fails if the prediction results do not match. |
| Prediction verification | Verifies predictions made by the custom model by comparing them to the reference predictions. The reference predictions are taken from the specified column in the selected dataset. |
| Performance | Measures the time spent sending a prediction request, scoring, and returning the prediction results. The test creates 7 samples (from 1KB to 50MB), runs 10 prediction requests for each sample, and measures the prediction requests latency timings (minimum, mean, error rate etc.). The check is interrupted and marked as a failure if it elapses more than 10 seconds. |
| Stability | Verifies model consistency. Specify the payload size (measured by row number), the number of prediction requests to perform as part of the check, and what percentage of them require 200 response code. You can extract insights with these parameters to understand where the model may have issues (for example, model failures respond with non-200 codes most of the time). |
| Duration | Measures the time elapsed to complete the testing suite. |
Testing insights
Performance and stability checks
Individual tests offer specific insights. Select See details on a completed test.
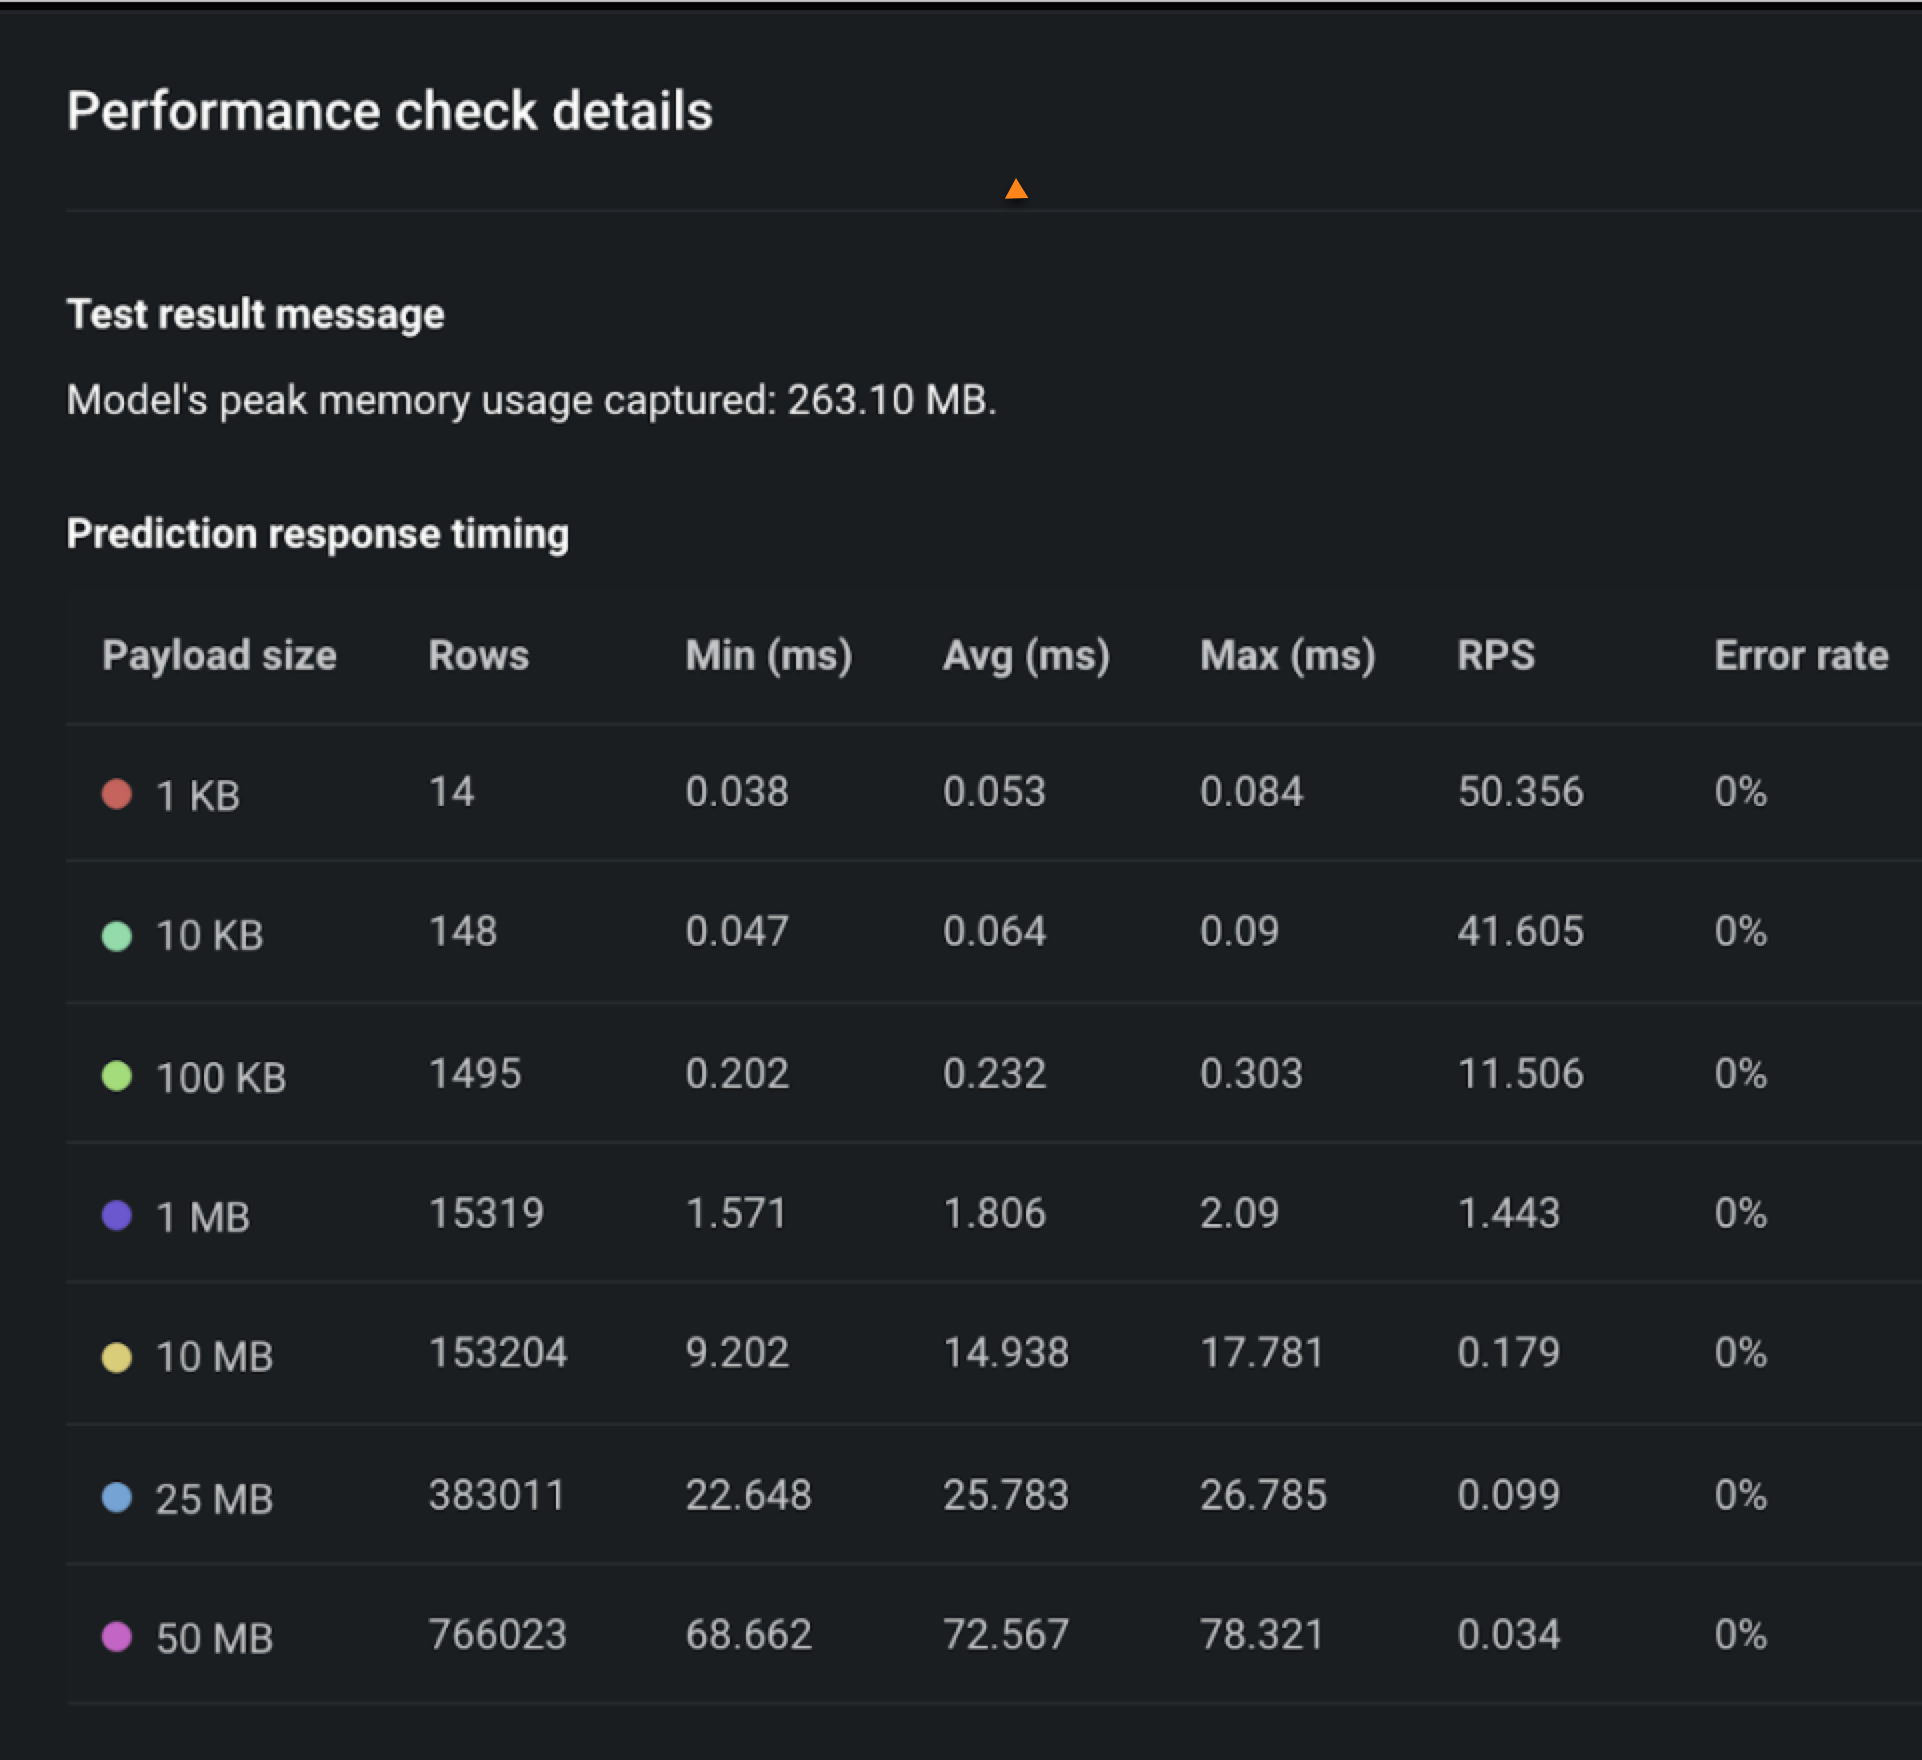
The performance check insights display a table showing the prediction latency timings at different payload sample sizes. For each sample, you can see the minimal, average, and maximum prediction request time, along with the request per second (RPS) and error rate. Note that the prediction requests made to the model during testing bypass the prediction server, so the latency numbers will be slightly higher in a production environment as the prediction server will add some latency.
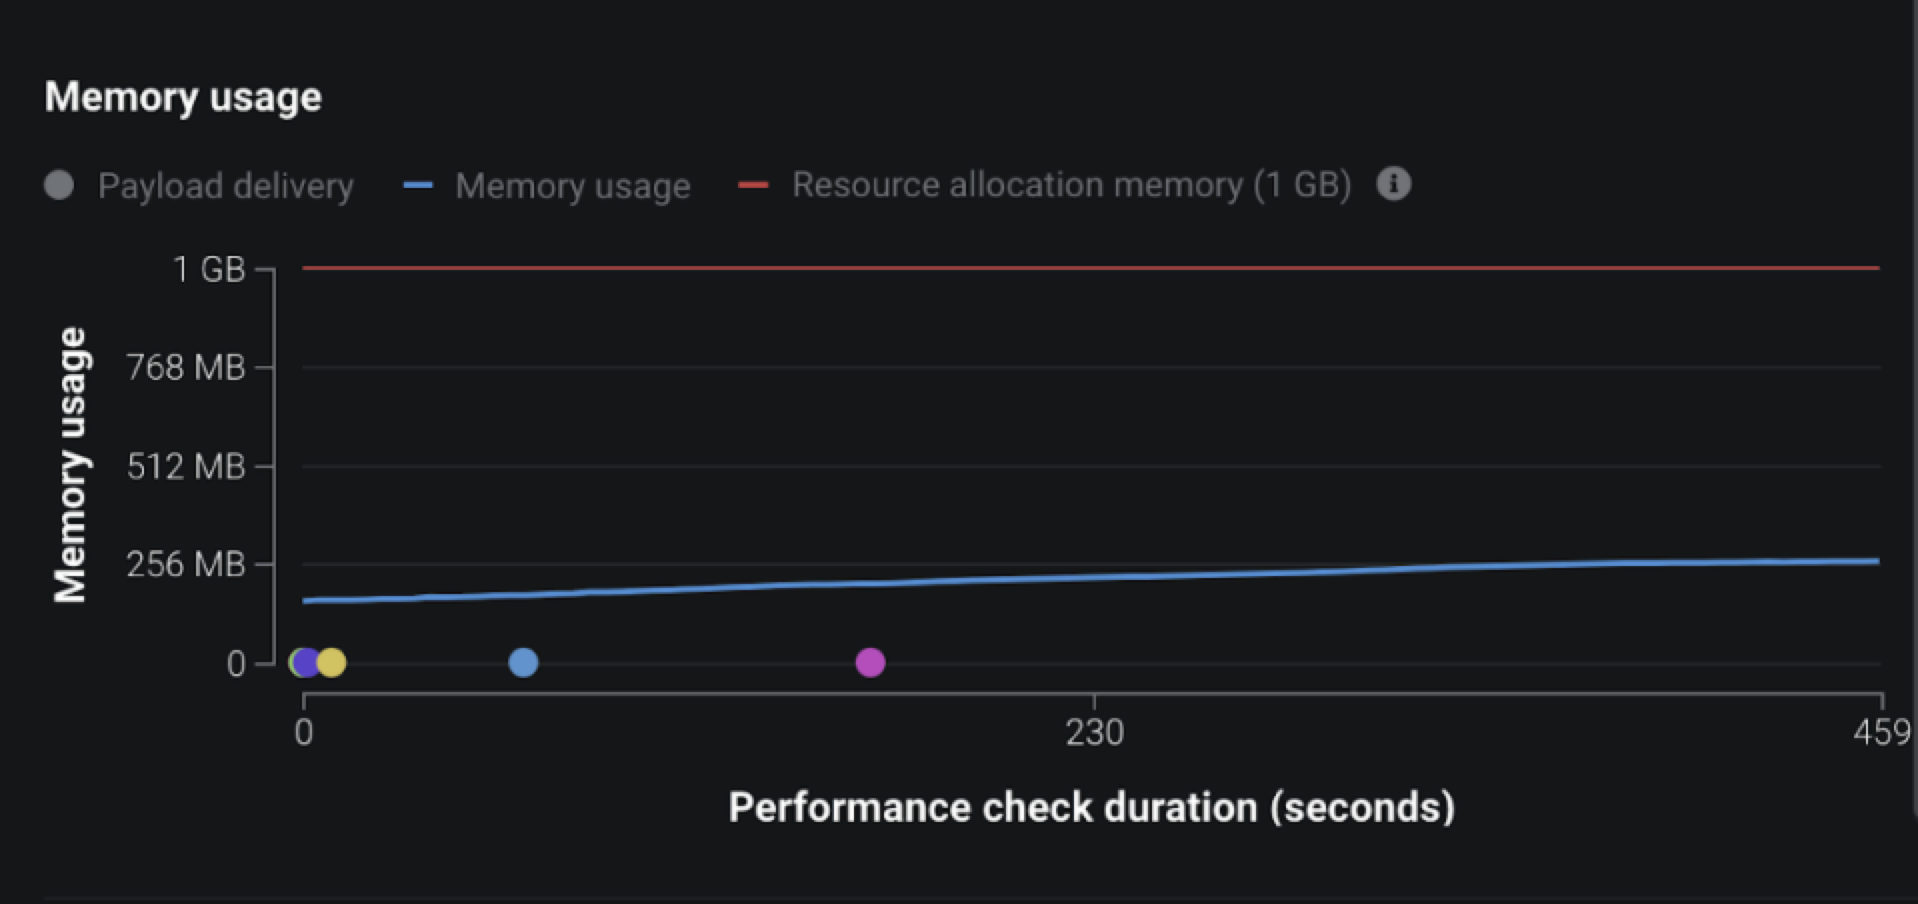
Additionally, both Performance and Stability checks display a memory usage chart. This data requires the model to use a DRUM-based execution environment in order to display. The red line represents the maximum memory allocated for the model. The blue line represents how memory was consumed by the model. Memory usage is gathered from several replicas; the data displayed on the chart is coming from a different replica each time. The data displayed on the chart is likely to differ from multi-replica setups. For multi-replica setups, the memory usage chart is constructed by periodically pulling the memory usage stats from a random replica. This means that if the load is distributed evenly across all the replica, the chart shows the memory usage of each replica's model.
Note that the model's usage can slightly exceed the maximum memory allocated because model termination logic depends on an underlying executor. Additionally, a model can be terminated even if the chart shows that its memory usage has not exceeded the limit, because the model is terminated before updated memory usage data is fetched from it.
Memory usage data requires the model to use a DRUM-based execution environment.
Prediction verification check
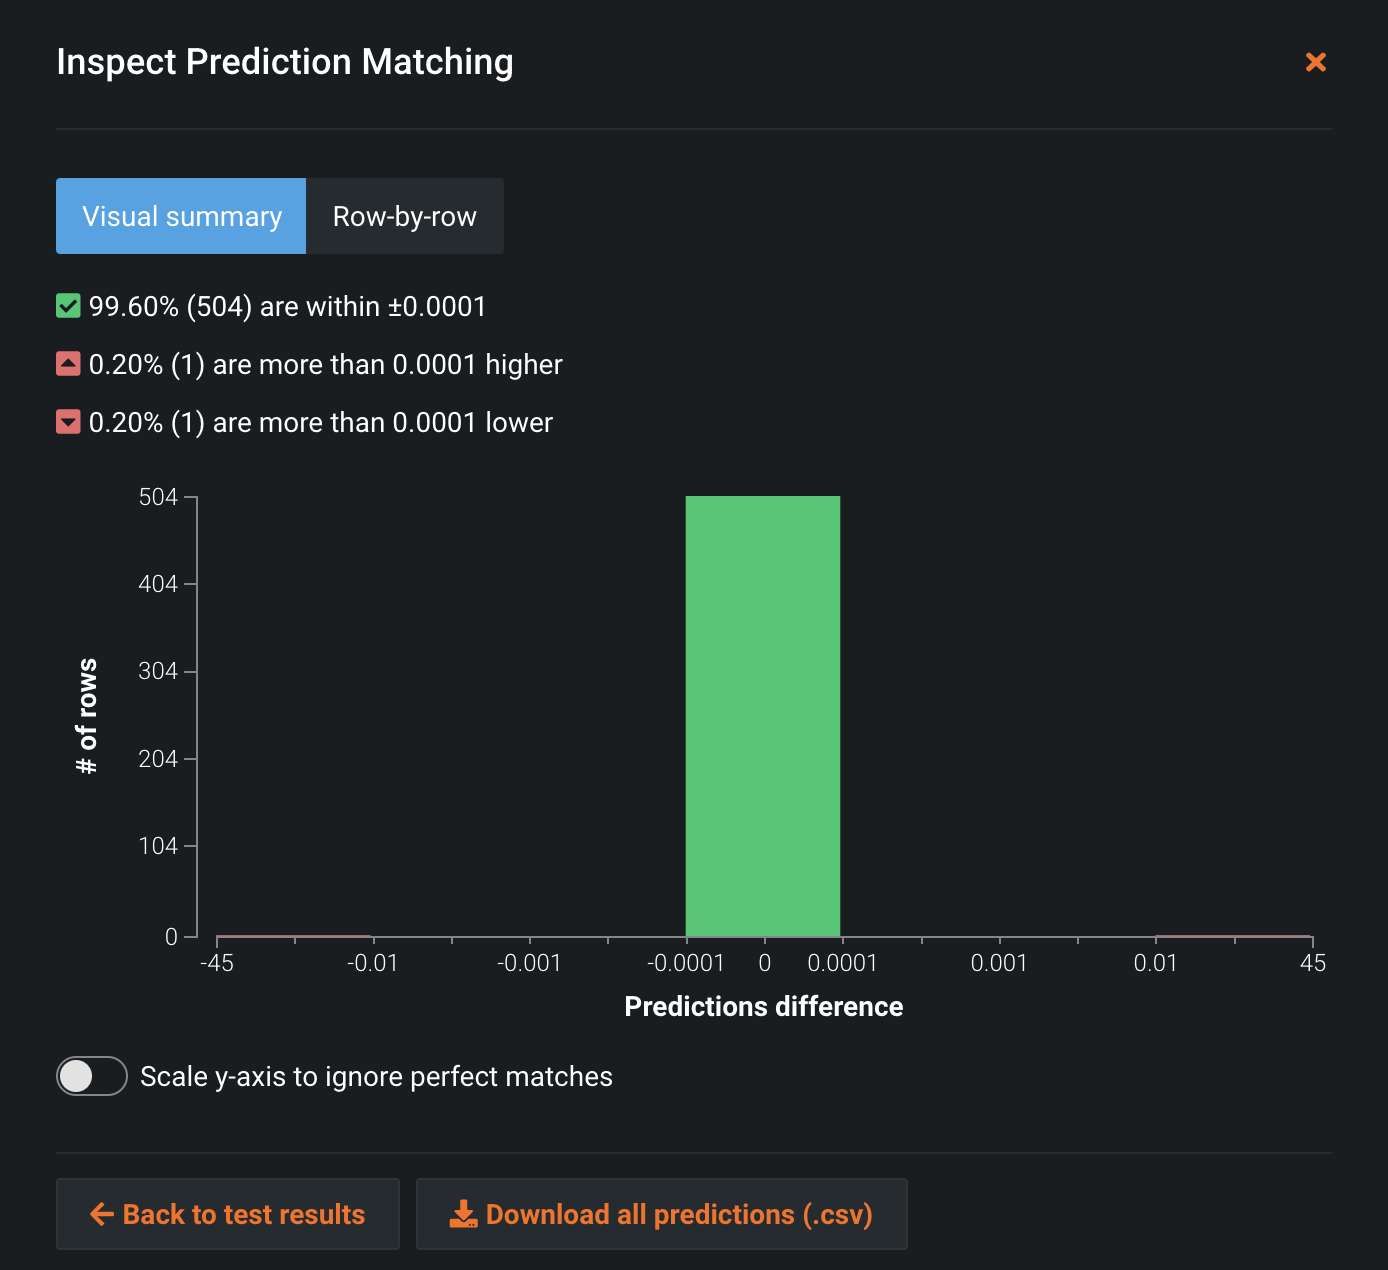
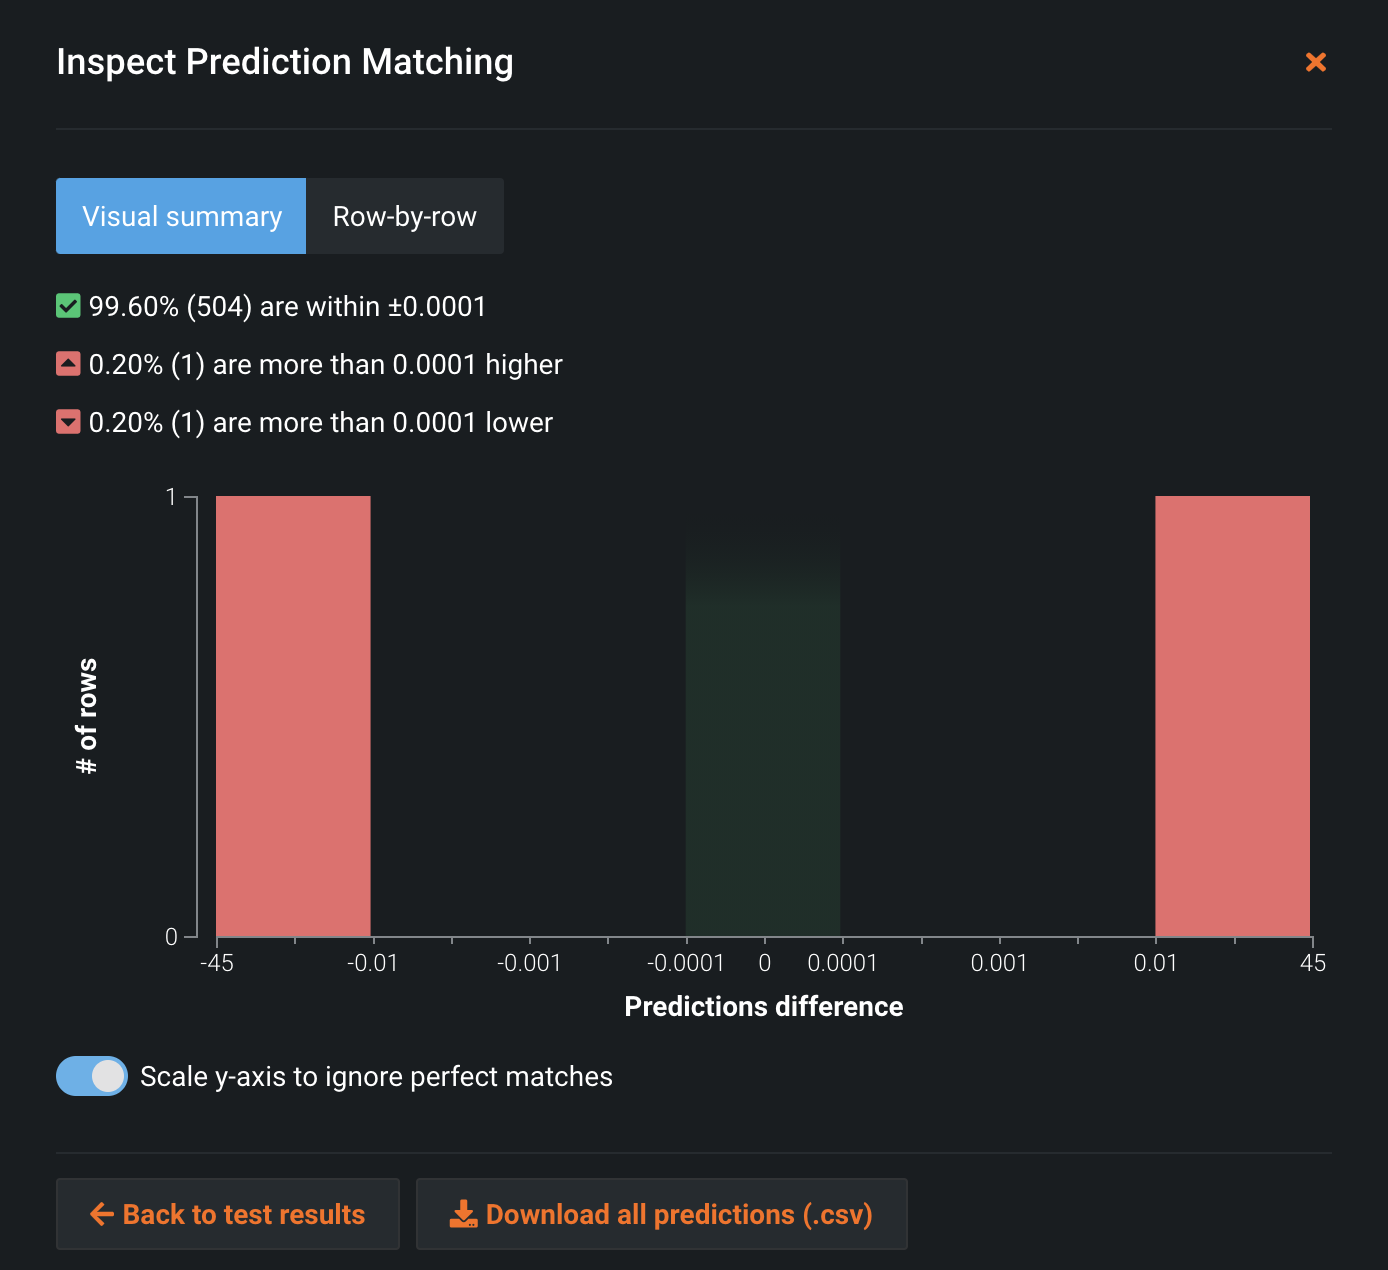
The insights for the prediction verification check display a histogram of differences between the model predictions and the reference predictions.
Use the toggle to hide differences that represent matching predictions.
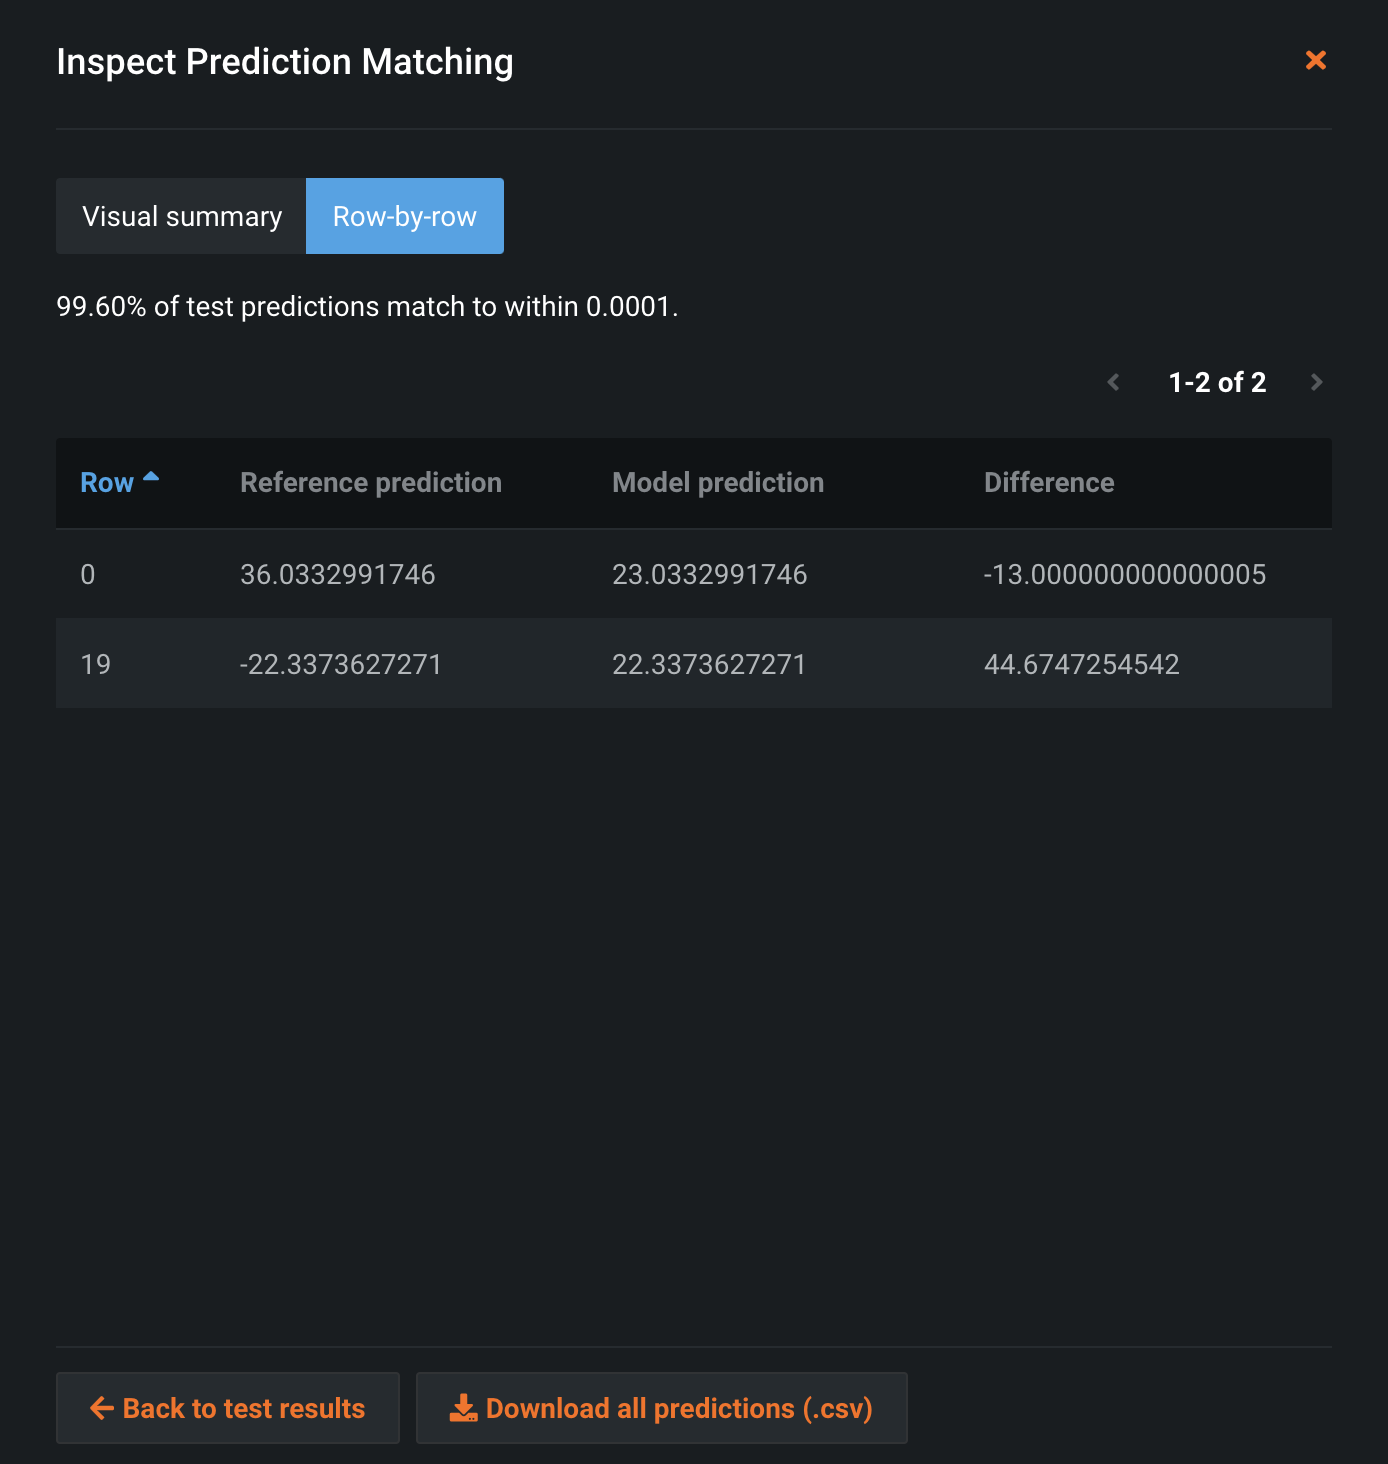
In addition to the histogram, the prediction verification insights include a table containing rows for which model predictions do not match with reference predictions. The table values can be ordered by row number, or by the difference between a model prediction and a reference prediction.
