Blueprint
During the course of building predictive models, DataRobot runs several different versions of each algorithm and tests thousands of possible combinations of data preprocessing and parameter settings. (Many of the models use DataRobot proprietary approaches to data preprocessing.) The result of this testing is provided in the Blueprints tab.
Blueprints are ML pipelines containing preprocessing steps, modeling algorithms, and post-processing steps. They can be generated either automatically as part of Autopilot or manually/programmatically. Blueprints are found in three places in the application:
- From the Leaderboard, as a visualization available for each trained models (this tab).
- From the Repository, which contains all blueprints generated by (although not necessarily built by) Autopilot for a project.
- In the AI Catalog, under the Blueprints tab.
What is the difference between a model and a blueprint?
A modeling algorithm fits a model to data, which is just one component of a blueprint. A blueprint represents the high-level, end-to-end procedure for fitting the model, including any preprocessing steps, modeling, and post-processing steps.
View blueprint nodes
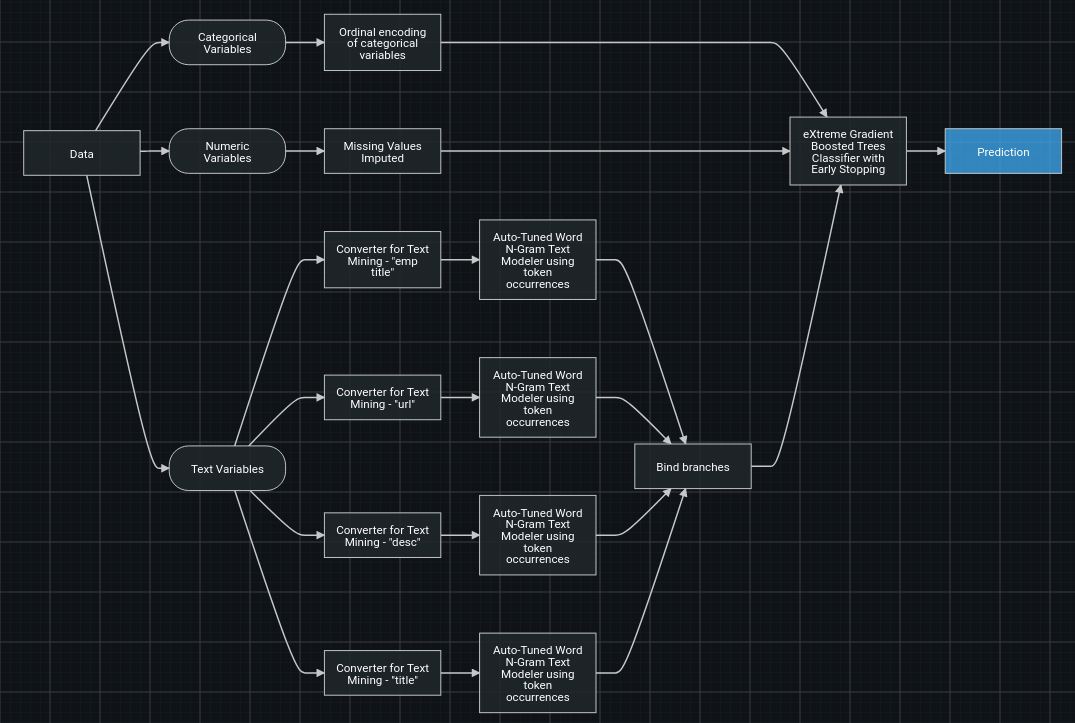
To view a graphical representation of a blueprint, click a model on the Leaderboard.
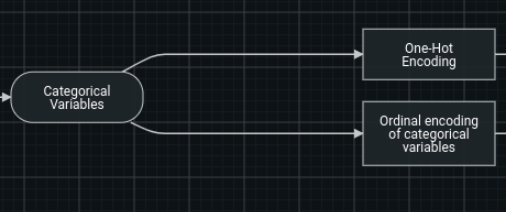
You can also show the full blueprint. To enable a detailed view that displays all the branches of the original algorithm, click the Show full blueprint toggle:
If a model uses all of the feature types contained in the project data (numeric, categorical, date, text etc.), the full blueprint toggle is disabled. This is because the summary and detailed blueprints will be the same (all tasks were used).
Blueprint components
Each blueprint has a few key sections.
| Section | Description |
|---|---|
Data |
The incoming data, separated into each type (categorical, numeric, text, image, geospatial, etc.). |
| Transformations | The tasks that perform transformations on the data (for example, Missing values imputed). Different columns in the dataset require different types of preparation and transformation. For example, some algorithms recommend subtracting the mean and dividing by the standard deviation of the input data—but this would not make sense for text input data. The first step in the execution of a blueprint is to identify data types that belong together so they can be processed separately. |
| Model(s) | The model(s) making predictions or possibly supplying stacked predictions to a subsequent model. |
| Post-processing | Any post-processing steps, such as Calibration. |
Prediction |
The data being sent as the final predictions. |
Each blueprint has nodes and edges (i.e., connections). A node will take in data, perform an operation, and output the data in its new form. An edge is a representation of the flow of data.
When two edges are received by a single node:
It is a representation of two sets of columns being received by the node— the two sets of columns are stacked horizontally. That is, the column count of the incoming data is the sum of the two sets of columns and the row count remains the same.
If two edges are output by a single node, it is a representation of two copies of the output data being sent to other nodes. Other nodes in the blueprint are other types of data transformations or models.
Click a blueprint node to display additional information, including access to model documentation.
Blueprint controls
From the blueprint canvas, you can:
- Click, hold, and drag to move the blueprint around the canvas.
- Add the blueprint to the AI Catalog for later editing, re-use, and sharing.
- Copy and edit blueprints.
Modifying blueprints
Click Copy and Edit to open the Composable ML blueprint editor.
The editor opens in the detailed view of the blueprint. In this case, the toggle is disabled because the version used for modeling is not relevant to editing the complete blueprint.


