Out-of-time validation (OTV)
Out-of-time validation (OTV) is a method for modeling time-relevant data. With OTV you are not forecasting, as with time series. Instead, you are predicting the target value on each individual row.
As with time series modeling, the underlying structure of OTV modeling is date/time partitioning. In fact, OTV is date/time partitioning, with additional components such as sophisticated preprocessing and insights from the Accuracy over Time graph.
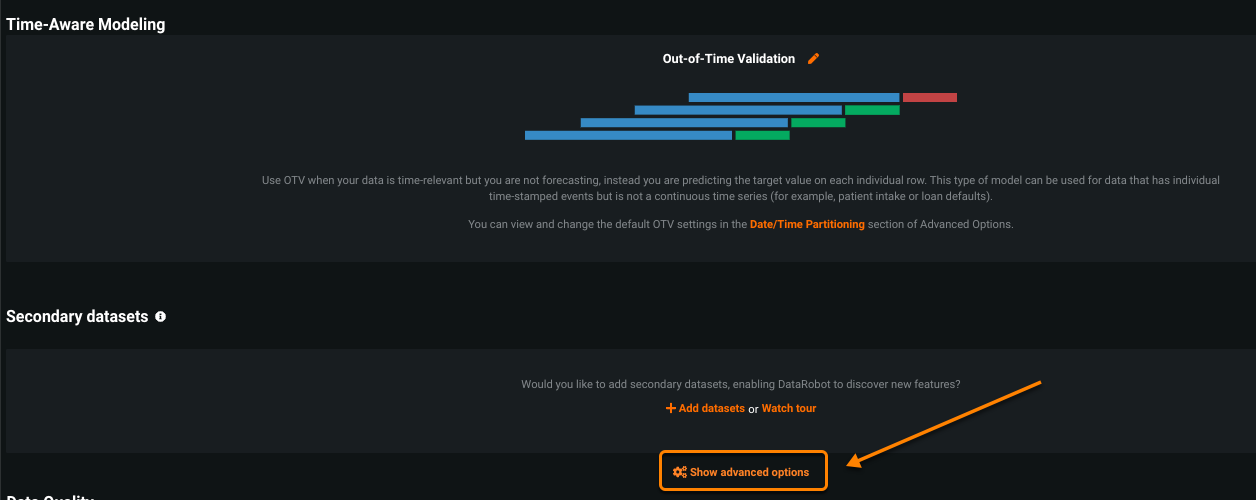
To activate time-aware modeling, your dataset must contain a column with a variable type “Date” for partitioning. If it does, the date/time partitioning feature becomes available through the Set up time-aware modeling link on the Start screen. After selecting a time feature, you can then use the Advanced options link to further configure your model build.
The following sections describe the date/time partitioning workflow.
See these additional date/time partitioning considerations for OTV and time series modeling.
Basic workflow
To build time-aware models:
-
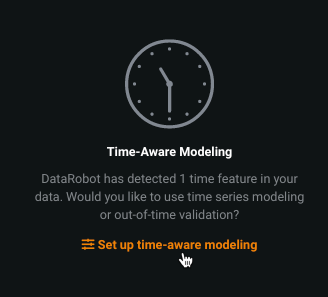
Load your dataset (see the file size requirements) and select your target feature. If your dataset contains a date feature, the Set up time-aware modeling link activates. Click the link to get started.
-
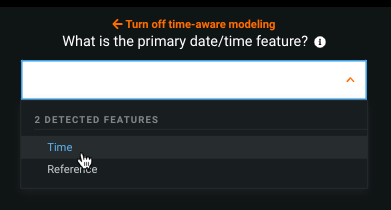
From the dropdown, select the primary date/time feature. The dropdown lists all date/time features that DataRobot detected during EDA1.
-
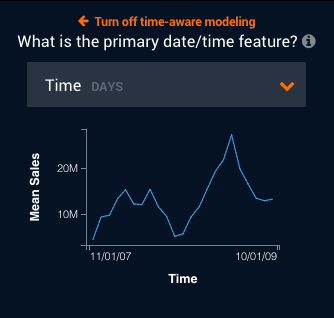
After selecting a feature, DataRobot computes and then loads a histogram of the time feature plotted against the target feature (feature-over-time). Note that if your dataset qualifies for multiseries modeling, this histogram represents the average of the time feature values across all series plotted against the target feature.
-
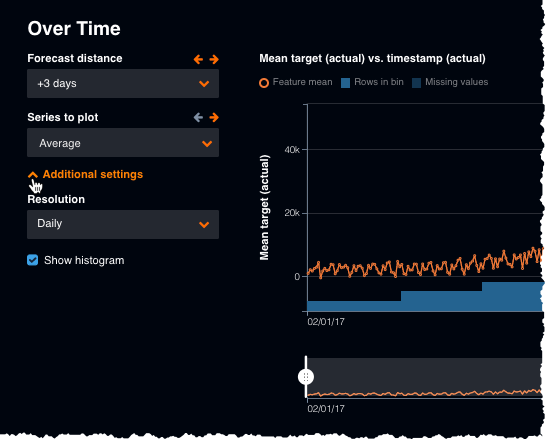
Explore what other features look like over time to view trends and determine whether there are gaps in your data (which is a data flaw you need to know about). To access these histograms, expand a numeric feature, click the Over Time tab, and click Compute Feature Over Time:
You can interact with the Over Time chart in several ways, described below.
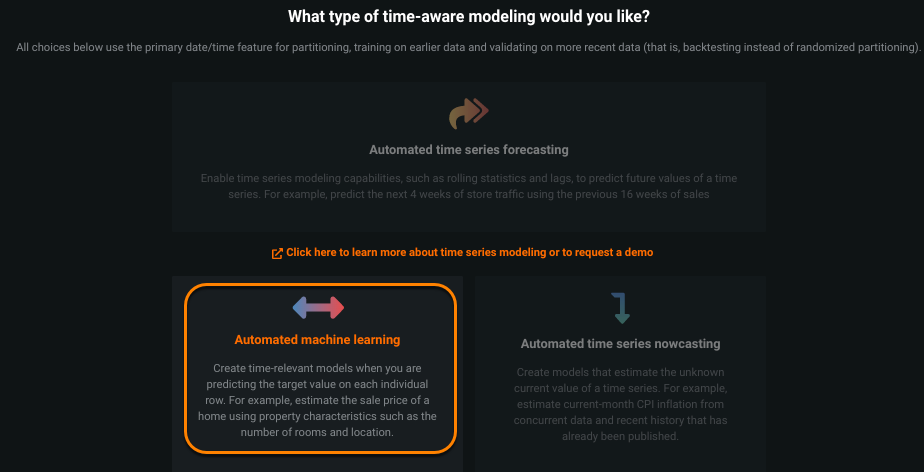
Finally, set the type of time-aware modeling to Automated machine learning and consider whether to change the default settings in advanced options. If you have time series modeling enabled, and want to use a method other than OTV, see the time series workflow.
Advanced options
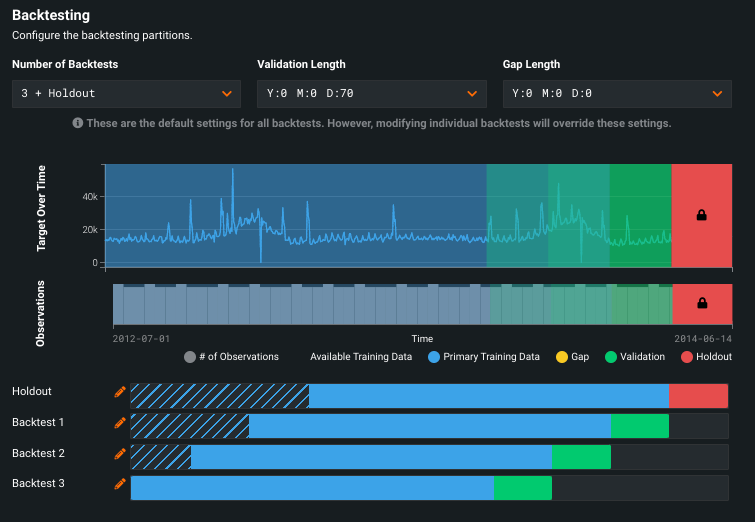
Expand the Show Advanced options link to set details of the partitioning method. When you enable time-aware modeling, Advanced options opens to the date/time partitioning method by default. The Backtesting section of date/time partitioning provides tools for configuring backtests for your time-aware projects.
DataRobot detects the date and/or time format (standard GLIBC strings) for the selected feature. Verify that it is correct. If the format displayed does not accurately represent the date column(s) of your dataset, modify the original dataset to match the detected format and re-upload it.
Configure the backtesting partitions. You can set them from the dropdowns (applies global settings) or by clicking the bars in the visualization (applies individual settings). Individual settings override global settings. Once you modify settings for an individual backtest, any changes to the global settings are not applied to the edited backtest.
Date/date range representation
DataRobot uses date points to represent dates and date ranges within the data, applying the following principles:
-
All date points adhere to ISO 8601, UTC (e.g., 2016-05-12T12:15:02+00:00), an internationally accepted way to represent dates and times, with some small variation in the duration format. Specifically, there is no support for ISO weeks (e.g., P5W).
-
Models are trained on data between two ISO dates. DataRobot displays these dates as a date range, but inclusion decisions and all key boundaries are expressed as date points. When you specify a date, DataRobot includes start dates and excludes end dates.
-
Once changes are made to formats using the date partitioning column, DataRobot converts all charts, selectors, etc. to this format for the project.
Set backtest partitions globally
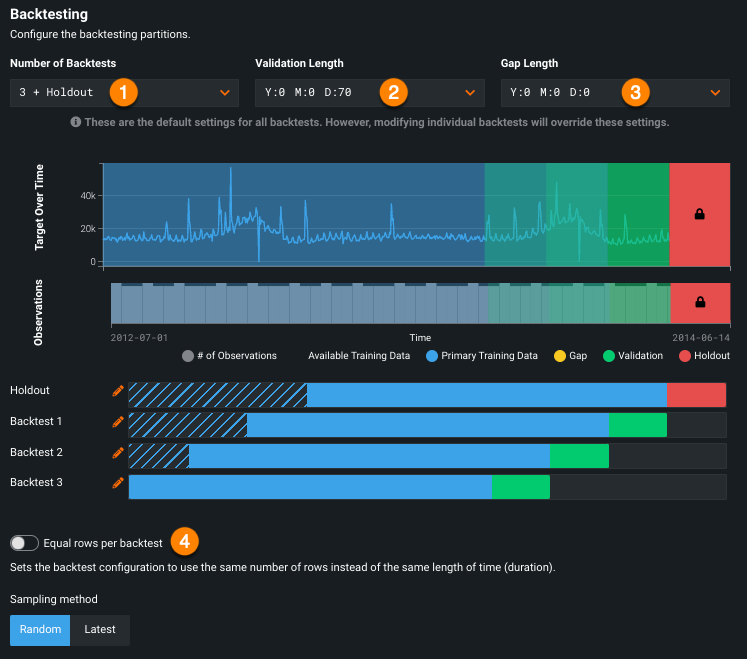
The following table describes global settings:
| Selection | Description | |
|---|---|---|
| 1 | Number of backtests | Configures the number of backtests for your project, the time-aware equivalent of cross-validation (but based on time periods or durations instead of random rows). |
| 2 | Validation length | Configures the size of the testing data partition. |
| 3 | Gap length | Configures spaces in time, representing gaps between model training and model deployment. |
| 4 | Sampling method | Sets whether to use duration or rows as the basis for partitioning, and whether to use random or latest data. |
See the table above for a description of the backtesting section's display elements.
Note
When changing partition year/month/day settings, note that the month and year values rebalance to fit the larger class (for example, 24 months becomes two years) when possible. However, because DataRobot cannot account for leap years or days in a month as it relates to your data, it cannot convert days into the larger container.
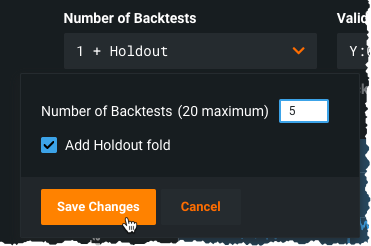
Set the number of backtests
You can change the number of backtests, if desired. The default number of backtests is dependent on the project parameters, but you can configure up to 20. Before setting the number of backtests, use the histogram to validate that the training and validation sets of each fold will have sufficient data to train a model. Requirements are:
-
For OTV, backtests require at least 20 rows in each validation and holdout fold and at least 100 rows in each training fold. If you set a number of backtests that results in any of the partitions not meeting that criteria, DataRobot only runs the number of backtests that do meet the minimums (and marks the display with an asterisk).
-
For time series, backtests require at least 4 rows in validation and holdout and at least 20 rows in the training fold. If you set a number of backtests that results in any of the partitions not meeting that criteria, the project could fail. See the time series partitioning reference for more information.
By default, DataRobot creates a holdout fold for training models in your project. In some cases, however, you may want to create a project without a holdout set. To do so, uncheck the Add Holdout fold box. If you disable the holdout fold, the holdout score column does not appear on the Leaderboard (and you have no option to unlock holdout). Any tabs that provide an option to switch between Validation and Holdout will not show the Holdout option.
Note
If you build a project with a single backtest, the Leaderboard does not display a backtest column.
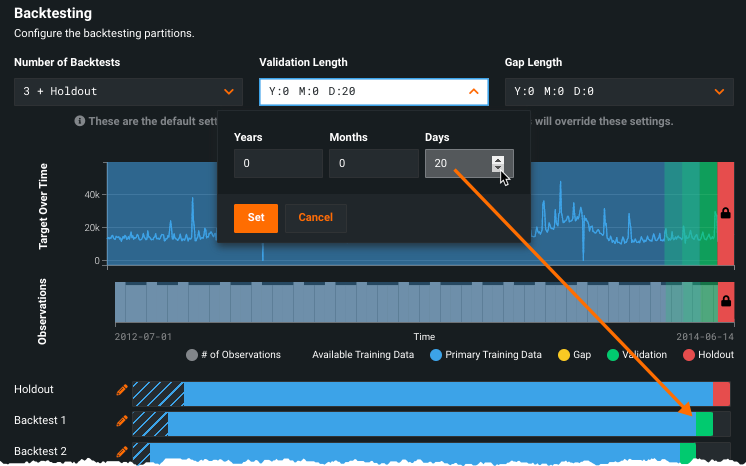
Set the validation length
To modify the duration, perhaps because of a warning message, click the dropdown arrow in the Validation length box and enter duration specifics. Validation length can also be set by clicking the bars in the visualization. Note the change modifications make in the testing representation:
Set the gap length
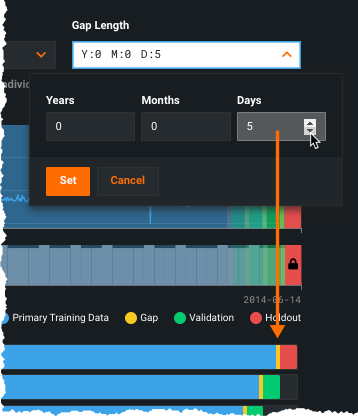
(Optional) Set the gap length from the Gap Length dropdown. Initially set to zero, DataRobot does not process a gap in testing. When set, DataRobot excludes the data that falls in the gap from use in training or evaluation of the model. Gap length can also be set by clicking the bars in the visualization.
Set rows or duration
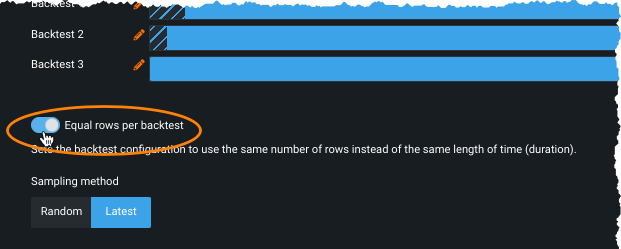
By default, DataRobot ensures that each backtest has the same duration, either the default or the values set from the dropdown(s) or via the bars in the visualization. If you want the backtest to use the same number of rows, instead of the same length of time, use the Equal rows per backtest toggle:
Time series projects also have an option to set row or duration for the training data, used as the basis for feature engineering, in the training window format section.
Once you have selected the mechanism/mode for assigning data to backtests, select the sampling method, either Random or Latest, to select how to assign rows from the dataset.
Setting the sampling method is particularly useful if a dataset is not distributed equally over time. For example, if data is skewed to the most recent date, the results of using 50% of random rows versus 50% of the latest will be quite different. By selecting the data more precisely, you have more control over the data that DataRobot trains on.
Change backtest partitions
If you don't modify any settings, DataRobot disperses rows to backtests equally. However, you can customize an individual backtest's gap, training, validation, and holdout data by clicking the corresponding bar or the pencil icon (![]() ) in the visualization. Note that:
) in the visualization. Note that:
-
You can only set holdout in the Holdout backtest ("backtest 0"), you cannot change the training data size in that backtest.
-
If, during the initial partitioning detection, the backtest configuration of the ordering (date/time) feature, series ID, or target results in insufficient rows to cover both validation and holdout, DataRobot automatically disables holdout. If other partitioning settings are changed (validation or gap duration, start/end dates, etc.), holdout is not affected unless manually disabled.
-
When Equal rows per backtest is checked (which sets the partitions to row-based assignment), only the Training End date is applicable.
-
When Equal rows per backtest is checked, the dates displayed are informative only (that is, they are approximate) and they include padding that is set by the feature derivation and forecast point windows.
Edit individual backtests
Regardless of whether you are setting training, gaps, validation, or holdout, elements of the editing screens function the same. Hover on a data element to display a tooltip that reports specific duration information:
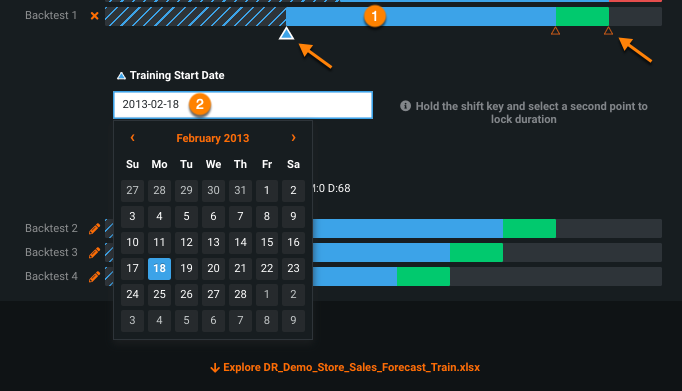
Click a section (1) to open the tool for modifying the start and/or end dates; click in the box (2) to open the calendar picker.
Triangle markers provide indicators of corresponding boundaries. The larger blue triangle (![]() ) marks the active boundary—the boundary that will be modified if you apply a new date in the calendar picker. The smaller orange triangle (
) marks the active boundary—the boundary that will be modified if you apply a new date in the calendar picker. The smaller orange triangle (![]() ) identifies the other boundary points that can be changed but are not currently selected.
) identifies the other boundary points that can be changed but are not currently selected.
The current duration for training, validation, and gap (if configured) is reported under the date entry box:
Once you have made changes to a data element, DataRobot adds an EDITED label to the backtest.
There is no way to remove the EDITED label from a backtest, even if you manually reset the durations back to the original settings. If you want to be able to apply global duration settings across all backtests, copy the project and restart.
Modify training and validation
To modify the duration of the training or validation data for an individual backtest:
- Click in the backtest to open the calendar picker tool.
- Click the triangle for the element you want to modify—options are training start (default), training end/validation start, or validation end.
- Modify dates as required.
Modify gaps
A gap is a period between the end of the training set and the start of the validation set, resulting in data being intentionally ignored during model training. You can set the gap length globally or for an individual backtest.
To set a gap, add time between training end and validation start. You can do this by ending training sooner, starting validation later or both.
-
Click the triangle at the end of the training period.
-
Click the Add Gap link.
DataRobot adds an additional triangle marker. Although they appear next to each other, both the selected (blue) and inactive (orange) triangles represent the same date. They are slightly spaced to make them selectable.
-
(Optional) Set the Training End Date using the calendar picker. The date you set will be the beginning of the gap period (training end = gap start).
-
Click the orange Validation Start Date marker; the marker changes to blue, indicating that it's selected.
-
(Optional) Set the Validation Start Date (validation start = gap end).
The gap is represented by a yellow band; hover over the band to view the duration.
Modify the holdout duration
To modify the holdout length, click in the red (holdout area) of backtest 0, the holdout partition. Click the displayed date in the Holdout Start Date to open the calendar picker and set a new date. If you modify the holdout partition and the new size results in potential problems, DataRobot displays a warning icon next to the Holdout fold. Click the warning icon (![]() ) to expand the dropdown and reset the duration/date fields.
) to expand the dropdown and reset the duration/date fields.
Lock the duration
You may want to make backtest date changes without modifying the duration of the selected element. You can lock duration for training, for validation, or for the combined period. To lock duration, click the triangle at one end of the period. Next, hold the Shift key and select the triangle at the other end of the locked duration. DataRobot opens calendar pickers for each element:
Change the date in either entry. Notice that the other date updates to mirror the duration change you made.
Interpret the display
The date/time partitioning display represents the training and validation data partitions as well as their respective sizes/durations. Use the visualization to ensure that your models are validating on the area of interest. The chart shows, for each backtest, the specific time period of values for the training, validation, and if applicable, holdout and gap data. Specifically, you can observe, for each backtest, whether the model will be representing an interesting or relevant time period. Will the scores represent a time period you care about? Is there enough data in the backtest to make the score valuable?
The following table describes elements of the display:
| Element | Description |
|---|---|
| Observations | The binned distribution of values (i.e., frequency), before downsampling, across the dataset. This is the same information as displayed in the feature’s histogram. |
| Available Training Data | The blue color bar indicates the training data available for a given fold. That is, all available data minus the validation or holdout data. |
| Primary Training Data | The dashed outline indicates the maximum amount of data you can train on to get scores from all backtest folds. You can later choose any time window for training, but depending on what you select, you may not then get all backtest scores. (This could happen, for example, if you train on data greater than the primary training window.) If you train on data less than or equal to the Primary Training Data value, DataRobot completes all backtest scores. If you train on data greater than this value, DataRobot runs fewer tests and marks the backtest score with an asterisk (*). This value is dependent on (changed by) the number of configured backtests. |
| Gap | A gap between the end of the training set and the start of the validation set, resulting in the data being intentionally ignored during model training. |
| Validation | A set of data indicated by a green bar that is not used for training (because DataRobot selects a different section at each backtest). It is similar to traditional validation, except that it is time based. The validation set starts immediately at the end of the primary training data (or the end of the gap). |
| Holdout (only if Add Holdout fold is checked) | The reserved (never seen) portion of data used as a final test of model quality once the model has been trained and validated. When using date/time partitioning, holdout is a duration or row-based portion of the training data instead of a random subset. By default, the holdout data size is the same as the validation data size and always contains the latest data. (Holdout size is user-configurable, however.) |
| Backtestx | Time- or row-based folds used for training models. The Holdout backtest is known as "backtest 0" and labeled as Holdout in the visualization. For small datasets and for the highest-scoring model from Autopilot, DataRobot runs all backtests. For larger datasets, the first backtest listed is the one DataRobot uses for model building. Its score is reported in the Validation column of the Leaderboard. Subsequent backtests are not run until manually initiated on the Leaderboard. |
Additionally, the display includes Target Over Time and Observations histograms. Use these displays to visualize the span of times where models are compared, measured, and assessed—to identify "regions of interest." For example, the displays help to determine the density of data over time, whether there are gaps in the data, etc.
In the displays, the green represents the selection of data that DataRobot is validating the model on. The "All Backtest" score is the average of this region. The gradation marks each backtest and its potential overlap with training data.
Study the Target Over Time graph to find interesting regions where there is some data fluctuation. It may be interesting to compare models over these regions. Use the Observations chart to determine whether, roughly speaking, the amount of data in a particular backtest is suitable.
Finally, you can click the red, locked holdout section to see where in the data the holdout scores are being measured and whether it is a consistent representation of your dataset.
Build time-aware models
Once you click Start, DataRobot begins the model-building process and returns results to the Leaderboard. Because time series modeling uses date/time partitioning, you can run backtests, change window sampling, change training periods, and more from the Leaderboard.
Note
Model parameter selection has not been customized for date/time-partitioned projects. Though automatic parameter selection yields good results in most cases, Advanced Tuning may significantly improve performance for some projects that use the Date/Time partitioning feature.
Date duration features
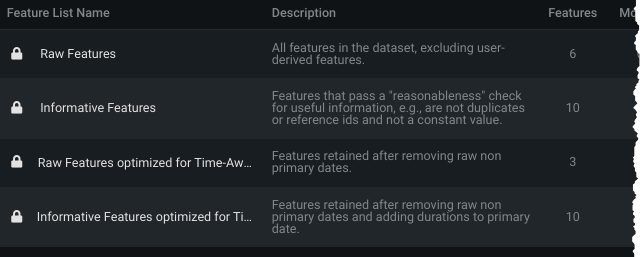
Because having raw dates in modeling can be risky (overfitting, for example, or tree-based models that do not extrapolate well), DataRobot generally excludes them from the Informative Features list if date transformation features were derived. Instead, for OTV projects, DataRobot creates duration features calculated from the difference between date features and the primary date. It then adds the duration features to an optimized Informative Features list. The automation process creates:
- New duration features
- New feature lists
New duration features
When derived features (hour of day, day of week, etc.) are created, the feature type of the newly derived features are not dates. Instead, they become categorical or numeric, for example. To ensure that models learn time distances better, DataRobot computes the duration between primary and non-primary dates, adds that calculation as a feature, and then drops all non-primary dates.
Specifically, when date derivations happen in an OTV project, DataRobot creates one or more new features calculated from the duration between dates. The new features are named duration(<from date>, <to date>), where the <from date> is the primary date. The var type, displayed on the Data page, displays Date Duration.
The transformation applies even if the time units differ. In that case, DataRobot computes durations in seconds and displays the information on the Data page (potentially as huge integers). In some cases, the value is negative because the <to date> may be before the primary date.
New feature lists
The new feature lists, automatically created based on Informative Features and Raw Features, are a copy of the originals with the duration feature(s) added. They are named the same, but with "optimized for time-aware modeling" appended. (For univariate feature lists, duration features are only added if the original date feature was part of the original univariate list.)
When you run full or Quick Autopilot, new feature lists are created later in the EDA2 process. DataRobot then switches the Autopilot process to use the new, optimized list. To use one of the non-optimized lists, you must rerun Autopilot specifying the list you want.
Time-aware models on the Leaderboard
Once you click Start, DataRobot begins the model-building process and returns results to the Leaderboard.
Note
Model parameter selection has not been customized for date/time-partitioned projects. Though automatic parameter selection yields good results in most cases, Advanced Tuning may significantly improve performance for some projects that use the Date/Time partitioning feature.
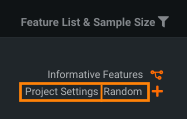
While most elements of the Leaderboard are the same, DataRobot's calculation and assignment of recommended models differs. Also, the Sample Size function is different for date/time-partitioned models. Instead of reporting the percentage of the dataset used to build a particular model, under Feature List & Sample Size, the default display lists the sampling method (random/latest) and either:
-
The start/end date (either manually added or automatically assigned for the recommended model:
-
The duration used to build the model:
-
The number of rows:
-
the Project Settings label, indicating custom backtest configuration:
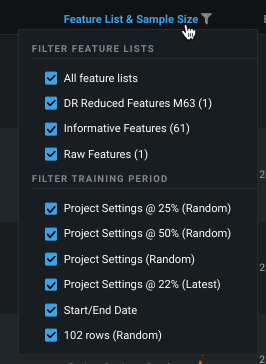
You can filter the Leaderboard display on the time window sample percent, sampling method, and feature list using the dropdown available from the Feature List & Sample Size. Use this to, for example, easily select models in a single Autopilot stage.
Autopilot does not optimize the amount of data used to build models when using Date/Time partitioning. Different length training windows may yield better performance by including more data (for longer model-training periods) or by focusing on recent data (for shorter training periods). You may improve model performance by adding models based on shorter or longer training periods. You can customize the training period with the Add a Model option on the Leaderboard.
Another partitioning-dependent difference is the origination of the Validation score. With date partitioning, DataRobot initially builds a model using only the first backtest (the partition displayed just below the holdout test) and reports the score on the Leaderboard. When calculating the holdout score (if enabled) for row count or duration models, DataRobot trains on the first backtest, freezes the parameters, and then trains the holdout model. In this way, models have the same relationship (i.e., end of backtest 1 training to start of backtest validation will be equivalent in duration to end of holdout training data to start of holdout).
Note, however, that backtesting scores are dependent on the sampling method selected. DataRobot only scores all backtests for a limited number of models (you must manually run others). The automatically run backtests are based on:
-
With random, DataRobot always backtests the best blueprints on the max available sample size. For example, if
BP0 on P1Y @ 50%has the best score, and BP0 has been trained onP1Y@25%,P1Y@50%andP1Y(the 100% model), DataRobot will score all backtests for BP0 trained on P1Y. -
With latest, DataRobot preserves the exact training settings of the best model for backtesting. In the case above, it would score all backtests for
BP0 on P1Y @ 50%.
Note that when the model used to score the validation set was trained on less data than the training size displayed on the Leaderboard, the score displays an asterisk. This happens when training size is equal to full size minus holdout.
Just like cross-validation, you must initiate a separate build for the other configured backtests (if you initially set the number of backtest to greater than 1). Click a model’s Run link from the Leaderboard, or use Run All Backtests for Selected Models from the Leaderboard menu. (You can use this option to run backtests for single or multiple models at one time.)
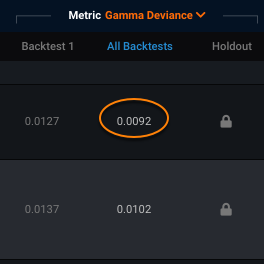
The resulting score displayed in the All Backtests column represents an average score for all backtests. See the description of Model Info for more information on backtest scoring.
Change the training period
Note
Consider retraining your model on the most recent data before final deployment.
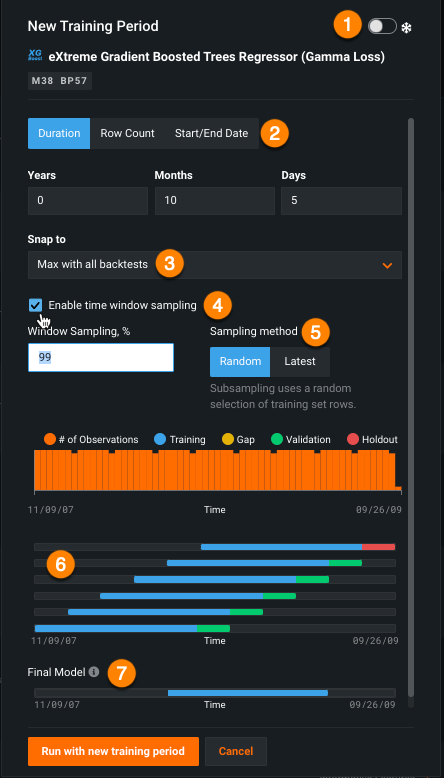
You can change the training range and sampling rate and then rerun a particular model for date-partitioned builds. Note that you cannot change the duration of the validation partition once models have been built; that setting is only available from the Advanced options link before the building has started. Click the plus sign (+) to open the New Training Period dialog:
The New Training Period box has multiple selectors, described in the table below:
| Selection | Description | |
|---|---|---|
| 1 | Frozen run toggle | Freeze the run |
| 2 | Training mode | Rerun the model using a different training period. Before setting this value, see the details of row count vs. duration and how they apply to different folds. |
| 3 | Snap to | "Snap to" predefined points, to facilitate entering values and avoid manually scrolling or calculation. |
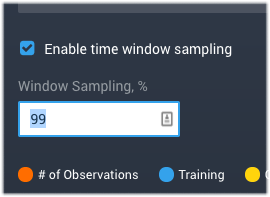
| 4 | Enable time window sampling | Train on a subset of data within a time window for a duration or start/end training mode. Check to enable and specify a percentage. |
| 5 | Sampling method | Select the sampling method used to assign rows from the dataset. |
| 6 | Summary graphic | View a summary of the observations and testing partitions used to build the model. |
| 7 | Final Model | View an image that changes as you adjust the dates, reflecting the data to be used in the model you will make predictions with (see the note below). |
Once you have set a new value, click Run with new training period. DataRobot builds the new model and displays it on the Leaderboard.
Setting the duration
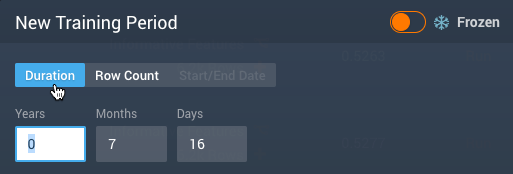
To change the training period a model uses, select the Duration tab in the dialog and set a new length. Duration is measured from the beginning of validation working back in time (to the left). With the Duration option, you can also enable time window sampling.
DataRobot returns an error for any period of time outside of the observation range. Also, the units available depend on the time format (for example, if the format is %d-%m-%Y, you won't have hours, minutes, and seconds).
Setting the row count
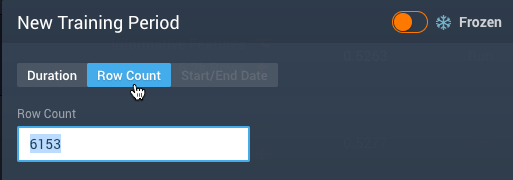
The row count used to build a model is reported on the Leaderboard as the Sample Size. To vary this size, Click the Row Count tab in the dialog and enter a new value.
Setting the start and end dates
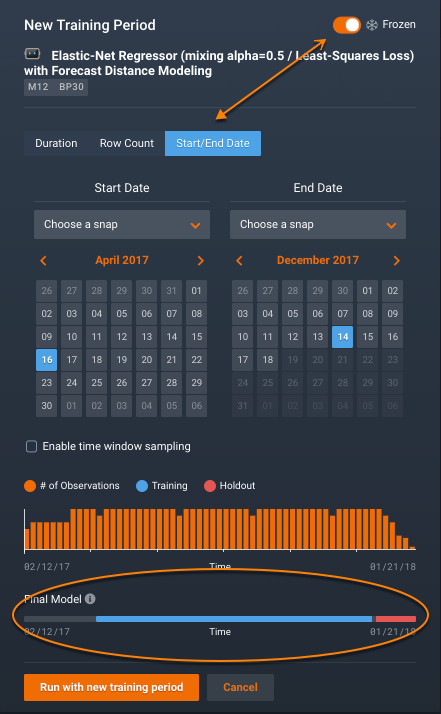
If you enable Frozen run by clicking the toggle, DataRobot re-uses the parameter settings it established in the original model run on the newly specified sample. Enabling Frozen run unlocks a third training criteria, Start/End Date. Use this selection to manually specify which data DataRobot uses to build the model. With this setting, after unlocking holdout, you can train a model into the Holdout data. (The Duration and Row Count selectors do not allow training into holdout.) Note that if holdout is locked and you overlap with this setting, the model building will fail. With the start and end dates option, you can also enable time window sampling.
When setting start and end dates, note the following:
- DataRobot does not run backtests because some of the data may have been used to build the model.
- The end date is excluded when extracting data. In other words, if you want data through December 31, 2015, you must set end-date to January 1, 2016.
- If the validation partition (set via Advanced options before initial model build) occurs after the training data, DataRobot displays a validation score on the Leaderboard. Otherwise, the Leaderboard displays N/A.
- Similarly, if any of the holdout data is used to build the model, the Leaderboard displays N/A for the Holdout score.
- Date/time partitioning does not support dates before 1900.
Click Start/End Date to open a clickable calendar for setting the dates. The dates displayed on opening are those used for the existing model. As you adjust the dates, check the Final model graphic to view the data your model will use.
Time window sampling
If you do not want to use all data within a time window for a date/time-partitioned project, you can train on a subset of data within a time window specification. To do so, check the Enable Time Window sampling box and specify a percentage. DataRobot will take a uniform sample over the time range using that percentage of the data. This feature helps with larger datasets that may need the full time window to capture seasonality effects, but could otherwise face runtime or memory limitations.
View summary information
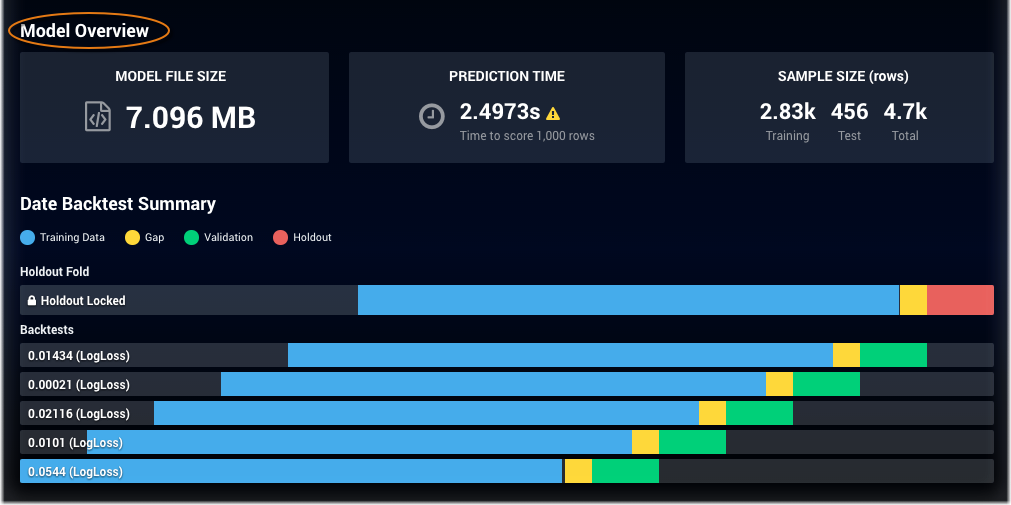
Once models are built, use the Model Info tab for the model overview, backtest summary, and resource usage information.
Some notes:
-
Hover over the folds to display rows, dates, and duration as they may differ from the values shown on the Leaderboard. The values displayed are the actual values DataRobot used to train the model. For example, suppose you request a Start/End Date model from 6/1/2015 to 6/30/2015 but there is only data in your dataset from 6/7/2015 to 6/14/2015, then the hover display indicates the actual dates, 6/7/2015 through 6/15/2015, for start and end dates, with a duration of eight days.
-
The Model Overview is a summary of row counts from the validation fold (the first fold under the holdout fold).
-
If you created duration-based testing, the validation summary could result in differences in numbers of rows. This is because the number of rows of data available for a given time period can vary.
-
A message of Not Yet Computed for a backtest indicates that there was not available data for the validation fold (for example, because of gaps in the dataset). In this case, where all backtests were not completed, DataRobot displays an asterisk on the backtest score.
-
The “reps” listed at the bottom correspond to the backtests above and are ordered in the sequence in which they finished running.
Understand a feature's Over Time chart
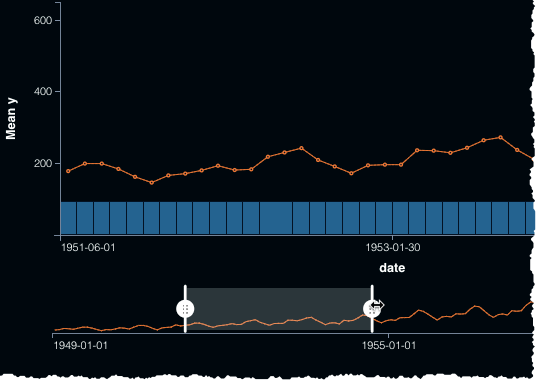
The Over time chart helps you identify trends and potential gaps in your data by displaying, for both the original modeling data and the derived data, how a feature changes over the primary date/time feature. It is available for all time-aware projects (OTV, single series, and multiseries). For time series, it is available for each user-configured forecast distance.
Using the page's tools, you can focus on specific time periods. Display options for OTV and single-series projects differ from those of multiseries. Note that to view the Over time chart you must first compute chart data. Once computed:
-
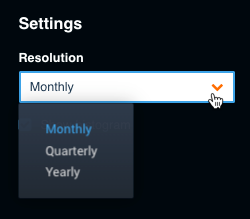
Set the chart's granularity. The resolution options are auto-detected by DataRobot. All project types allow you to set a resolution (this option is under Additional settings for multiseries projects).
-
Toggle the histogram display on and off to see a visualization of the bins DataRobot is using for EDA1.
-
Use the date range slider below the chart to highlight a specific region of the time plot. For smaller datasets, you can drag the sliders to a selected portion. Larger datasets use block pagination.
-
For multiseries projects, you can set both the forecast distance and an individual series (or average across series) to plot:
For time series projects, the Data page also provides a Feature Lineage chart to help understand the creation process for derived features.
Partition without holdout
Sometimes, you may want to create a project without a holdout set, for example, if you have limited data points. Date/time partitioning projects have a minimum data ingest size of 140 rows. If Add Holdout fold is not checked, minimum ingest becomes 120 rows.
By default, DataRobot creates a holdout fold. When you toggle the switch off, the red holdout fold disappears from the representation (only the backtests and validation folds are displayed) and backtests recompute and shift to the right. Other configuration functionality remains the same—you can still modify the validation length and gap length, as well as the number of backtests. On the Leaderboard, after the project builds, you see validation and backtest scores, but no holdout score or Unlock Holdout option.
The following lists other differences when you do not create a holdout fold:
- Both the Lift Chart and ROC Curve can only be built using the validation set as their Data Source.
- The Model Info tab shows no holdout backtest and or warnings related to holdout.
- You can only compute predictions for All data and the Validation set from the Predict tab.
- The Learning Curves graph does not plot any models trained into Validation or Holdout.
- Model Comparison uses results only from validation and backtesting.
About final models
The original ("final") model is trained without holdout data and therefore does not have the most recent data. Instead, it represents the first backtest. This is so that predictions match the insights, coefficients, and other data displayed in the tabs that help evaluate models. (You can verify this by checking the Final model representation on the New Training Period dialog to view the data your model will use.) If you want to use more recent data, retrain the model using start and end dates.
Note
Be careful retraining on all your data. In Time Series it is very common for historical data to have a negative impact on current predictions. There are a lot of good reasons not to retrain a model for deployment on 100% of the data. Think through how the training window can impact your deployments and ask yourself:
- "Is all of my data actually relevant to my recent predictions?
- Are there historical changes or events in my data which may negatively affect how current predictions are made, and that are no longer relevant?"
- Is anything outside my Backtest 1 training window size actually relevant?
Retrain before deployment
Once you have selected a model and unlocked holdout, you may want to retrain the model (although with hyperparameters frozen) to ensure predictive accuracy. Because the original model is trained without the holdout data, it therefore did not have the most recent data. You can verify this by checking the Final model representation on the New Training Period dialog to view the data your model will use.
To retrain the model, do the following:
-
On the Leaderboard, click the plus sign (+) to open the New Training Period dialog and change the training period.
-
View the final model and determine whether your model is trained on the most up-to-date data.
-
Enable Frozen run by clicking the slider.
-
Select Start/End Date and enter the dates for the retraining, including the dates of the holdout data. Remember to use the “+1” method (enter the date immediately after the final date you want to be included).
Model retraining
Retraining a model on the most recent data* results in the model not having out-of-sample predictions, which is what many of the Leaderboard insights rely on. That is, the child (recommended and rebuilt) model trained with the most recent data has no additional samples with which to score the retrained model. Because insights are a key component to both understanding DataRobot's recommendation and facilitating model performance analysis, DataRobot links insights from the parent (original) model to the child (frozen) model.
* This situation is also possible when a model is trained into holdout ("slim-run" models also have no stacked predictions).
The insights affected are:
- ROC Curve
- Lift Chart
- Confusion Matrix
- Stability
- Forecast Accuracy
- Series Insights
- Accuracy Over Time
- Feature Effect
Understanding backtests
Backtesting is conceptually the same as cross-validation in that it provides the ability to test a predictive model using existing historical data. That is, you can evaluate how the model would have performed historically to estimate how the model will perform in the future. Unlike cross-validation, however, backtests allow you to select specific time periods or durations for your testing instead of random rows, creating in-sequence, instead of randomly sampled, “trials” for your data. So, instead of saying “break my data into 5 folds of 1000 random rows each,” with backtests you say “simulate training on 1000 rows, predicting on the next 10. Do that 5 times.” Backtests simulate training the model on an older period of training data, then measure performance on a newer period of validation data. After models are built, through the Leaderboard you can change the training range and sampling rate. DataRobot then retrains the models on the shifted training data.
If the goal of your project is to predict forward in time, backtesting gives you a better understanding of model performance (on a time-based problem) than cross-validation. For time series problems, this equates to more confidence in your predictions. Backtesting confirms model robustness by allowing you to see whether a model consistently outperforms other models across all folds.
The number of backtests that DataRobot defaults to is dependent on the project parameters, but you can configure the build to include up to 20 backtests for additional model accuracy. Additional backtests provide you with more trials of your model so that you can be more sure about your estimates. You can carefully configure the duration and dates so that you can, for example, generate “10 two-month predictions.” Once configured to avoid specific periods, you can ask “Are the predictions similar?” or for two similar months, “Are the errors the same?”
Large gaps in your data can make backtesting difficult. If your dataset has long periods of time without any observed data, it is prudent to review where these gaps fall in your backtests. For example, if a validation window has too few data points, choosing a longer data validation window will ensure more reliable validation scores. While using more backtests may give you a more reliable measure of model performance, it also decreases the maximum training window available to the earliest backtest fold.
Understanding gaps
Configuring gaps allows you to reproduce time gaps usually observed between model training and model deployment (a period for which data is not to be used for training). It is useful in cases where, for example:
- Only older data is available for training (because ground truth is difficult to collect).
- When a model’s validation and subsequent deployment takes weeks or months.
- To deliver predictions in advance for review or actions.
A simple example: in insurance, it can take roughly a year for a claim to "develop" (the time between filing and determining the claim payout). For this reason, an actuary is likely to price 2017 policies based on models trained with 2015 data. To replicate this practice, you can insert a one-year gap between the training set and the validation set. This ensures that model evaluation is more correct. Other examples include when pricing needs regulator approval, retail sales for a seasonal business, and pricing estimates that rely on delayed reporting.
Feature considerations
Consider the following when working with OTV. Additionally, see the documented file requirements for information on file size considerations.
Note
Considerations are listed newest first for easier identification.
-
Frozen thresholds are not supported.
-
Blenders that contain monotonic models do not display the MONO label on the Leaderboard for OTV projects.
-
When previewing predictions over time, the interval only displays for models that haven’t been retrained (for example, it won’t show up for models with the Recommended for Deployment badge).
-
If you configure long backtest durations, DataRobot will still build models, but will not run backtests in cases where there is not enough data. In these case, the backtest score will not be available on the Leaderboard.
-
Timezones on date partition columns are ignored. Datasets with multiple time zones may cause issues. The workaround is to convert to a single time zone outside of DataRobot. Also there is no support for daylight savings time.
-
Dates before 1900 are not supported. If necessary, shift your data forward in time.
-
Leap seconds are not supported.
