Model Comparison
Comparing Leaderboard models can help identify the model that offers the highest business returns. It also can help select candidates for blender models; for example, you may blend two models with diverging predictions to improve accuracy—or two relatively strong models to improve your results further.
Note
Once you have selected the model that best fits your needs, you can deploy it directly from the model menu.
Model Comparison availability
The Model Comparison tab is available for all project types except:
- Multiclass (including extended multiclass and unlimited multiclass)
- Multilabel
- Unsupervised clustering
- Unsupervised anomaly detection for time-aware projects
- Parent projects in segmented modeling
If model comparison isn't supported, the tab does not display.
Compare models
To compare models in a project with at least two models built, either:
-
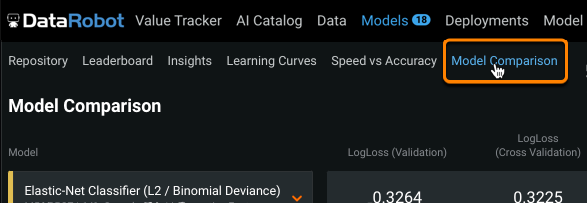
Select the Model Comparison tab.
-
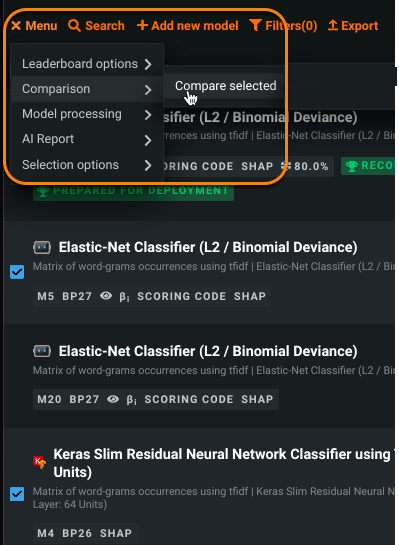
Select two models from the Leaderboard and use the Leaderboard menu's Compare Selected option.
Once on the page, select models from the dropdown. The associated model statistics update to reflect the currently selected model:
The Model Comparison page allows you to compare models using different evaluation tools. For the Lift Chart, ROC Curve, and Profit Curve, depending on the partitions available, you can select a data source to use as the basis of the display.
| Tool | Description |
|---|---|
| Accuracy metrics | Displays various accuracy metrics for the selected model. |
| Prediction time | Reports the time required for DataRobot to score the model's holdout. |
| Dual Lift Chart | Depicts model accuracy compared to actual results, based on the difference between the model prediction values. For each pair, click to compute data for the model. |
| Lift Chart | Depicts how effective a model is at predicting the target, letting you visualize the model's effectiveness. |
| ROC Curve | Helps to explore classification, performance, and statistics related to the selected models. On Model Comparison, it shows just the ROC Curve visualization and selected summary statistics for the selected models. It also allows you to view the prediction threshold used for modeling, predictions, and deployments. |
| Profit Curve | Helps compare the estimated business impact of the two selected models. The visualization includes both the payoff matrix and the accompanying graph. It also allows you to view the prediction threshold used for modeling, predictions, and deployments. See the tab for more complete information. |
| Accuracy Over Time (OTV, time series only)* | Visualizes how predictions change over time for each model, helping to compare model performance. Hover on any point in the chart to see predicted and actual values for each model. You can modify the partition and forecast distance for the display. Values are based on the Validation partition; to see training data you must first compute training predictions from the Evaluate > Accuracy Over Time tab. |
| Anomaly Over Time (OTV, time series only) | Visualizes when anomalies occur across the timeline of your data, functioning like the Accuracy Over Time chart, but with anomalies. Hover on any point in the chart to see predicted anomaly scores for each model. You can modify the partition for the display as well as the anomaly threshold of each model. Values are based on the Validation partition; to see training data you must first compute training predictions from the Evaluate > Anomaly Detection tab. |
Accuracy Over Time calculations*
Because multiseries projects can have up to 1 million series and up to 1000 forecast distances, calculating accuracy charts for all series data can be extremely compute-intensive and often unnecessary. To avoid this, DataRobot provides alternative calculation options.
Dual Lift Chart
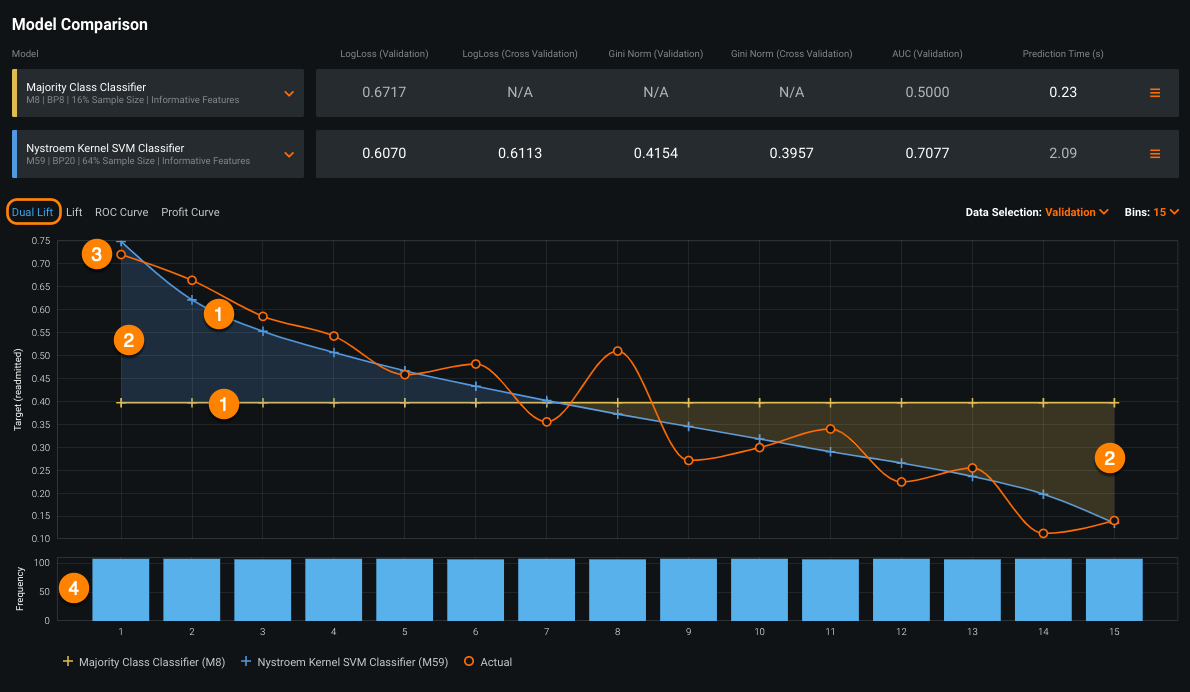
The Dual Lift chart is a mechanism for visualizing how two competing models perform against each other—their degree of divergence and relative performance. How well does each model segment the population? Like the Lift Chart, the Dual Lift also uses binning as the basis for plotting. However, while the standard Lift Chart sorts predictions (or adjusted predictions if you set the Exposure parameter in Advanced options) and then groups them, the Dual Lift Chart groups as follows:
- Calculate the difference between each model's prediction score (or adjusted predictions score if Exposure is set).
- Sort the rows according to the difference.
- Group the results based on the number of bins requested.
The Dual Lift Chart plots the following:
| Chart element | Description |
|---|---|
| Top or bottom model prediction (1) | For each model, and color-coded to match the model name, the data points represent the average prediction score for the rows in that bin. These values match those shown in the Lift Chart. |
| Difference measurement (2) | Shading to indicate the difference between the left and right models. |
| Actual value (3) | The actual percentage or value for the rows in the bin. |
| Frequency (4) | A measurement of the number of rows in each bin. Frequency changes as the number of bins changes. |
The Dual Lift Chart is a good tool for assessing candidates for ensemble modeling. Finding different models with large divergences in the target rate (orange line) could indicate good pairs of models to blend. That is, does a model show strength in a particular quadrant of the data? You might be able to create a strong ensemble by blending with a model that is strong in an opposite quadrant.
Interpret a Lift Chart
The points on the Lift Chart indicate either the average percentage (for binary classification) or the average value (for regression) in each bin. To compute the Lift Chart, the actuals are sorted based on the predicted value, binned, and then the average actuals for each model appears on the chart.
A Lift Chart is especially valuable for propensity modeling, for example, for finding which model is the best at identifying customers most likely to take action. For this, points on the Lift Chart indicate, for each model, the average actuals value in each bin. For a general discussion of a Lift Chart, see the Leaderboard tab description.
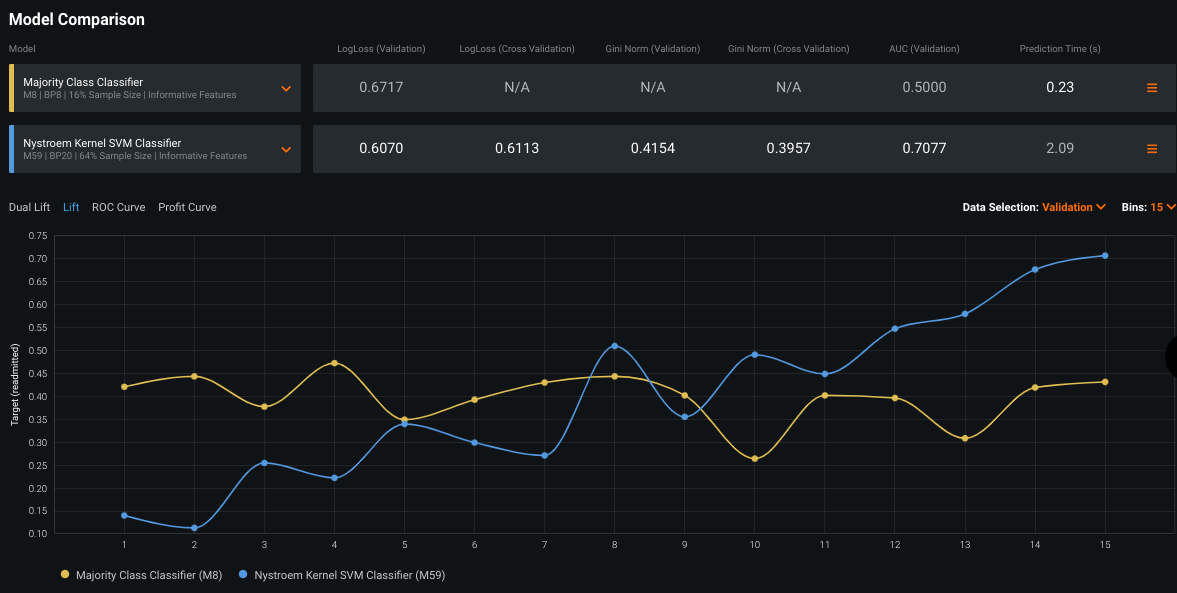
To understand the value of a Lift Chart, consider the sample model comparison Lift Chart below:
Both models make pretty similar predictions in bins 5, 8, 9, and 11. From this you can assume that in the mean of the distribution, they are both predicting well. However, on the left side, the majority class classifier (yellow line) is consistently over-predicting relative to the SVM classifier (blue line). On the right side, you can see that majority class classifier is under-predicting. Notice:
-
The blue model is better than the yellow model, because the lift curve is “steeper" and a steeper curve indicates a better model.
-
Now knowing that the blue model is better, you can notice that the yellow model is especially bad in the tails of the distribution. Look at bin 1 where the blue model is predicting very low and bin 10 where the blue model is predicting very high.
The take-aways? The yellow model (majority class classifier) does not suit this data particularly well. While the blue model (SVM classifier) is trending the right way pretty consistently, the yellow model jumps around. The blue model is probably your better choice.


